
Key Insights
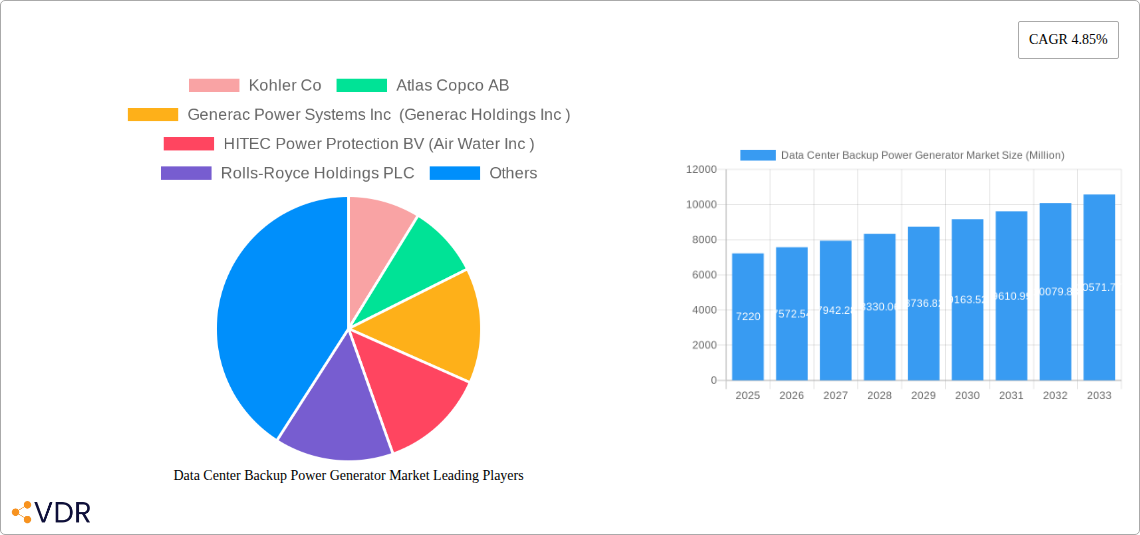
The Data Center Backup Power Generator market, valued at $7.22 billion in 2025, is projected to experience robust growth, driven by the increasing demand for reliable power in data centers globally. The market's Compound Annual Growth Rate (CAGR) of 4.85% from 2025 to 2033 signifies a consistent expansion, fueled by several key factors. The rising adoption of cloud computing and the proliferation of edge data centers necessitate uninterrupted power supply, boosting the demand for backup power generators. Furthermore, stringent regulatory compliance related to data center uptime and the growing awareness of potential power outages are major drivers. Market segmentation reveals a diverse landscape, with diesel generators holding a significant share due to their established reliability and higher power capacity. However, the natural gas segment is witnessing considerable growth due to its comparatively cleaner and more sustainable nature. Capacity segmentation indicates a strong preference for generators with capacities greater than 2MW in larger data centers, while smaller facilities favor less than 1MW units. Geographic analysis suggests strong growth in North America and Asia Pacific, driven by the burgeoning IT infrastructure and substantial investments in data center construction. However, growth across all regions is anticipated, driven by increasing awareness regarding disaster recovery and business continuity. The competitive landscape is highly fragmented, with major players such as Kohler, Generac, and Caterpillar competing through technological advancements and strategic partnerships.
The market's growth trajectory is, however, tempered by certain restraints. High initial investment costs associated with backup power generators can present a barrier for entry for smaller data centers. Moreover, the stringent emission regulations in several regions are pushing manufacturers to invest in cleaner technologies, increasing the overall cost. This presents an opportunity for innovative solutions and technological advancements in areas such as fuel efficiency, emissions reduction, and remote monitoring capabilities. Future growth will largely depend on the continued expansion of the data center industry, technological innovation focusing on sustainability and efficiency, and the effectiveness of regulatory policies promoting resilience in critical infrastructure. The market's future will also be shaped by the adoption of alternative energy sources for backup power generation and the integration of smart technologies for improved monitoring and management of these systems.
Data Center Backup Power Generator Market: A Comprehensive Report (2019-2033)
This in-depth report provides a comprehensive analysis of the Data Center Backup Power Generator Market, encompassing market dynamics, growth trends, regional analysis, product landscape, key players, and future outlook. The study period covers 2019-2033, with 2025 as the base and estimated year. The report segments the market by product type (Diesel, Natural Gas, Other Product Types), capacity (Less than 1MW, 1-2MW, Greater than 2MW), and Tier (Tier I & II, Tier III, Tier IV), providing granular insights into each segment's performance and growth potential. The market is valued at xx Million units in 2025 and is projected to reach xx Million units by 2033, exhibiting a CAGR of xx%.
Data Center Backup Power Generator Market Market Dynamics & Structure
The Data Center Backup Power Generator market is characterized by a moderately concentrated landscape, with key players like Kohler Co, Atlas Copco AB, Generac Power Systems Inc, HITEC Power Protection BV, Rolls-Royce Holdings PLC, Caterpillar Inc, Mitsubishi Heavy Industries Group, Cummins Inc, Himoinsa SL, and Aksa Power Generation vying for market share. Technological innovation, driven by increasing demand for higher efficiency and reliability, is a key growth driver. Stringent regulatory frameworks concerning emissions and safety standards significantly influence market dynamics. The market also witnesses competitive pressure from alternative power solutions, including battery storage systems. The end-user demographic largely comprises hyperscale data centers, colocation facilities, and enterprise data centers, with a global distribution influenced by the burgeoning digital economy. M&A activity in the sector remains moderate, with xx deals recorded in the past five years, primarily focused on enhancing technological capabilities and geographic reach.
- Market Concentration: Moderately concentrated, with top 10 players holding xx% market share in 2025.
- Technological Innovation: Focus on fuel efficiency, reduced emissions, and advanced control systems.
- Regulatory Landscape: Stringent emission norms and safety regulations in developed markets.
- Competitive Substitutes: Battery storage systems and other renewable energy sources.
- End-User Demographics: Hyperscale data centers, colocation facilities, and enterprise data centers.
- M&A Trends: Moderate activity, driven by expansion and technological advancements.
Data Center Backup Power Generator Market Growth Trends & Insights
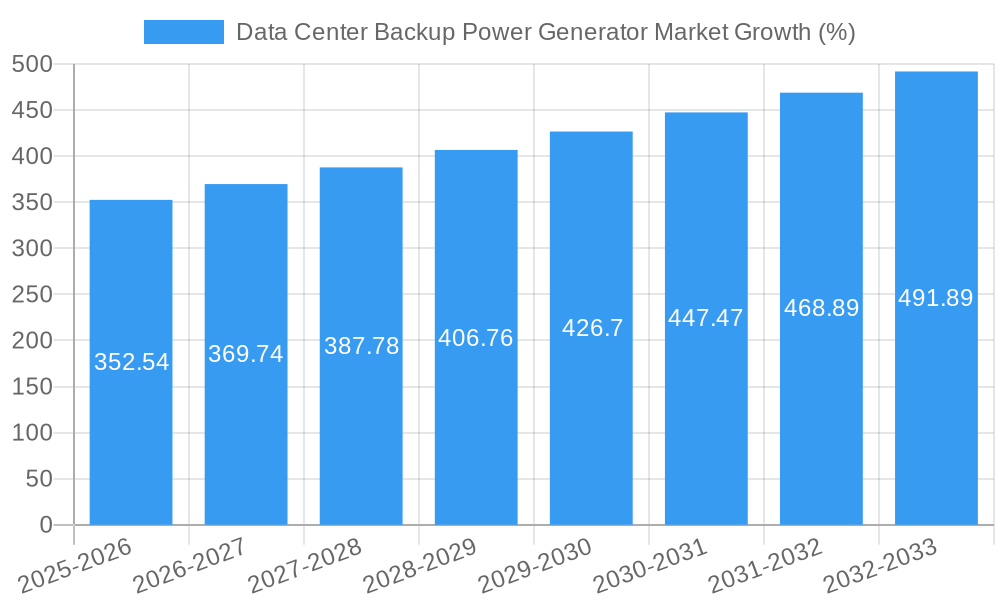
The Data Center Backup Power Generator market has witnessed consistent growth throughout the historical period (2019-2024), fueled by the exponential growth of data centers globally. The increasing reliance on digital infrastructure, coupled with the rising demand for uninterrupted power supply, has significantly boosted market adoption rates. Technological disruptions, such as the integration of smart grids and advanced control systems, are reshaping the market landscape. Consumer behavior shifts towards greater emphasis on energy efficiency and sustainability are further driving the adoption of advanced generator technologies. The market size is expected to grow from xx Million units in 2024 to xx Million units in 2025, representing a xx% increase. The forecast period (2025-2033) projects a CAGR of xx%, driven by the continued expansion of data center infrastructure in developing economies and the increasing adoption of cloud computing. Market penetration is estimated at xx% in 2025.
Dominant Regions, Countries, or Segments in Data Center Backup Power Generator Market
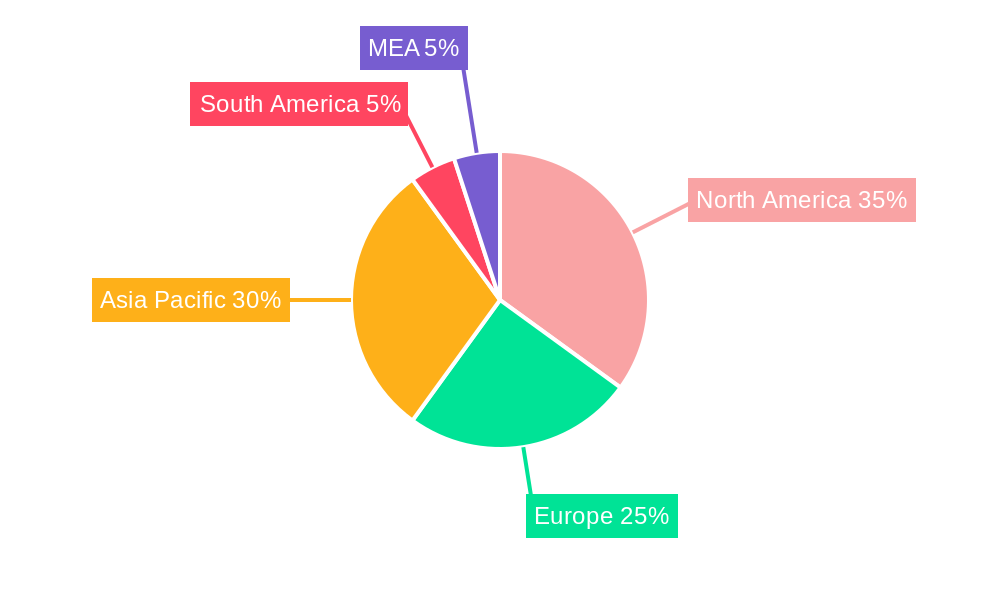
The North American region currently dominates the Data Center Backup Power Generator market, driven by the high concentration of hyperscale data centers and robust IT infrastructure. Within this region, the United States holds the largest market share. However, the Asia-Pacific region is projected to exhibit the fastest growth rate during the forecast period, fueled by rapid digitalization and increasing investments in data center infrastructure across countries like China, Japan, and India.
By Product Type: The Diesel segment currently holds the largest market share, attributed to its reliability and cost-effectiveness. However, the Natural Gas segment is expected to experience significant growth due to environmental concerns and the increasing availability of natural gas infrastructure.
By Capacity: The 1-2MW capacity segment dominates the market, driven by the widespread adoption of medium-sized data centers. However, the Greater than 2MW segment is showing rapid growth with the emergence of large hyperscale facilities.
By Tier: The Tier III segment is currently leading the market, reflecting the widespread adoption of high-availability data centers. However, the Tier IV segment is poised for rapid growth with the increasing demand for ultra-reliable data center infrastructure.
- Key Drivers (North America): Robust IT infrastructure, high concentration of data centers, stringent regulatory compliance.
- Key Drivers (Asia-Pacific): Rapid digitalization, rising investments in data center infrastructure, increasing government support for digital economy.
- Market Share & Growth Potential: North America (xx%), Asia-Pacific (xx%), Europe (xx%), Rest of World (xx%).
Data Center Backup Power Generator Market Product Landscape
The Data Center Backup Power Generator market offers a wide range of products catering to diverse power requirements and environmental regulations. Recent innovations include generators with enhanced fuel efficiency, reduced noise levels, and improved emission control systems. Many manufacturers emphasize remote monitoring capabilities and predictive maintenance features to maximize uptime and reduce operational costs. Products are differentiated by factors such as capacity, fuel type, efficiency ratings, and features like paralleling capabilities and automatic transfer switches.
Key Drivers, Barriers & Challenges in Data Center Backup Power Generator Market
Key Drivers:
- Increasing demand for reliable power in data centers.
- Growth of cloud computing and hyperscale data centers.
- Stringent regulatory compliance for emissions and safety.
Key Challenges:
- Fluctuating fuel prices and supply chain disruptions impacting operational costs.
- Increasing competition from alternative power solutions (e.g., battery storage).
- Regulatory hurdles related to emission standards and environmental regulations. This results in a xx% increase in operational costs for certain manufacturers.
Emerging Opportunities in Data Center Backup Power Generator Market
- Growth in edge computing and distributed data centers creating opportunities for smaller, modular generators.
- Integration of renewable energy sources with backup generators offering hybrid solutions.
- Development of smart generators with advanced monitoring and control capabilities.
Growth Accelerators in the Data Center Backup Power Generator Market Industry
Technological advancements, such as the development of more efficient and environmentally friendly generators, are driving long-term growth. Strategic partnerships between generator manufacturers and data center operators are enhancing market penetration. Expanding into emerging markets with growing data center infrastructure presents significant opportunities for growth.
Key Players Shaping the Data Center Backup Power Generator Market Market
- Kohler Co
- Atlas Copco AB
- Generac Power Systems Inc (Generac Holdings Inc)
- HITEC Power Protection BV (Air Water Inc)
- Rolls-Royce Holdings PLC
- Caterpillar Inc
- Mitsubishi Heavy Industries Group (MHI)
- Cummins Inc
- Himoinsa SL
- Aksa Power Generation
Notable Milestones in Data Center Backup Power Generator Market Sector
- October 2023: Rolls-Royce announced the supply of 31 mtu emergency gensets for a large hyperscale data center in Japan. This highlights the increasing demand for high-capacity backup power solutions in the Asia-Pacific region.
- August 2023: Mitsubishi Heavy Industries launched a new generator model (MGS3100R) in Singapore and Vietnam, showcasing innovation in meeting higher power demands for emergency generator sets.
In-Depth Data Center Backup Power Generator Market Market Outlook
The future of the Data Center Backup Power Generator market is bright, driven by continued growth in data center infrastructure, increasing demand for reliable power, and technological advancements. Strategic opportunities exist in developing energy-efficient and environmentally friendly solutions, expanding into emerging markets, and fostering partnerships to integrate backup generators within broader data center infrastructure solutions. The market is poised for significant expansion, with substantial opportunities for players who can adapt to evolving technological trends and customer needs.
Data Center Backup Power Generator Market Segmentation
-
1. Product Type
- 1.1. Diesel
- 1.2. Natural Gas
- 1.3. Other Product Types
-
2. Capacity
- 2.1. Less than 1MW
- 2.2. 1-2MW
- 2.3. Greater than 2MW
-
3. Tier
- 3.1. Tier I and II
- 3.2. Tier III
- 3.3. Tier IV
Data Center Backup Power Generator Market Segmentation By Geography
- 1. North America
- 2. Europe
- 3. Asia Pacific
- 4. Latin America
- 5. Middle East and Africa
Data Center Backup Power Generator Market REPORT HIGHLIGHTS
| Aspects | Details |
|---|---|
| Study Period | 2019-2033 |
| Base Year | 2024 |
| Estimated Year | 2025 |
| Forecast Period | 2025-2033 |
| Historical Period | 2019-2024 |
| Growth Rate | CAGR of 4.85% from 2019-2033 |
| Segmentation |
|
Table of Contents
- 1. Introduction
- 1.1. Research Scope
- 1.2. Market Segmentation
- 1.3. Research Methodology
- 1.4. Definitions and Assumptions
- 2. Executive Summary
- 2.1. Introduction
- 3. Market Dynamics
- 3.1. Introduction
- 3.2. Market Drivers
- 3.2.1. 4.; Increasing Construction of Data Centers by Colocation Service Providers4.; Growing Construction of Hyperscale Data Centers
- 3.3. Market Restrains
- 3.3.1. 4.; Growing Carbon Emissions from Data Centers
- 3.4. Market Trends
- 3.4.1. Natural Gas Segment to Witness Major Growth
- 4. Market Factor Analysis
- 4.1. Porters Five Forces
- 4.2. Supply/Value Chain
- 4.3. PESTEL analysis
- 4.4. Market Entropy
- 4.5. Patent/Trademark Analysis
- 5. Global Data Center Backup Power Generator Market Analysis, Insights and Forecast, 2019-2031
- 5.1. Market Analysis, Insights and Forecast - by Product Type
- 5.1.1. Diesel
- 5.1.2. Natural Gas
- 5.1.3. Other Product Types
- 5.2. Market Analysis, Insights and Forecast - by Capacity
- 5.2.1. Less than 1MW
- 5.2.2. 1-2MW
- 5.2.3. Greater than 2MW
- 5.3. Market Analysis, Insights and Forecast - by Tier
- 5.3.1. Tier I and II
- 5.3.2. Tier III
- 5.3.3. Tier IV
- 5.4. Market Analysis, Insights and Forecast - by Region
- 5.4.1. North America
- 5.4.2. Europe
- 5.4.3. Asia Pacific
- 5.4.4. Latin America
- 5.4.5. Middle East and Africa
- 5.1. Market Analysis, Insights and Forecast - by Product Type
- 6. North America Data Center Backup Power Generator Market Analysis, Insights and Forecast, 2019-2031
- 6.1. Market Analysis, Insights and Forecast - by Product Type
- 6.1.1. Diesel
- 6.1.2. Natural Gas
- 6.1.3. Other Product Types
- 6.2. Market Analysis, Insights and Forecast - by Capacity
- 6.2.1. Less than 1MW
- 6.2.2. 1-2MW
- 6.2.3. Greater than 2MW
- 6.3. Market Analysis, Insights and Forecast - by Tier
- 6.3.1. Tier I and II
- 6.3.2. Tier III
- 6.3.3. Tier IV
- 6.1. Market Analysis, Insights and Forecast - by Product Type
- 7. Europe Data Center Backup Power Generator Market Analysis, Insights and Forecast, 2019-2031
- 7.1. Market Analysis, Insights and Forecast - by Product Type
- 7.1.1. Diesel
- 7.1.2. Natural Gas
- 7.1.3. Other Product Types
- 7.2. Market Analysis, Insights and Forecast - by Capacity
- 7.2.1. Less than 1MW
- 7.2.2. 1-2MW
- 7.2.3. Greater than 2MW
- 7.3. Market Analysis, Insights and Forecast - by Tier
- 7.3.1. Tier I and II
- 7.3.2. Tier III
- 7.3.3. Tier IV
- 7.1. Market Analysis, Insights and Forecast - by Product Type
- 8. Asia Pacific Data Center Backup Power Generator Market Analysis, Insights and Forecast, 2019-2031
- 8.1. Market Analysis, Insights and Forecast - by Product Type
- 8.1.1. Diesel
- 8.1.2. Natural Gas
- 8.1.3. Other Product Types
- 8.2. Market Analysis, Insights and Forecast - by Capacity
- 8.2.1. Less than 1MW
- 8.2.2. 1-2MW
- 8.2.3. Greater than 2MW
- 8.3. Market Analysis, Insights and Forecast - by Tier
- 8.3.1. Tier I and II
- 8.3.2. Tier III
- 8.3.3. Tier IV
- 8.1. Market Analysis, Insights and Forecast - by Product Type
- 9. Latin America Data Center Backup Power Generator Market Analysis, Insights and Forecast, 2019-2031
- 9.1. Market Analysis, Insights and Forecast - by Product Type
- 9.1.1. Diesel
- 9.1.2. Natural Gas
- 9.1.3. Other Product Types
- 9.2. Market Analysis, Insights and Forecast - by Capacity
- 9.2.1. Less than 1MW
- 9.2.2. 1-2MW
- 9.2.3. Greater than 2MW
- 9.3. Market Analysis, Insights and Forecast - by Tier
- 9.3.1. Tier I and II
- 9.3.2. Tier III
- 9.3.3. Tier IV
- 9.1. Market Analysis, Insights and Forecast - by Product Type
- 10. Middle East and Africa Data Center Backup Power Generator Market Analysis, Insights and Forecast, 2019-2031
- 10.1. Market Analysis, Insights and Forecast - by Product Type
- 10.1.1. Diesel
- 10.1.2. Natural Gas
- 10.1.3. Other Product Types
- 10.2. Market Analysis, Insights and Forecast - by Capacity
- 10.2.1. Less than 1MW
- 10.2.2. 1-2MW
- 10.2.3. Greater than 2MW
- 10.3. Market Analysis, Insights and Forecast - by Tier
- 10.3.1. Tier I and II
- 10.3.2. Tier III
- 10.3.3. Tier IV
- 10.1. Market Analysis, Insights and Forecast - by Product Type
- 11. North America Data Center Backup Power Generator Market Analysis, Insights and Forecast, 2019-2031
- 11.1. Market Analysis, Insights and Forecast - By Country/Sub-region
- 11.1.1 United States
- 11.1.2 Canada
- 11.1.3 Mexico
- 12. Europe Data Center Backup Power Generator Market Analysis, Insights and Forecast, 2019-2031
- 12.1. Market Analysis, Insights and Forecast - By Country/Sub-region
- 12.1.1 Germany
- 12.1.2 United Kingdom
- 12.1.3 France
- 12.1.4 Spain
- 12.1.5 Italy
- 12.1.6 Spain
- 12.1.7 Belgium
- 12.1.8 Netherland
- 12.1.9 Nordics
- 12.1.10 Rest of Europe
- 13. Asia Pacific Data Center Backup Power Generator Market Analysis, Insights and Forecast, 2019-2031
- 13.1. Market Analysis, Insights and Forecast - By Country/Sub-region
- 13.1.1 China
- 13.1.2 Japan
- 13.1.3 India
- 13.1.4 South Korea
- 13.1.5 Southeast Asia
- 13.1.6 Australia
- 13.1.7 Indonesia
- 13.1.8 Phillipes
- 13.1.9 Singapore
- 13.1.10 Thailandc
- 13.1.11 Rest of Asia Pacific
- 14. South America Data Center Backup Power Generator Market Analysis, Insights and Forecast, 2019-2031
- 14.1. Market Analysis, Insights and Forecast - By Country/Sub-region
- 14.1.1 Brazil
- 14.1.2 Argentina
- 14.1.3 Peru
- 14.1.4 Chile
- 14.1.5 Colombia
- 14.1.6 Ecuador
- 14.1.7 Venezuela
- 14.1.8 Rest of South America
- 15. North America Data Center Backup Power Generator Market Analysis, Insights and Forecast, 2019-2031
- 15.1. Market Analysis, Insights and Forecast - By Country/Sub-region
- 15.1.1 United States
- 15.1.2 Canada
- 15.1.3 Mexico
- 16. MEA Data Center Backup Power Generator Market Analysis, Insights and Forecast, 2019-2031
- 16.1. Market Analysis, Insights and Forecast - By Country/Sub-region
- 16.1.1 United Arab Emirates
- 16.1.2 Saudi Arabia
- 16.1.3 South Africa
- 16.1.4 Rest of Middle East and Africa
- 17. Competitive Analysis
- 17.1. Global Market Share Analysis 2024
- 17.2. Company Profiles
- 17.2.1 Kohler Co
- 17.2.1.1. Overview
- 17.2.1.2. Products
- 17.2.1.3. SWOT Analysis
- 17.2.1.4. Recent Developments
- 17.2.1.5. Financials (Based on Availability)
- 17.2.2 Atlas Copco AB
- 17.2.2.1. Overview
- 17.2.2.2. Products
- 17.2.2.3. SWOT Analysis
- 17.2.2.4. Recent Developments
- 17.2.2.5. Financials (Based on Availability)
- 17.2.3 Generac Power Systems Inc (Generac Holdings Inc )
- 17.2.3.1. Overview
- 17.2.3.2. Products
- 17.2.3.3. SWOT Analysis
- 17.2.3.4. Recent Developments
- 17.2.3.5. Financials (Based on Availability)
- 17.2.4 HITEC Power Protection BV (Air Water Inc )
- 17.2.4.1. Overview
- 17.2.4.2. Products
- 17.2.4.3. SWOT Analysis
- 17.2.4.4. Recent Developments
- 17.2.4.5. Financials (Based on Availability)
- 17.2.5 Rolls-Royce Holdings PLC
- 17.2.5.1. Overview
- 17.2.5.2. Products
- 17.2.5.3. SWOT Analysis
- 17.2.5.4. Recent Developments
- 17.2.5.5. Financials (Based on Availability)
- 17.2.6 Caterpillar Inc
- 17.2.6.1. Overview
- 17.2.6.2. Products
- 17.2.6.3. SWOT Analysis
- 17.2.6.4. Recent Developments
- 17.2.6.5. Financials (Based on Availability)
- 17.2.7 Mitsubishi Heavy Industries Group (MHI)
- 17.2.7.1. Overview
- 17.2.7.2. Products
- 17.2.7.3. SWOT Analysis
- 17.2.7.4. Recent Developments
- 17.2.7.5. Financials (Based on Availability)
- 17.2.8 Cummins Inc
- 17.2.8.1. Overview
- 17.2.8.2. Products
- 17.2.8.3. SWOT Analysis
- 17.2.8.4. Recent Developments
- 17.2.8.5. Financials (Based on Availability)
- 17.2.9 Himoinsa SL
- 17.2.9.1. Overview
- 17.2.9.2. Products
- 17.2.9.3. SWOT Analysis
- 17.2.9.4. Recent Developments
- 17.2.9.5. Financials (Based on Availability)
- 17.2.10 Aksa Power Generatio
- 17.2.10.1. Overview
- 17.2.10.2. Products
- 17.2.10.3. SWOT Analysis
- 17.2.10.4. Recent Developments
- 17.2.10.5. Financials (Based on Availability)
- 17.2.1 Kohler Co
List of Figures
- Figure 1: Global Data Center Backup Power Generator Market Revenue Breakdown (Million, %) by Region 2024 & 2032
- Figure 2: Global Data Center Backup Power Generator Market Volume Breakdown (K Unit, %) by Region 2024 & 2032
- Figure 3: North America Data Center Backup Power Generator Market Revenue (Million), by Country 2024 & 2032
- Figure 4: North America Data Center Backup Power Generator Market Volume (K Unit), by Country 2024 & 2032
- Figure 5: North America Data Center Backup Power Generator Market Revenue Share (%), by Country 2024 & 2032
- Figure 6: North America Data Center Backup Power Generator Market Volume Share (%), by Country 2024 & 2032
- Figure 7: Europe Data Center Backup Power Generator Market Revenue (Million), by Country 2024 & 2032
- Figure 8: Europe Data Center Backup Power Generator Market Volume (K Unit), by Country 2024 & 2032
- Figure 9: Europe Data Center Backup Power Generator Market Revenue Share (%), by Country 2024 & 2032
- Figure 10: Europe Data Center Backup Power Generator Market Volume Share (%), by Country 2024 & 2032
- Figure 11: Asia Pacific Data Center Backup Power Generator Market Revenue (Million), by Country 2024 & 2032
- Figure 12: Asia Pacific Data Center Backup Power Generator Market Volume (K Unit), by Country 2024 & 2032
- Figure 13: Asia Pacific Data Center Backup Power Generator Market Revenue Share (%), by Country 2024 & 2032
- Figure 14: Asia Pacific Data Center Backup Power Generator Market Volume Share (%), by Country 2024 & 2032
- Figure 15: South America Data Center Backup Power Generator Market Revenue (Million), by Country 2024 & 2032
- Figure 16: South America Data Center Backup Power Generator Market Volume (K Unit), by Country 2024 & 2032
- Figure 17: South America Data Center Backup Power Generator Market Revenue Share (%), by Country 2024 & 2032
- Figure 18: South America Data Center Backup Power Generator Market Volume Share (%), by Country 2024 & 2032
- Figure 19: North America Data Center Backup Power Generator Market Revenue (Million), by Country 2024 & 2032
- Figure 20: North America Data Center Backup Power Generator Market Volume (K Unit), by Country 2024 & 2032
- Figure 21: North America Data Center Backup Power Generator Market Revenue Share (%), by Country 2024 & 2032
- Figure 22: North America Data Center Backup Power Generator Market Volume Share (%), by Country 2024 & 2032
- Figure 23: MEA Data Center Backup Power Generator Market Revenue (Million), by Country 2024 & 2032
- Figure 24: MEA Data Center Backup Power Generator Market Volume (K Unit), by Country 2024 & 2032
- Figure 25: MEA Data Center Backup Power Generator Market Revenue Share (%), by Country 2024 & 2032
- Figure 26: MEA Data Center Backup Power Generator Market Volume Share (%), by Country 2024 & 2032
- Figure 27: North America Data Center Backup Power Generator Market Revenue (Million), by Product Type 2024 & 2032
- Figure 28: North America Data Center Backup Power Generator Market Volume (K Unit), by Product Type 2024 & 2032
- Figure 29: North America Data Center Backup Power Generator Market Revenue Share (%), by Product Type 2024 & 2032
- Figure 30: North America Data Center Backup Power Generator Market Volume Share (%), by Product Type 2024 & 2032
- Figure 31: North America Data Center Backup Power Generator Market Revenue (Million), by Capacity 2024 & 2032
- Figure 32: North America Data Center Backup Power Generator Market Volume (K Unit), by Capacity 2024 & 2032
- Figure 33: North America Data Center Backup Power Generator Market Revenue Share (%), by Capacity 2024 & 2032
- Figure 34: North America Data Center Backup Power Generator Market Volume Share (%), by Capacity 2024 & 2032
- Figure 35: North America Data Center Backup Power Generator Market Revenue (Million), by Tier 2024 & 2032
- Figure 36: North America Data Center Backup Power Generator Market Volume (K Unit), by Tier 2024 & 2032
- Figure 37: North America Data Center Backup Power Generator Market Revenue Share (%), by Tier 2024 & 2032
- Figure 38: North America Data Center Backup Power Generator Market Volume Share (%), by Tier 2024 & 2032
- Figure 39: North America Data Center Backup Power Generator Market Revenue (Million), by Country 2024 & 2032
- Figure 40: North America Data Center Backup Power Generator Market Volume (K Unit), by Country 2024 & 2032
- Figure 41: North America Data Center Backup Power Generator Market Revenue Share (%), by Country 2024 & 2032
- Figure 42: North America Data Center Backup Power Generator Market Volume Share (%), by Country 2024 & 2032
- Figure 43: Europe Data Center Backup Power Generator Market Revenue (Million), by Product Type 2024 & 2032
- Figure 44: Europe Data Center Backup Power Generator Market Volume (K Unit), by Product Type 2024 & 2032
- Figure 45: Europe Data Center Backup Power Generator Market Revenue Share (%), by Product Type 2024 & 2032
- Figure 46: Europe Data Center Backup Power Generator Market Volume Share (%), by Product Type 2024 & 2032
- Figure 47: Europe Data Center Backup Power Generator Market Revenue (Million), by Capacity 2024 & 2032
- Figure 48: Europe Data Center Backup Power Generator Market Volume (K Unit), by Capacity 2024 & 2032
- Figure 49: Europe Data Center Backup Power Generator Market Revenue Share (%), by Capacity 2024 & 2032
- Figure 50: Europe Data Center Backup Power Generator Market Volume Share (%), by Capacity 2024 & 2032
- Figure 51: Europe Data Center Backup Power Generator Market Revenue (Million), by Tier 2024 & 2032
- Figure 52: Europe Data Center Backup Power Generator Market Volume (K Unit), by Tier 2024 & 2032
- Figure 53: Europe Data Center Backup Power Generator Market Revenue Share (%), by Tier 2024 & 2032
- Figure 54: Europe Data Center Backup Power Generator Market Volume Share (%), by Tier 2024 & 2032
- Figure 55: Europe Data Center Backup Power Generator Market Revenue (Million), by Country 2024 & 2032
- Figure 56: Europe Data Center Backup Power Generator Market Volume (K Unit), by Country 2024 & 2032
- Figure 57: Europe Data Center Backup Power Generator Market Revenue Share (%), by Country 2024 & 2032
- Figure 58: Europe Data Center Backup Power Generator Market Volume Share (%), by Country 2024 & 2032
- Figure 59: Asia Pacific Data Center Backup Power Generator Market Revenue (Million), by Product Type 2024 & 2032
- Figure 60: Asia Pacific Data Center Backup Power Generator Market Volume (K Unit), by Product Type 2024 & 2032
- Figure 61: Asia Pacific Data Center Backup Power Generator Market Revenue Share (%), by Product Type 2024 & 2032
- Figure 62: Asia Pacific Data Center Backup Power Generator Market Volume Share (%), by Product Type 2024 & 2032
- Figure 63: Asia Pacific Data Center Backup Power Generator Market Revenue (Million), by Capacity 2024 & 2032
- Figure 64: Asia Pacific Data Center Backup Power Generator Market Volume (K Unit), by Capacity 2024 & 2032
- Figure 65: Asia Pacific Data Center Backup Power Generator Market Revenue Share (%), by Capacity 2024 & 2032
- Figure 66: Asia Pacific Data Center Backup Power Generator Market Volume Share (%), by Capacity 2024 & 2032
- Figure 67: Asia Pacific Data Center Backup Power Generator Market Revenue (Million), by Tier 2024 & 2032
- Figure 68: Asia Pacific Data Center Backup Power Generator Market Volume (K Unit), by Tier 2024 & 2032
- Figure 69: Asia Pacific Data Center Backup Power Generator Market Revenue Share (%), by Tier 2024 & 2032
- Figure 70: Asia Pacific Data Center Backup Power Generator Market Volume Share (%), by Tier 2024 & 2032
- Figure 71: Asia Pacific Data Center Backup Power Generator Market Revenue (Million), by Country 2024 & 2032
- Figure 72: Asia Pacific Data Center Backup Power Generator Market Volume (K Unit), by Country 2024 & 2032
- Figure 73: Asia Pacific Data Center Backup Power Generator Market Revenue Share (%), by Country 2024 & 2032
- Figure 74: Asia Pacific Data Center Backup Power Generator Market Volume Share (%), by Country 2024 & 2032
- Figure 75: Latin America Data Center Backup Power Generator Market Revenue (Million), by Product Type 2024 & 2032
- Figure 76: Latin America Data Center Backup Power Generator Market Volume (K Unit), by Product Type 2024 & 2032
- Figure 77: Latin America Data Center Backup Power Generator Market Revenue Share (%), by Product Type 2024 & 2032
- Figure 78: Latin America Data Center Backup Power Generator Market Volume Share (%), by Product Type 2024 & 2032
- Figure 79: Latin America Data Center Backup Power Generator Market Revenue (Million), by Capacity 2024 & 2032
- Figure 80: Latin America Data Center Backup Power Generator Market Volume (K Unit), by Capacity 2024 & 2032
- Figure 81: Latin America Data Center Backup Power Generator Market Revenue Share (%), by Capacity 2024 & 2032
- Figure 82: Latin America Data Center Backup Power Generator Market Volume Share (%), by Capacity 2024 & 2032
- Figure 83: Latin America Data Center Backup Power Generator Market Revenue (Million), by Tier 2024 & 2032
- Figure 84: Latin America Data Center Backup Power Generator Market Volume (K Unit), by Tier 2024 & 2032
- Figure 85: Latin America Data Center Backup Power Generator Market Revenue Share (%), by Tier 2024 & 2032
- Figure 86: Latin America Data Center Backup Power Generator Market Volume Share (%), by Tier 2024 & 2032
- Figure 87: Latin America Data Center Backup Power Generator Market Revenue (Million), by Country 2024 & 2032
- Figure 88: Latin America Data Center Backup Power Generator Market Volume (K Unit), by Country 2024 & 2032
- Figure 89: Latin America Data Center Backup Power Generator Market Revenue Share (%), by Country 2024 & 2032
- Figure 90: Latin America Data Center Backup Power Generator Market Volume Share (%), by Country 2024 & 2032
- Figure 91: Middle East and Africa Data Center Backup Power Generator Market Revenue (Million), by Product Type 2024 & 2032
- Figure 92: Middle East and Africa Data Center Backup Power Generator Market Volume (K Unit), by Product Type 2024 & 2032
- Figure 93: Middle East and Africa Data Center Backup Power Generator Market Revenue Share (%), by Product Type 2024 & 2032
- Figure 94: Middle East and Africa Data Center Backup Power Generator Market Volume Share (%), by Product Type 2024 & 2032
- Figure 95: Middle East and Africa Data Center Backup Power Generator Market Revenue (Million), by Capacity 2024 & 2032
- Figure 96: Middle East and Africa Data Center Backup Power Generator Market Volume (K Unit), by Capacity 2024 & 2032
- Figure 97: Middle East and Africa Data Center Backup Power Generator Market Revenue Share (%), by Capacity 2024 & 2032
- Figure 98: Middle East and Africa Data Center Backup Power Generator Market Volume Share (%), by Capacity 2024 & 2032
- Figure 99: Middle East and Africa Data Center Backup Power Generator Market Revenue (Million), by Tier 2024 & 2032
- Figure 100: Middle East and Africa Data Center Backup Power Generator Market Volume (K Unit), by Tier 2024 & 2032
- Figure 101: Middle East and Africa Data Center Backup Power Generator Market Revenue Share (%), by Tier 2024 & 2032
- Figure 102: Middle East and Africa Data Center Backup Power Generator Market Volume Share (%), by Tier 2024 & 2032
- Figure 103: Middle East and Africa Data Center Backup Power Generator Market Revenue (Million), by Country 2024 & 2032
- Figure 104: Middle East and Africa Data Center Backup Power Generator Market Volume (K Unit), by Country 2024 & 2032
- Figure 105: Middle East and Africa Data Center Backup Power Generator Market Revenue Share (%), by Country 2024 & 2032
- Figure 106: Middle East and Africa Data Center Backup Power Generator Market Volume Share (%), by Country 2024 & 2032
List of Tables
- Table 1: Global Data Center Backup Power Generator Market Revenue Million Forecast, by Region 2019 & 2032
- Table 2: Global Data Center Backup Power Generator Market Volume K Unit Forecast, by Region 2019 & 2032
- Table 3: Global Data Center Backup Power Generator Market Revenue Million Forecast, by Product Type 2019 & 2032
- Table 4: Global Data Center Backup Power Generator Market Volume K Unit Forecast, by Product Type 2019 & 2032
- Table 5: Global Data Center Backup Power Generator Market Revenue Million Forecast, by Capacity 2019 & 2032
- Table 6: Global Data Center Backup Power Generator Market Volume K Unit Forecast, by Capacity 2019 & 2032
- Table 7: Global Data Center Backup Power Generator Market Revenue Million Forecast, by Tier 2019 & 2032
- Table 8: Global Data Center Backup Power Generator Market Volume K Unit Forecast, by Tier 2019 & 2032
- Table 9: Global Data Center Backup Power Generator Market Revenue Million Forecast, by Region 2019 & 2032
- Table 10: Global Data Center Backup Power Generator Market Volume K Unit Forecast, by Region 2019 & 2032
- Table 11: Global Data Center Backup Power Generator Market Revenue Million Forecast, by Country 2019 & 2032
- Table 12: Global Data Center Backup Power Generator Market Volume K Unit Forecast, by Country 2019 & 2032
- Table 13: United States Data Center Backup Power Generator Market Revenue (Million) Forecast, by Application 2019 & 2032
- Table 14: United States Data Center Backup Power Generator Market Volume (K Unit) Forecast, by Application 2019 & 2032
- Table 15: Canada Data Center Backup Power Generator Market Revenue (Million) Forecast, by Application 2019 & 2032
- Table 16: Canada Data Center Backup Power Generator Market Volume (K Unit) Forecast, by Application 2019 & 2032
- Table 17: Mexico Data Center Backup Power Generator Market Revenue (Million) Forecast, by Application 2019 & 2032
- Table 18: Mexico Data Center Backup Power Generator Market Volume (K Unit) Forecast, by Application 2019 & 2032
- Table 19: Global Data Center Backup Power Generator Market Revenue Million Forecast, by Country 2019 & 2032
- Table 20: Global Data Center Backup Power Generator Market Volume K Unit Forecast, by Country 2019 & 2032
- Table 21: Germany Data Center Backup Power Generator Market Revenue (Million) Forecast, by Application 2019 & 2032
- Table 22: Germany Data Center Backup Power Generator Market Volume (K Unit) Forecast, by Application 2019 & 2032
- Table 23: United Kingdom Data Center Backup Power Generator Market Revenue (Million) Forecast, by Application 2019 & 2032
- Table 24: United Kingdom Data Center Backup Power Generator Market Volume (K Unit) Forecast, by Application 2019 & 2032
- Table 25: France Data Center Backup Power Generator Market Revenue (Million) Forecast, by Application 2019 & 2032
- Table 26: France Data Center Backup Power Generator Market Volume (K Unit) Forecast, by Application 2019 & 2032
- Table 27: Spain Data Center Backup Power Generator Market Revenue (Million) Forecast, by Application 2019 & 2032
- Table 28: Spain Data Center Backup Power Generator Market Volume (K Unit) Forecast, by Application 2019 & 2032
- Table 29: Italy Data Center Backup Power Generator Market Revenue (Million) Forecast, by Application 2019 & 2032
- Table 30: Italy Data Center Backup Power Generator Market Volume (K Unit) Forecast, by Application 2019 & 2032
- Table 31: Spain Data Center Backup Power Generator Market Revenue (Million) Forecast, by Application 2019 & 2032
- Table 32: Spain Data Center Backup Power Generator Market Volume (K Unit) Forecast, by Application 2019 & 2032
- Table 33: Belgium Data Center Backup Power Generator Market Revenue (Million) Forecast, by Application 2019 & 2032
- Table 34: Belgium Data Center Backup Power Generator Market Volume (K Unit) Forecast, by Application 2019 & 2032
- Table 35: Netherland Data Center Backup Power Generator Market Revenue (Million) Forecast, by Application 2019 & 2032
- Table 36: Netherland Data Center Backup Power Generator Market Volume (K Unit) Forecast, by Application 2019 & 2032
- Table 37: Nordics Data Center Backup Power Generator Market Revenue (Million) Forecast, by Application 2019 & 2032
- Table 38: Nordics Data Center Backup Power Generator Market Volume (K Unit) Forecast, by Application 2019 & 2032
- Table 39: Rest of Europe Data Center Backup Power Generator Market Revenue (Million) Forecast, by Application 2019 & 2032
- Table 40: Rest of Europe Data Center Backup Power Generator Market Volume (K Unit) Forecast, by Application 2019 & 2032
- Table 41: Global Data Center Backup Power Generator Market Revenue Million Forecast, by Country 2019 & 2032
- Table 42: Global Data Center Backup Power Generator Market Volume K Unit Forecast, by Country 2019 & 2032
- Table 43: China Data Center Backup Power Generator Market Revenue (Million) Forecast, by Application 2019 & 2032
- Table 44: China Data Center Backup Power Generator Market Volume (K Unit) Forecast, by Application 2019 & 2032
- Table 45: Japan Data Center Backup Power Generator Market Revenue (Million) Forecast, by Application 2019 & 2032
- Table 46: Japan Data Center Backup Power Generator Market Volume (K Unit) Forecast, by Application 2019 & 2032
- Table 47: India Data Center Backup Power Generator Market Revenue (Million) Forecast, by Application 2019 & 2032
- Table 48: India Data Center Backup Power Generator Market Volume (K Unit) Forecast, by Application 2019 & 2032
- Table 49: South Korea Data Center Backup Power Generator Market Revenue (Million) Forecast, by Application 2019 & 2032
- Table 50: South Korea Data Center Backup Power Generator Market Volume (K Unit) Forecast, by Application 2019 & 2032
- Table 51: Southeast Asia Data Center Backup Power Generator Market Revenue (Million) Forecast, by Application 2019 & 2032
- Table 52: Southeast Asia Data Center Backup Power Generator Market Volume (K Unit) Forecast, by Application 2019 & 2032
- Table 53: Australia Data Center Backup Power Generator Market Revenue (Million) Forecast, by Application 2019 & 2032
- Table 54: Australia Data Center Backup Power Generator Market Volume (K Unit) Forecast, by Application 2019 & 2032
- Table 55: Indonesia Data Center Backup Power Generator Market Revenue (Million) Forecast, by Application 2019 & 2032
- Table 56: Indonesia Data Center Backup Power Generator Market Volume (K Unit) Forecast, by Application 2019 & 2032
- Table 57: Phillipes Data Center Backup Power Generator Market Revenue (Million) Forecast, by Application 2019 & 2032
- Table 58: Phillipes Data Center Backup Power Generator Market Volume (K Unit) Forecast, by Application 2019 & 2032
- Table 59: Singapore Data Center Backup Power Generator Market Revenue (Million) Forecast, by Application 2019 & 2032
- Table 60: Singapore Data Center Backup Power Generator Market Volume (K Unit) Forecast, by Application 2019 & 2032
- Table 61: Thailandc Data Center Backup Power Generator Market Revenue (Million) Forecast, by Application 2019 & 2032
- Table 62: Thailandc Data Center Backup Power Generator Market Volume (K Unit) Forecast, by Application 2019 & 2032
- Table 63: Rest of Asia Pacific Data Center Backup Power Generator Market Revenue (Million) Forecast, by Application 2019 & 2032
- Table 64: Rest of Asia Pacific Data Center Backup Power Generator Market Volume (K Unit) Forecast, by Application 2019 & 2032
- Table 65: Global Data Center Backup Power Generator Market Revenue Million Forecast, by Country 2019 & 2032
- Table 66: Global Data Center Backup Power Generator Market Volume K Unit Forecast, by Country 2019 & 2032
- Table 67: Brazil Data Center Backup Power Generator Market Revenue (Million) Forecast, by Application 2019 & 2032
- Table 68: Brazil Data Center Backup Power Generator Market Volume (K Unit) Forecast, by Application 2019 & 2032
- Table 69: Argentina Data Center Backup Power Generator Market Revenue (Million) Forecast, by Application 2019 & 2032
- Table 70: Argentina Data Center Backup Power Generator Market Volume (K Unit) Forecast, by Application 2019 & 2032
- Table 71: Peru Data Center Backup Power Generator Market Revenue (Million) Forecast, by Application 2019 & 2032
- Table 72: Peru Data Center Backup Power Generator Market Volume (K Unit) Forecast, by Application 2019 & 2032
- Table 73: Chile Data Center Backup Power Generator Market Revenue (Million) Forecast, by Application 2019 & 2032
- Table 74: Chile Data Center Backup Power Generator Market Volume (K Unit) Forecast, by Application 2019 & 2032
- Table 75: Colombia Data Center Backup Power Generator Market Revenue (Million) Forecast, by Application 2019 & 2032
- Table 76: Colombia Data Center Backup Power Generator Market Volume (K Unit) Forecast, by Application 2019 & 2032
- Table 77: Ecuador Data Center Backup Power Generator Market Revenue (Million) Forecast, by Application 2019 & 2032
- Table 78: Ecuador Data Center Backup Power Generator Market Volume (K Unit) Forecast, by Application 2019 & 2032
- Table 79: Venezuela Data Center Backup Power Generator Market Revenue (Million) Forecast, by Application 2019 & 2032
- Table 80: Venezuela Data Center Backup Power Generator Market Volume (K Unit) Forecast, by Application 2019 & 2032
- Table 81: Rest of South America Data Center Backup Power Generator Market Revenue (Million) Forecast, by Application 2019 & 2032
- Table 82: Rest of South America Data Center Backup Power Generator Market Volume (K Unit) Forecast, by Application 2019 & 2032
- Table 83: Global Data Center Backup Power Generator Market Revenue Million Forecast, by Country 2019 & 2032
- Table 84: Global Data Center Backup Power Generator Market Volume K Unit Forecast, by Country 2019 & 2032
- Table 85: United States Data Center Backup Power Generator Market Revenue (Million) Forecast, by Application 2019 & 2032
- Table 86: United States Data Center Backup Power Generator Market Volume (K Unit) Forecast, by Application 2019 & 2032
- Table 87: Canada Data Center Backup Power Generator Market Revenue (Million) Forecast, by Application 2019 & 2032
- Table 88: Canada Data Center Backup Power Generator Market Volume (K Unit) Forecast, by Application 2019 & 2032
- Table 89: Mexico Data Center Backup Power Generator Market Revenue (Million) Forecast, by Application 2019 & 2032
- Table 90: Mexico Data Center Backup Power Generator Market Volume (K Unit) Forecast, by Application 2019 & 2032
- Table 91: Global Data Center Backup Power Generator Market Revenue Million Forecast, by Country 2019 & 2032
- Table 92: Global Data Center Backup Power Generator Market Volume K Unit Forecast, by Country 2019 & 2032
- Table 93: United Arab Emirates Data Center Backup Power Generator Market Revenue (Million) Forecast, by Application 2019 & 2032
- Table 94: United Arab Emirates Data Center Backup Power Generator Market Volume (K Unit) Forecast, by Application 2019 & 2032
- Table 95: Saudi Arabia Data Center Backup Power Generator Market Revenue (Million) Forecast, by Application 2019 & 2032
- Table 96: Saudi Arabia Data Center Backup Power Generator Market Volume (K Unit) Forecast, by Application 2019 & 2032
- Table 97: South Africa Data Center Backup Power Generator Market Revenue (Million) Forecast, by Application 2019 & 2032
- Table 98: South Africa Data Center Backup Power Generator Market Volume (K Unit) Forecast, by Application 2019 & 2032
- Table 99: Rest of Middle East and Africa Data Center Backup Power Generator Market Revenue (Million) Forecast, by Application 2019 & 2032
- Table 100: Rest of Middle East and Africa Data Center Backup Power Generator Market Volume (K Unit) Forecast, by Application 2019 & 2032
- Table 101: Global Data Center Backup Power Generator Market Revenue Million Forecast, by Product Type 2019 & 2032
- Table 102: Global Data Center Backup Power Generator Market Volume K Unit Forecast, by Product Type 2019 & 2032
- Table 103: Global Data Center Backup Power Generator Market Revenue Million Forecast, by Capacity 2019 & 2032
- Table 104: Global Data Center Backup Power Generator Market Volume K Unit Forecast, by Capacity 2019 & 2032
- Table 105: Global Data Center Backup Power Generator Market Revenue Million Forecast, by Tier 2019 & 2032
- Table 106: Global Data Center Backup Power Generator Market Volume K Unit Forecast, by Tier 2019 & 2032
- Table 107: Global Data Center Backup Power Generator Market Revenue Million Forecast, by Country 2019 & 2032
- Table 108: Global Data Center Backup Power Generator Market Volume K Unit Forecast, by Country 2019 & 2032
- Table 109: Global Data Center Backup Power Generator Market Revenue Million Forecast, by Product Type 2019 & 2032
- Table 110: Global Data Center Backup Power Generator Market Volume K Unit Forecast, by Product Type 2019 & 2032
- Table 111: Global Data Center Backup Power Generator Market Revenue Million Forecast, by Capacity 2019 & 2032
- Table 112: Global Data Center Backup Power Generator Market Volume K Unit Forecast, by Capacity 2019 & 2032
- Table 113: Global Data Center Backup Power Generator Market Revenue Million Forecast, by Tier 2019 & 2032
- Table 114: Global Data Center Backup Power Generator Market Volume K Unit Forecast, by Tier 2019 & 2032
- Table 115: Global Data Center Backup Power Generator Market Revenue Million Forecast, by Country 2019 & 2032
- Table 116: Global Data Center Backup Power Generator Market Volume K Unit Forecast, by Country 2019 & 2032
- Table 117: Global Data Center Backup Power Generator Market Revenue Million Forecast, by Product Type 2019 & 2032
- Table 118: Global Data Center Backup Power Generator Market Volume K Unit Forecast, by Product Type 2019 & 2032
- Table 119: Global Data Center Backup Power Generator Market Revenue Million Forecast, by Capacity 2019 & 2032
- Table 120: Global Data Center Backup Power Generator Market Volume K Unit Forecast, by Capacity 2019 & 2032
- Table 121: Global Data Center Backup Power Generator Market Revenue Million Forecast, by Tier 2019 & 2032
- Table 122: Global Data Center Backup Power Generator Market Volume K Unit Forecast, by Tier 2019 & 2032
- Table 123: Global Data Center Backup Power Generator Market Revenue Million Forecast, by Country 2019 & 2032
- Table 124: Global Data Center Backup Power Generator Market Volume K Unit Forecast, by Country 2019 & 2032
- Table 125: Global Data Center Backup Power Generator Market Revenue Million Forecast, by Product Type 2019 & 2032
- Table 126: Global Data Center Backup Power Generator Market Volume K Unit Forecast, by Product Type 2019 & 2032
- Table 127: Global Data Center Backup Power Generator Market Revenue Million Forecast, by Capacity 2019 & 2032
- Table 128: Global Data Center Backup Power Generator Market Volume K Unit Forecast, by Capacity 2019 & 2032
- Table 129: Global Data Center Backup Power Generator Market Revenue Million Forecast, by Tier 2019 & 2032
- Table 130: Global Data Center Backup Power Generator Market Volume K Unit Forecast, by Tier 2019 & 2032
- Table 131: Global Data Center Backup Power Generator Market Revenue Million Forecast, by Country 2019 & 2032
- Table 132: Global Data Center Backup Power Generator Market Volume K Unit Forecast, by Country 2019 & 2032
- Table 133: Global Data Center Backup Power Generator Market Revenue Million Forecast, by Product Type 2019 & 2032
- Table 134: Global Data Center Backup Power Generator Market Volume K Unit Forecast, by Product Type 2019 & 2032
- Table 135: Global Data Center Backup Power Generator Market Revenue Million Forecast, by Capacity 2019 & 2032
- Table 136: Global Data Center Backup Power Generator Market Volume K Unit Forecast, by Capacity 2019 & 2032
- Table 137: Global Data Center Backup Power Generator Market Revenue Million Forecast, by Tier 2019 & 2032
- Table 138: Global Data Center Backup Power Generator Market Volume K Unit Forecast, by Tier 2019 & 2032
- Table 139: Global Data Center Backup Power Generator Market Revenue Million Forecast, by Country 2019 & 2032
- Table 140: Global Data Center Backup Power Generator Market Volume K Unit Forecast, by Country 2019 & 2032
Frequently Asked Questions
1. What is the projected Compound Annual Growth Rate (CAGR) of the Data Center Backup Power Generator Market?
The projected CAGR is approximately 4.85%.
2. Which companies are prominent players in the Data Center Backup Power Generator Market?
Key companies in the market include Kohler Co, Atlas Copco AB, Generac Power Systems Inc (Generac Holdings Inc ), HITEC Power Protection BV (Air Water Inc ), Rolls-Royce Holdings PLC, Caterpillar Inc, Mitsubishi Heavy Industries Group (MHI), Cummins Inc, Himoinsa SL, Aksa Power Generatio.
3. What are the main segments of the Data Center Backup Power Generator Market?
The market segments include Product Type, Capacity, Tier.
4. Can you provide details about the market size?
The market size is estimated to be USD 7.22 Million as of 2022.
5. What are some drivers contributing to market growth?
4.; Increasing Construction of Data Centers by Colocation Service Providers4.; Growing Construction of Hyperscale Data Centers.
6. What are the notable trends driving market growth?
Natural Gas Segment to Witness Major Growth.
7. Are there any restraints impacting market growth?
4.; Growing Carbon Emissions from Data Centers.
8. Can you provide examples of recent developments in the market?
October 2023 - Rolls-Royce announced the supply of 31 mtu emergency gensets and a complete mtu EnergetIQ control system for the latest data center of a global provider of hyperscale data center solutions. The hyperscale data center, located near Osaka, is one of the largest data centers in Japan, with a designed capacity of 45.9 MW. Rolls-Royce Solutions Japan has installed and commissioned eight of the 31 container gensets based on 20-cylinder mtu Series 4000 engines. The remaining emergency generators were expected to be added gradually as the data center’s capacity increased.
9. What pricing options are available for accessing the report?
Pricing options include single-user, multi-user, and enterprise licenses priced at USD 4750, USD 5250, and USD 8750 respectively.
10. Is the market size provided in terms of value or volume?
The market size is provided in terms of value, measured in Million and volume, measured in K Unit.
11. Are there any specific market keywords associated with the report?
Yes, the market keyword associated with the report is "Data Center Backup Power Generator Market," which aids in identifying and referencing the specific market segment covered.
12. How do I determine which pricing option suits my needs best?
The pricing options vary based on user requirements and access needs. Individual users may opt for single-user licenses, while businesses requiring broader access may choose multi-user or enterprise licenses for cost-effective access to the report.
13. Are there any additional resources or data provided in the Data Center Backup Power Generator Market report?
While the report offers comprehensive insights, it's advisable to review the specific contents or supplementary materials provided to ascertain if additional resources or data are available.
14. How can I stay updated on further developments or reports in the Data Center Backup Power Generator Market?
To stay informed about further developments, trends, and reports in the Data Center Backup Power Generator Market, consider subscribing to industry newsletters, following relevant companies and organizations, or regularly checking reputable industry news sources and publications.
Methodology
Step 1 - Identification of Relevant Samples Size from Population Database


Step 2 - Approaches for Defining Global Market Size (Value, Volume* & Price*)

Note*: In applicable scenarios
Step 3 - Data Sources
Primary Research
- Web Analytics
- Survey Reports
- Research Institute
- Latest Research Reports
- Opinion Leaders
Secondary Research
- Annual Reports
- White Paper
- Latest Press Release
- Industry Association
- Paid Database
- Investor Presentations

Step 4 - Data Triangulation
Involves using different sources of information in order to increase the validity of a study
These sources are likely to be stakeholders in a program - participants, other researchers, program staff, other community members, and so on.
Then we put all data in single framework & apply various statistical tools to find out the dynamic on the market.
During the analysis stage, feedback from the stakeholder groups would be compared to determine areas of agreement as well as areas of divergence


