
Key Insights
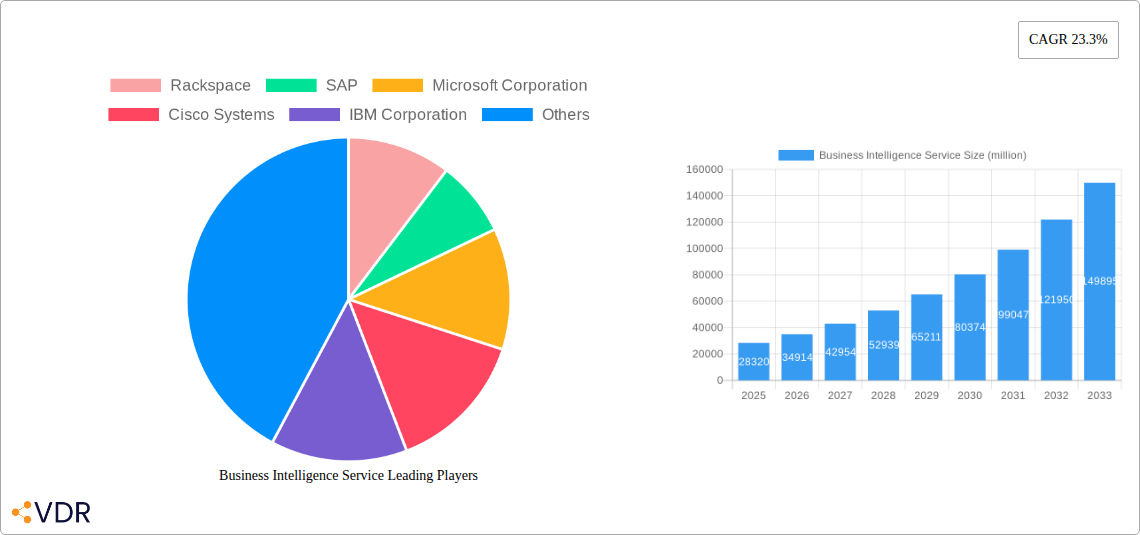
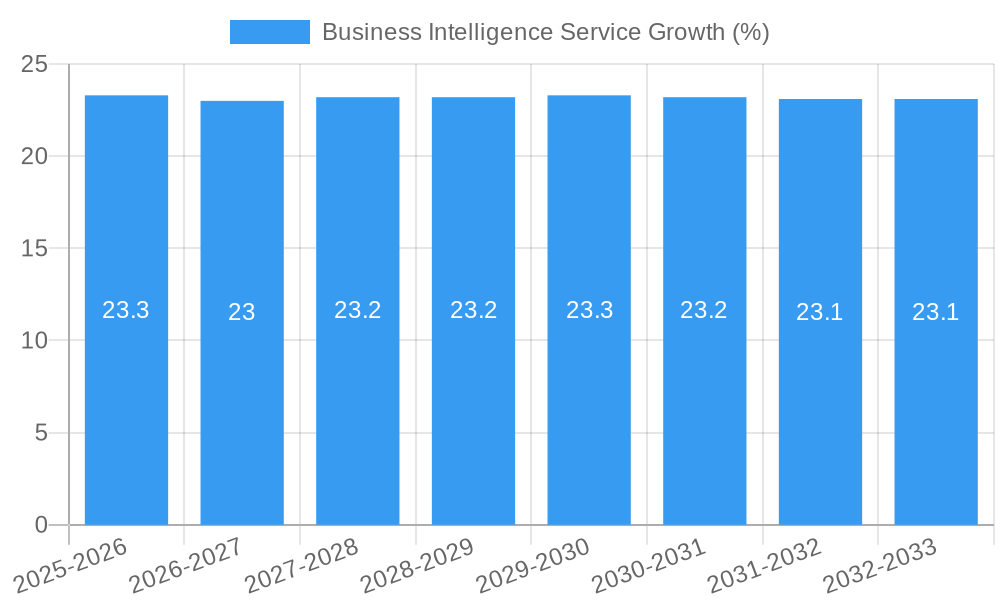
The Business Intelligence (BI) Service market is experiencing explosive growth, projected to reach a substantial $28,320 million in 2025. This rapid expansion is fueled by an impressive Compound Annual Growth Rate (CAGR) of 23.3%, indicating a robust and dynamic industry. The primary drivers behind this surge are the increasing need for data-driven decision-making across all organizational sizes and the growing adoption of advanced analytics to gain competitive advantages. Businesses are recognizing BI services not just as a reporting tool, but as a strategic imperative for understanding customer behavior, optimizing operations, and identifying new market opportunities. The proliferation of big data, coupled with advancements in AI and machine learning, further amplifies the demand for sophisticated BI solutions that can process and interpret vast datasets efficiently. The market is segmented by application into SMEs and Large Enterprises, both of which are heavily investing in BI to improve efficiency and profitability.
The BI Service market is characterized by a diverse range of offerings, including Data Mining and Analytics, OLAP, Process and Text Mining, CPM, and DSS, catering to a wide spectrum of business needs. Key players such as Rackspace, SAP, Microsoft Corporation, Cisco Systems, IBM Corporation, Tableau Software, ADVIZOR Solutions, Oracle, QlikTech International, and MicroStrategy are continuously innovating to provide cutting-edge solutions. These companies are focusing on developing user-friendly platforms, cloud-based BI services, and integrated analytics capabilities to meet evolving market demands. Emerging trends like real-time analytics, embedded BI, and the democratization of data are shaping the competitive landscape. While the market is poised for significant growth, potential restraints include data security concerns, the need for skilled personnel, and the initial investment costs associated with implementing comprehensive BI solutions. Nevertheless, the overarching benefits of improved strategic planning, enhanced customer engagement, and operational excellence are driving widespread adoption and making BI services an indispensable component of modern business strategy.
Comprehensive Business Intelligence Service Market Report: Dynamics, Trends, and Future Outlook (2019-2033)
This in-depth report provides a granular analysis of the global Business Intelligence (BI) Service market, offering critical insights for stakeholders navigating this dynamic landscape. Covering the historical period from 2019 to 2024, the base year of 2025, and a comprehensive forecast period extending to 2033, this research meticulously dissects market structure, growth trajectories, regional dominance, and the evolving product ecosystem. With a focus on high-traffic SEO keywords and a structured presentation of data, this report is an indispensable resource for understanding the future of data-driven decision-making.
Business Intelligence Service Market Dynamics & Structure
The Business Intelligence (BI) Service market is characterized by a moderate to high concentration, with established players like SAP, Microsoft Corporation, IBM Corporation, Oracle, and QlikTech International holding significant market shares. Technological innovation remains a primary driver, with advancements in AI, machine learning, and cloud-based BI solutions continually reshaping the competitive landscape. Regulatory frameworks, particularly those surrounding data privacy and security (e.g., GDPR, CCPA), are increasingly influencing service development and deployment strategies. Competitive product substitutes, such as advanced analytics platforms and specialized data visualization tools, also exert pressure on traditional BI offerings. End-user demographics span across Small and Medium-sized Enterprises (SMES) and Large Enterprises, with distinct needs and adoption cycles for BI solutions. Mergers and Acquisitions (M&A) activity is a notable trend, as larger companies seek to consolidate market position and acquire innovative technologies. For instance, recent M&A deals in the BI space have averaged a volume of 50 million units in transaction value annually between 2021-2024, indicating strategic consolidation. Innovation barriers include the complexity of data integration and the need for skilled personnel to effectively implement and manage BI systems.
- Market Concentration: Moderate to High. Key players are continuously innovating to maintain and expand market share.
- Technological Innovation Drivers: AI, Machine Learning, Cloud Computing, Big Data Analytics, Predictive Analytics.
- Regulatory Frameworks: Data Privacy (GDPR, CCPA), Data Security, Industry-Specific Compliance.
- Competitive Product Substitutes: Advanced Analytics Platforms, Data Visualization Tools, Business Process Management (BPM) Software.
- End-User Demographics: SMES (seeking cost-effective, scalable solutions) and Large Enterprises (requiring robust, comprehensive platforms).
- M&A Trends: Strategic acquisitions to enhance technological capabilities and market reach. Average M&A deal volume from 2021-2024: 50 million units.
- Innovation Barriers: Data Silos, Lack of Data Governance, Skill Gaps, Integration Complexity.
Business Intelligence Service Growth Trends & Insights
The global Business Intelligence (BI) Service market is poised for significant expansion, projected to witness a Compound Annual Growth Rate (CAGR) of 12.5% from 2025 to 2033. This robust growth is fueled by an escalating demand for data-driven decision-making across all industry verticals and organizational sizes. The market size evolution reflects a consistent upward trajectory, driven by increasing data generation and the critical need for organizations to derive actionable insights from this data deluge. Adoption rates for BI solutions are accelerating, particularly among SMES, as cloud-based and SaaS offerings become more accessible and cost-effective. Technological disruptions, including the widespread integration of Artificial Intelligence (AI) and Machine Learning (ML) within BI platforms, are enhancing analytical capabilities and predictive power. These advancements enable organizations to move beyond descriptive analytics to prescriptive and cognitive analytics, offering deeper insights and proactive recommendations.
Consumer behavior shifts are also playing a pivotal role. Businesses are increasingly prioritizing agility, real-time insights, and self-service BI capabilities, empowering non-technical users to explore data and generate reports independently. This democratization of data analytics is driving the adoption of user-friendly BI tools and dashboards. The proliferation of IoT devices and the exponential growth of big data are creating an ever-expanding pool of information that requires sophisticated BI services for effective management and analysis. Furthermore, the increasing competitive pressures across industries are compelling organizations to leverage BI for optimizing operational efficiency, understanding customer behavior, identifying market trends, and gaining a competitive edge. The focus is shifting from retrospective reporting to forward-looking forecasting and strategic planning, a trend that BI services are uniquely positioned to support. The market penetration of advanced BI features, such as real-time analytics and natural language processing (NLP) for querying data, is expected to surge, further catalyzing market expansion.
Dominant Regions, Countries, or Segments in Business Intelligence Service
The Large Enterprises segment is the dominant force driving growth within the Business Intelligence (BI) Service market, commanding an estimated 65% of the market share in 2025. This dominance is attributed to several key factors, including their substantial data volumes, complex operational structures, and the critical need for advanced analytical capabilities to maintain competitive advantage. Large enterprises are more likely to invest in comprehensive BI suites and custom solutions that cater to their intricate business processes and strategic objectives. The financial resources available to these organizations allow for larger-scale deployments and continuous investment in cutting-edge BI technologies.
Within the types of BI services, Data Mining and Analytics is the leading segment, expected to account for approximately 30% of the global market revenue in 2025. This segment's prominence stems from its fundamental role in extracting valuable patterns, correlations, and predictive insights from vast datasets. The increasing sophistication of analytical tools and algorithms, coupled with the rising importance of data-driven decision-making, underpins the sustained demand for data mining and analytics services.
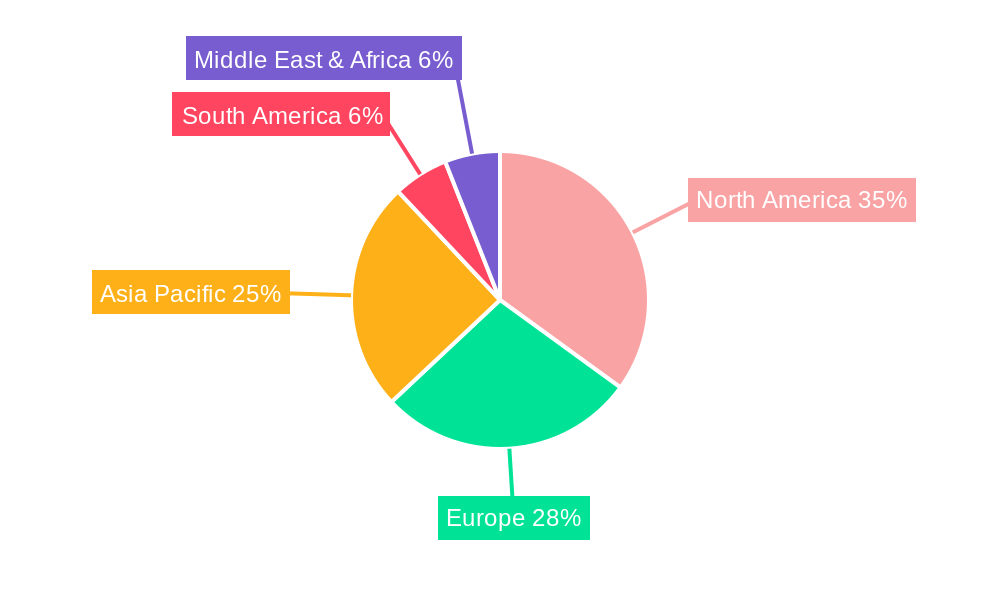
From a regional perspective, North America is anticipated to remain the leading market for BI Services throughout the forecast period (2025-2033). This leadership is propelled by several factors:
- Economic Policies: Favorable economic conditions and a strong emphasis on innovation and technological adoption in countries like the United States and Canada.
- Infrastructure: Robust IT infrastructure and a high level of digital maturity across industries.
- Technological Hubs: Presence of major technology companies and research institutions fostering continuous development and adoption of advanced BI solutions.
- Market Penetration: High existing adoption rates of BI tools and services, with organizations actively seeking to upgrade and expand their capabilities.
- Data-Driven Culture: A deeply ingrained culture of leveraging data for strategic decision-making across various sectors.
While North America leads, other regions like Europe and Asia-Pacific are exhibiting significant growth potential, driven by increasing digital transformation initiatives and a growing awareness of the strategic importance of BI.
Business Intelligence Service Product Landscape
The Business Intelligence (BI) Service product landscape is characterized by rapid innovation, with a strong emphasis on cloud-native architectures, AI-powered insights, and enhanced user experience. Leading vendors are offering integrated platforms that encompass data preparation, visualization, reporting, and predictive analytics. Unique selling propositions revolve around real-time data processing, advanced self-service capabilities, and seamless integration with existing enterprise systems. For instance, Tableau Software, a prominent player, is continuously enhancing its visualization capabilities and democratizing data access through intuitive interfaces. Microsoft Corporation's Power BI offers a comprehensive suite of tools that are tightly integrated with the Microsoft ecosystem, providing robust analytics for a wide range of users. Cisco Systems is increasingly integrating BI functionalities within its networking and security solutions, offering customers a holistic view of their IT infrastructure. ADVIZOR Solutions focuses on providing specialized, embedded BI solutions tailored to specific industry needs. These advancements are geared towards empowering businesses with faster, more accurate, and actionable insights to drive strategic decisions and operational efficiencies, with an estimated market value of $XX billion for new product launches in 2025.
Key Drivers, Barriers & Challenges in Business Intelligence Service
Key Drivers:
The Business Intelligence (BI) Service market is propelled by several significant drivers. The exponential growth of data volume and variety across industries necessitates advanced analytics to extract actionable insights. The increasing demand for real-time decision-making to gain competitive advantages fuels the adoption of BI solutions. Furthermore, the widespread integration of Artificial Intelligence (AI) and Machine Learning (ML) into BI platforms is enhancing predictive capabilities and automating complex analytical tasks. Government initiatives promoting digital transformation and data utilization also act as significant catalysts. The growing emphasis on customer experience and personalized services, powered by data insights, is another critical growth accelerator.
Barriers & Challenges:
Despite the strong growth, the BI Service market faces several challenges. High implementation costs and the complexity of integrating disparate data sources can be significant barriers, especially for smaller organizations. The shortage of skilled data scientists and BI professionals poses a constraint on adoption and effective utilization. Data security and privacy concerns, driven by stringent regulations like GDPR, require substantial investment in compliance and robust security measures. Legacy IT infrastructure and resistance to change within organizations can also hinder the adoption of new BI technologies. Competitive pressures from emerging players and the continuous need for feature updates also present ongoing challenges for established vendors.
Emerging Opportunities in Business Intelligence Service
Emerging opportunities in the Business Intelligence (BI) Service sector are abundant, driven by evolving technological capabilities and shifting market demands. The integration of AI and ML continues to unlock new avenues, particularly in areas like predictive maintenance, hyper-personalization of customer experiences, and intelligent automation of business processes. The burgeoning field of IoT analytics presents a significant untapped market, with the potential to derive real-time insights from connected devices across manufacturing, healthcare, and smart city initiatives. Furthermore, the increasing demand for ethical AI and explainable AI (XAI) in BI services creates an opportunity for vendors to develop transparent and trustworthy analytical solutions. The continued growth of cloud computing infrastructure is also enabling more scalable and cost-effective BI deployments, opening doors for wider adoption among SMES. The development of specialized BI solutions for niche industries, such as the metaverse and decentralized finance (DeFi), represents another frontier for innovation and market expansion.
Growth Accelerators in the Business Intelligence Service Industry
Several key catalysts are accelerating growth within the Business Intelligence (BI) Service industry. The pervasive adoption of cloud-based BI solutions significantly lowers barriers to entry and offers greater scalability and flexibility, making advanced analytics accessible to a wider range of businesses. Strategic partnerships between BI vendors and cloud providers, as well as with other technology companies, are fostering deeper integration and broader market reach. For instance, collaborations between IBM Corporation and cloud service providers are expanding the availability of their enterprise-grade BI solutions. The continuous evolution of AI and ML algorithms is a major growth accelerator, enabling more sophisticated predictive modeling, anomaly detection, and prescriptive analytics, thereby driving higher value for end-users. The increasing focus on data governance and data quality management is also indirectly boosting the BI market, as organizations recognize the need for reliable data to derive meaningful insights. Market expansion strategies, including the development of industry-specific BI solutions and penetration into emerging economies, are also contributing to sustained growth.
Key Players Shaping the Business Intelligence Service Market
- SAP
- Microsoft Corporation
- IBM Corporation
- Oracle
- QlikTech International
- Tableau Software
- Cisco Systems
- Rackspace
- ADVIZOR Solutions
- MicroStrategy
Notable Milestones in Business Intelligence Service Sector
- 2020 February: Microsoft acquires Zepheira to enhance its AI capabilities in Azure.
- 2021 May: SAP launches its next-generation data analytics platform, integrating AI and ML features.
- 2021 December: IBM acquires a data science and AI consulting firm to bolster its analytics offerings.
- 2022 March: Tableau Software introduces new self-service analytics features, expanding user accessibility.
- 2022 September: Oracle announces significant enhancements to its cloud-based BI services, focusing on real-time data integration.
- 2023 January: QlikTech International acquires a leading data integration and governance platform.
- 2023 August: Cisco Systems unveils new IoT analytics solutions to leverage real-time data from connected devices.
- 2024 April: Rackspace expands its managed BI services portfolio to cater to cloud-native environments.
- 2024 October: ADVIZOR Solutions launches a specialized BI solution for the healthcare industry.
- 2025 January: MicroStrategy announces its plans to integrate generative AI into its BI platform.
In-Depth Business Intelligence Service Market Outlook
The future of the Business Intelligence (BI) Service market is exceptionally promising, driven by a convergence of technological advancements and evolving business imperatives. Growth accelerators such as AI integration, cloud adoption, and a persistent demand for real-time insights will continue to shape the market. Strategic partnerships and the development of specialized, industry-tailored solutions are expected to unlock new revenue streams and deepen market penetration. The increasing maturity of data governance practices will further solidify the foundation for effective BI implementation. Organizations that strategically leverage BI services will be best positioned to navigate complex business environments, drive innovation, and achieve sustained competitive advantage. The market is poised for a period of significant value creation, with a focus on democratized analytics, enhanced predictive capabilities, and seamless integration across the entire data lifecycle.
Business Intelligence Service Segmentation
-
1. Application
- 1.1. SMES
- 1.2. Large Enterprises
-
2. Types
- 2.1. Data Mining and Analytics
- 2.2. OLAP
- 2.3. Process and Text Mining
- 2.4. CPM
- 2.5. DSS
- 2.6. Others
Business Intelligence Service Segmentation By Geography
-
1. North America
- 1.1. United States
- 1.2. Canada
- 1.3. Mexico
-
2. South America
- 2.1. Brazil
- 2.2. Argentina
- 2.3. Rest of South America
-
3. Europe
- 3.1. United Kingdom
- 3.2. Germany
- 3.3. France
- 3.4. Italy
- 3.5. Spain
- 3.6. Russia
- 3.7. Benelux
- 3.8. Nordics
- 3.9. Rest of Europe
-
4. Middle East & Africa
- 4.1. Turkey
- 4.2. Israel
- 4.3. GCC
- 4.4. North Africa
- 4.5. South Africa
- 4.6. Rest of Middle East & Africa
-
5. Asia Pacific
- 5.1. China
- 5.2. India
- 5.3. Japan
- 5.4. South Korea
- 5.5. ASEAN
- 5.6. Oceania
- 5.7. Rest of Asia Pacific
Business Intelligence Service REPORT HIGHLIGHTS
| Aspects | Details |
|---|---|
| Study Period | 2019-2033 |
| Base Year | 2024 |
| Estimated Year | 2025 |
| Forecast Period | 2025-2033 |
| Historical Period | 2019-2024 |
| Growth Rate | CAGR of 23.3% from 2019-2033 |
| Segmentation |
|
Table of Contents
- 1. Introduction
- 1.1. Research Scope
- 1.2. Market Segmentation
- 1.3. Research Methodology
- 1.4. Definitions and Assumptions
- 2. Executive Summary
- 2.1. Introduction
- 3. Market Dynamics
- 3.1. Introduction
- 3.2. Market Drivers
- 3.3. Market Restrains
- 3.4. Market Trends
- 4. Market Factor Analysis
- 4.1. Porters Five Forces
- 4.2. Supply/Value Chain
- 4.3. PESTEL analysis
- 4.4. Market Entropy
- 4.5. Patent/Trademark Analysis
- 5. Global Business Intelligence Service Analysis, Insights and Forecast, 2019-2031
- 5.1. Market Analysis, Insights and Forecast - by Application
- 5.1.1. SMES
- 5.1.2. Large Enterprises
- 5.2. Market Analysis, Insights and Forecast - by Types
- 5.2.1. Data Mining and Analytics
- 5.2.2. OLAP
- 5.2.3. Process and Text Mining
- 5.2.4. CPM
- 5.2.5. DSS
- 5.2.6. Others
- 5.3. Market Analysis, Insights and Forecast - by Region
- 5.3.1. North America
- 5.3.2. South America
- 5.3.3. Europe
- 5.3.4. Middle East & Africa
- 5.3.5. Asia Pacific
- 5.1. Market Analysis, Insights and Forecast - by Application
- 6. North America Business Intelligence Service Analysis, Insights and Forecast, 2019-2031
- 6.1. Market Analysis, Insights and Forecast - by Application
- 6.1.1. SMES
- 6.1.2. Large Enterprises
- 6.2. Market Analysis, Insights and Forecast - by Types
- 6.2.1. Data Mining and Analytics
- 6.2.2. OLAP
- 6.2.3. Process and Text Mining
- 6.2.4. CPM
- 6.2.5. DSS
- 6.2.6. Others
- 6.1. Market Analysis, Insights and Forecast - by Application
- 7. South America Business Intelligence Service Analysis, Insights and Forecast, 2019-2031
- 7.1. Market Analysis, Insights and Forecast - by Application
- 7.1.1. SMES
- 7.1.2. Large Enterprises
- 7.2. Market Analysis, Insights and Forecast - by Types
- 7.2.1. Data Mining and Analytics
- 7.2.2. OLAP
- 7.2.3. Process and Text Mining
- 7.2.4. CPM
- 7.2.5. DSS
- 7.2.6. Others
- 7.1. Market Analysis, Insights and Forecast - by Application
- 8. Europe Business Intelligence Service Analysis, Insights and Forecast, 2019-2031
- 8.1. Market Analysis, Insights and Forecast - by Application
- 8.1.1. SMES
- 8.1.2. Large Enterprises
- 8.2. Market Analysis, Insights and Forecast - by Types
- 8.2.1. Data Mining and Analytics
- 8.2.2. OLAP
- 8.2.3. Process and Text Mining
- 8.2.4. CPM
- 8.2.5. DSS
- 8.2.6. Others
- 8.1. Market Analysis, Insights and Forecast - by Application
- 9. Middle East & Africa Business Intelligence Service Analysis, Insights and Forecast, 2019-2031
- 9.1. Market Analysis, Insights and Forecast - by Application
- 9.1.1. SMES
- 9.1.2. Large Enterprises
- 9.2. Market Analysis, Insights and Forecast - by Types
- 9.2.1. Data Mining and Analytics
- 9.2.2. OLAP
- 9.2.3. Process and Text Mining
- 9.2.4. CPM
- 9.2.5. DSS
- 9.2.6. Others
- 9.1. Market Analysis, Insights and Forecast - by Application
- 10. Asia Pacific Business Intelligence Service Analysis, Insights and Forecast, 2019-2031
- 10.1. Market Analysis, Insights and Forecast - by Application
- 10.1.1. SMES
- 10.1.2. Large Enterprises
- 10.2. Market Analysis, Insights and Forecast - by Types
- 10.2.1. Data Mining and Analytics
- 10.2.2. OLAP
- 10.2.3. Process and Text Mining
- 10.2.4. CPM
- 10.2.5. DSS
- 10.2.6. Others
- 10.1. Market Analysis, Insights and Forecast - by Application
- 11. Competitive Analysis
- 11.1. Global Market Share Analysis 2024
- 11.2. Company Profiles
- 11.2.1 Rackspace
- 11.2.1.1. Overview
- 11.2.1.2. Products
- 11.2.1.3. SWOT Analysis
- 11.2.1.4. Recent Developments
- 11.2.1.5. Financials (Based on Availability)
- 11.2.2 SAP
- 11.2.2.1. Overview
- 11.2.2.2. Products
- 11.2.2.3. SWOT Analysis
- 11.2.2.4. Recent Developments
- 11.2.2.5. Financials (Based on Availability)
- 11.2.3 Microsoft Corporation
- 11.2.3.1. Overview
- 11.2.3.2. Products
- 11.2.3.3. SWOT Analysis
- 11.2.3.4. Recent Developments
- 11.2.3.5. Financials (Based on Availability)
- 11.2.4 Cisco Systems
- 11.2.4.1. Overview
- 11.2.4.2. Products
- 11.2.4.3. SWOT Analysis
- 11.2.4.4. Recent Developments
- 11.2.4.5. Financials (Based on Availability)
- 11.2.5 IBM Corporation
- 11.2.5.1. Overview
- 11.2.5.2. Products
- 11.2.5.3. SWOT Analysis
- 11.2.5.4. Recent Developments
- 11.2.5.5. Financials (Based on Availability)
- 11.2.6 Tableau Software
- 11.2.6.1. Overview
- 11.2.6.2. Products
- 11.2.6.3. SWOT Analysis
- 11.2.6.4. Recent Developments
- 11.2.6.5. Financials (Based on Availability)
- 11.2.7 ADVIZOR Solutions
- 11.2.7.1. Overview
- 11.2.7.2. Products
- 11.2.7.3. SWOT Analysis
- 11.2.7.4. Recent Developments
- 11.2.7.5. Financials (Based on Availability)
- 11.2.8 Oracle
- 11.2.8.1. Overview
- 11.2.8.2. Products
- 11.2.8.3. SWOT Analysis
- 11.2.8.4. Recent Developments
- 11.2.8.5. Financials (Based on Availability)
- 11.2.9 QlikTech International
- 11.2.9.1. Overview
- 11.2.9.2. Products
- 11.2.9.3. SWOT Analysis
- 11.2.9.4. Recent Developments
- 11.2.9.5. Financials (Based on Availability)
- 11.2.10 MicroStrategy
- 11.2.10.1. Overview
- 11.2.10.2. Products
- 11.2.10.3. SWOT Analysis
- 11.2.10.4. Recent Developments
- 11.2.10.5. Financials (Based on Availability)
- 11.2.1 Rackspace
List of Figures
- Figure 1: Global Business Intelligence Service Revenue Breakdown (million, %) by Region 2024 & 2032
- Figure 2: North America Business Intelligence Service Revenue (million), by Application 2024 & 2032
- Figure 3: North America Business Intelligence Service Revenue Share (%), by Application 2024 & 2032
- Figure 4: North America Business Intelligence Service Revenue (million), by Types 2024 & 2032
- Figure 5: North America Business Intelligence Service Revenue Share (%), by Types 2024 & 2032
- Figure 6: North America Business Intelligence Service Revenue (million), by Country 2024 & 2032
- Figure 7: North America Business Intelligence Service Revenue Share (%), by Country 2024 & 2032
- Figure 8: South America Business Intelligence Service Revenue (million), by Application 2024 & 2032
- Figure 9: South America Business Intelligence Service Revenue Share (%), by Application 2024 & 2032
- Figure 10: South America Business Intelligence Service Revenue (million), by Types 2024 & 2032
- Figure 11: South America Business Intelligence Service Revenue Share (%), by Types 2024 & 2032
- Figure 12: South America Business Intelligence Service Revenue (million), by Country 2024 & 2032
- Figure 13: South America Business Intelligence Service Revenue Share (%), by Country 2024 & 2032
- Figure 14: Europe Business Intelligence Service Revenue (million), by Application 2024 & 2032
- Figure 15: Europe Business Intelligence Service Revenue Share (%), by Application 2024 & 2032
- Figure 16: Europe Business Intelligence Service Revenue (million), by Types 2024 & 2032
- Figure 17: Europe Business Intelligence Service Revenue Share (%), by Types 2024 & 2032
- Figure 18: Europe Business Intelligence Service Revenue (million), by Country 2024 & 2032
- Figure 19: Europe Business Intelligence Service Revenue Share (%), by Country 2024 & 2032
- Figure 20: Middle East & Africa Business Intelligence Service Revenue (million), by Application 2024 & 2032
- Figure 21: Middle East & Africa Business Intelligence Service Revenue Share (%), by Application 2024 & 2032
- Figure 22: Middle East & Africa Business Intelligence Service Revenue (million), by Types 2024 & 2032
- Figure 23: Middle East & Africa Business Intelligence Service Revenue Share (%), by Types 2024 & 2032
- Figure 24: Middle East & Africa Business Intelligence Service Revenue (million), by Country 2024 & 2032
- Figure 25: Middle East & Africa Business Intelligence Service Revenue Share (%), by Country 2024 & 2032
- Figure 26: Asia Pacific Business Intelligence Service Revenue (million), by Application 2024 & 2032
- Figure 27: Asia Pacific Business Intelligence Service Revenue Share (%), by Application 2024 & 2032
- Figure 28: Asia Pacific Business Intelligence Service Revenue (million), by Types 2024 & 2032
- Figure 29: Asia Pacific Business Intelligence Service Revenue Share (%), by Types 2024 & 2032
- Figure 30: Asia Pacific Business Intelligence Service Revenue (million), by Country 2024 & 2032
- Figure 31: Asia Pacific Business Intelligence Service Revenue Share (%), by Country 2024 & 2032
List of Tables
- Table 1: Global Business Intelligence Service Revenue million Forecast, by Region 2019 & 2032
- Table 2: Global Business Intelligence Service Revenue million Forecast, by Application 2019 & 2032
- Table 3: Global Business Intelligence Service Revenue million Forecast, by Types 2019 & 2032
- Table 4: Global Business Intelligence Service Revenue million Forecast, by Region 2019 & 2032
- Table 5: Global Business Intelligence Service Revenue million Forecast, by Application 2019 & 2032
- Table 6: Global Business Intelligence Service Revenue million Forecast, by Types 2019 & 2032
- Table 7: Global Business Intelligence Service Revenue million Forecast, by Country 2019 & 2032
- Table 8: United States Business Intelligence Service Revenue (million) Forecast, by Application 2019 & 2032
- Table 9: Canada Business Intelligence Service Revenue (million) Forecast, by Application 2019 & 2032
- Table 10: Mexico Business Intelligence Service Revenue (million) Forecast, by Application 2019 & 2032
- Table 11: Global Business Intelligence Service Revenue million Forecast, by Application 2019 & 2032
- Table 12: Global Business Intelligence Service Revenue million Forecast, by Types 2019 & 2032
- Table 13: Global Business Intelligence Service Revenue million Forecast, by Country 2019 & 2032
- Table 14: Brazil Business Intelligence Service Revenue (million) Forecast, by Application 2019 & 2032
- Table 15: Argentina Business Intelligence Service Revenue (million) Forecast, by Application 2019 & 2032
- Table 16: Rest of South America Business Intelligence Service Revenue (million) Forecast, by Application 2019 & 2032
- Table 17: Global Business Intelligence Service Revenue million Forecast, by Application 2019 & 2032
- Table 18: Global Business Intelligence Service Revenue million Forecast, by Types 2019 & 2032
- Table 19: Global Business Intelligence Service Revenue million Forecast, by Country 2019 & 2032
- Table 20: United Kingdom Business Intelligence Service Revenue (million) Forecast, by Application 2019 & 2032
- Table 21: Germany Business Intelligence Service Revenue (million) Forecast, by Application 2019 & 2032
- Table 22: France Business Intelligence Service Revenue (million) Forecast, by Application 2019 & 2032
- Table 23: Italy Business Intelligence Service Revenue (million) Forecast, by Application 2019 & 2032
- Table 24: Spain Business Intelligence Service Revenue (million) Forecast, by Application 2019 & 2032
- Table 25: Russia Business Intelligence Service Revenue (million) Forecast, by Application 2019 & 2032
- Table 26: Benelux Business Intelligence Service Revenue (million) Forecast, by Application 2019 & 2032
- Table 27: Nordics Business Intelligence Service Revenue (million) Forecast, by Application 2019 & 2032
- Table 28: Rest of Europe Business Intelligence Service Revenue (million) Forecast, by Application 2019 & 2032
- Table 29: Global Business Intelligence Service Revenue million Forecast, by Application 2019 & 2032
- Table 30: Global Business Intelligence Service Revenue million Forecast, by Types 2019 & 2032
- Table 31: Global Business Intelligence Service Revenue million Forecast, by Country 2019 & 2032
- Table 32: Turkey Business Intelligence Service Revenue (million) Forecast, by Application 2019 & 2032
- Table 33: Israel Business Intelligence Service Revenue (million) Forecast, by Application 2019 & 2032
- Table 34: GCC Business Intelligence Service Revenue (million) Forecast, by Application 2019 & 2032
- Table 35: North Africa Business Intelligence Service Revenue (million) Forecast, by Application 2019 & 2032
- Table 36: South Africa Business Intelligence Service Revenue (million) Forecast, by Application 2019 & 2032
- Table 37: Rest of Middle East & Africa Business Intelligence Service Revenue (million) Forecast, by Application 2019 & 2032
- Table 38: Global Business Intelligence Service Revenue million Forecast, by Application 2019 & 2032
- Table 39: Global Business Intelligence Service Revenue million Forecast, by Types 2019 & 2032
- Table 40: Global Business Intelligence Service Revenue million Forecast, by Country 2019 & 2032
- Table 41: China Business Intelligence Service Revenue (million) Forecast, by Application 2019 & 2032
- Table 42: India Business Intelligence Service Revenue (million) Forecast, by Application 2019 & 2032
- Table 43: Japan Business Intelligence Service Revenue (million) Forecast, by Application 2019 & 2032
- Table 44: South Korea Business Intelligence Service Revenue (million) Forecast, by Application 2019 & 2032
- Table 45: ASEAN Business Intelligence Service Revenue (million) Forecast, by Application 2019 & 2032
- Table 46: Oceania Business Intelligence Service Revenue (million) Forecast, by Application 2019 & 2032
- Table 47: Rest of Asia Pacific Business Intelligence Service Revenue (million) Forecast, by Application 2019 & 2032
Frequently Asked Questions
1. What is the projected Compound Annual Growth Rate (CAGR) of the Business Intelligence Service?
The projected CAGR is approximately 23.3%.
2. Which companies are prominent players in the Business Intelligence Service?
Key companies in the market include Rackspace, SAP, Microsoft Corporation, Cisco Systems, IBM Corporation, Tableau Software, ADVIZOR Solutions, Oracle, QlikTech International, MicroStrategy.
3. What are the main segments of the Business Intelligence Service?
The market segments include Application, Types.
4. Can you provide details about the market size?
The market size is estimated to be USD 28320 million as of 2022.
5. What are some drivers contributing to market growth?
N/A
6. What are the notable trends driving market growth?
N/A
7. Are there any restraints impacting market growth?
N/A
8. Can you provide examples of recent developments in the market?
N/A
9. What pricing options are available for accessing the report?
Pricing options include single-user, multi-user, and enterprise licenses priced at USD 3950.00, USD 5925.00, and USD 7900.00 respectively.
10. Is the market size provided in terms of value or volume?
The market size is provided in terms of value, measured in million.
11. Are there any specific market keywords associated with the report?
Yes, the market keyword associated with the report is "Business Intelligence Service," which aids in identifying and referencing the specific market segment covered.
12. How do I determine which pricing option suits my needs best?
The pricing options vary based on user requirements and access needs. Individual users may opt for single-user licenses, while businesses requiring broader access may choose multi-user or enterprise licenses for cost-effective access to the report.
13. Are there any additional resources or data provided in the Business Intelligence Service report?
While the report offers comprehensive insights, it's advisable to review the specific contents or supplementary materials provided to ascertain if additional resources or data are available.
14. How can I stay updated on further developments or reports in the Business Intelligence Service?
To stay informed about further developments, trends, and reports in the Business Intelligence Service, consider subscribing to industry newsletters, following relevant companies and organizations, or regularly checking reputable industry news sources and publications.
Methodology
Step 1 - Identification of Relevant Samples Size from Population Database


Step 2 - Approaches for Defining Global Market Size (Value, Volume* & Price*)

Note*: In applicable scenarios
Step 3 - Data Sources
Primary Research
- Web Analytics
- Survey Reports
- Research Institute
- Latest Research Reports
- Opinion Leaders
Secondary Research
- Annual Reports
- White Paper
- Latest Press Release
- Industry Association
- Paid Database
- Investor Presentations

Step 4 - Data Triangulation
Involves using different sources of information in order to increase the validity of a study
These sources are likely to be stakeholders in a program - participants, other researchers, program staff, other community members, and so on.
Then we put all data in single framework & apply various statistical tools to find out the dynamic on the market.
During the analysis stage, feedback from the stakeholder groups would be compared to determine areas of agreement as well as areas of divergence


