
Key Insights
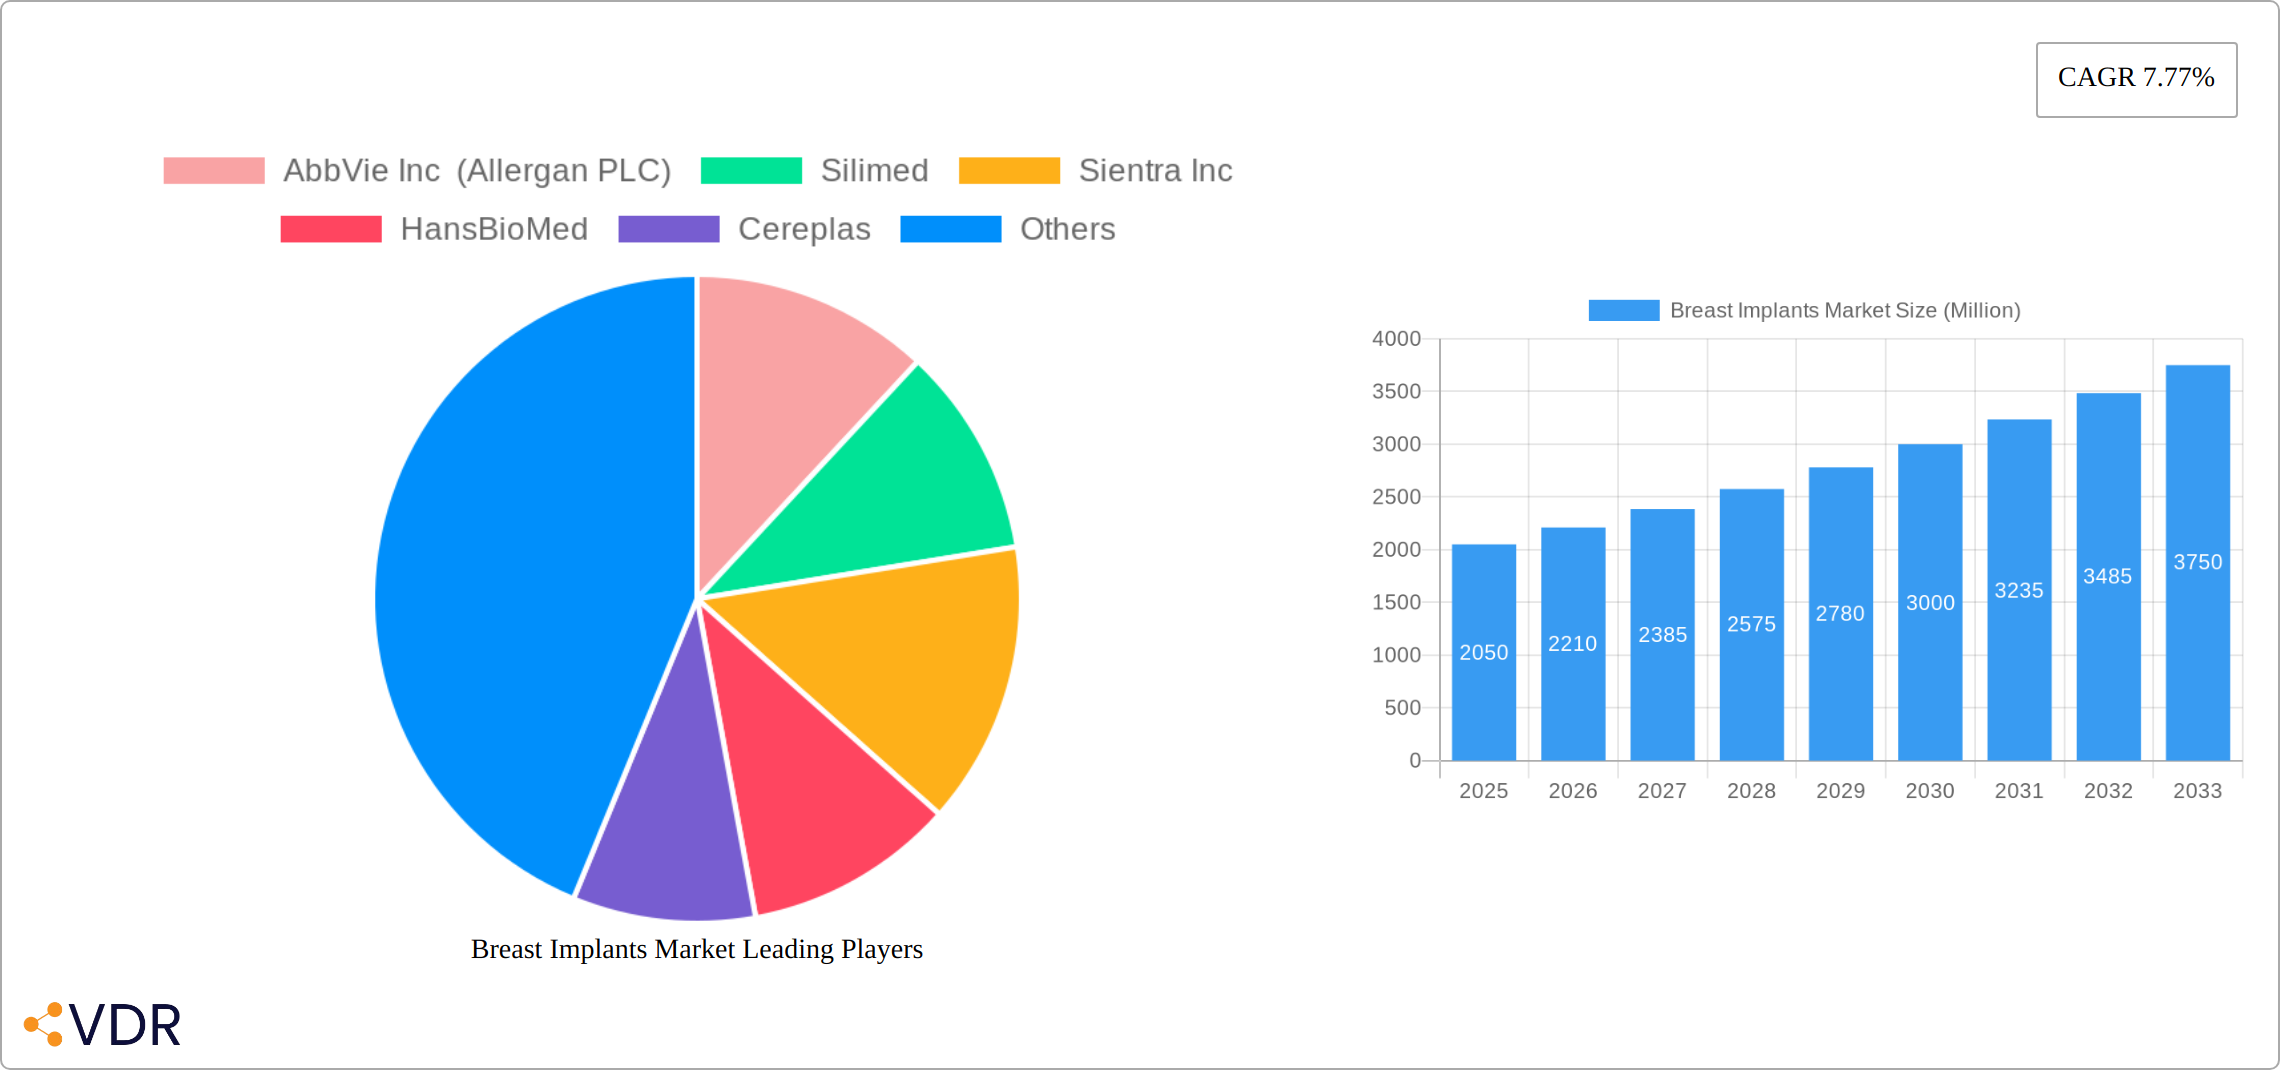
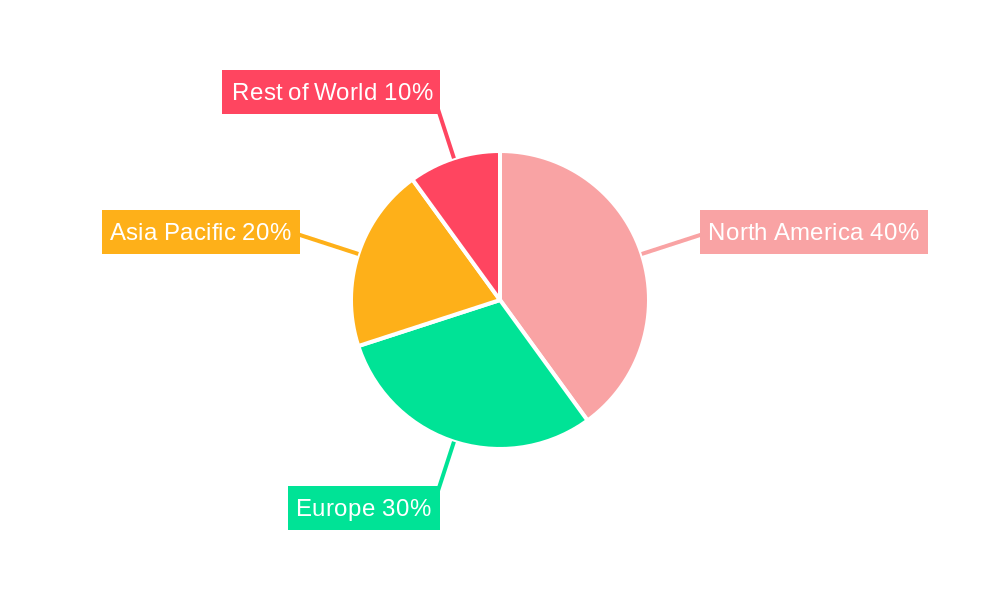
The global breast implants market, valued at $2.05 billion in 2025, is projected to experience robust growth, driven by a rising prevalence of breast cancer requiring reconstructive surgery, increasing demand for cosmetic enhancements, and advancements in implant technology leading to improved safety and longevity. The market's Compound Annual Growth Rate (CAGR) of 7.77% from 2019 to 2024 suggests a continued upward trajectory through 2033. Key growth drivers include the increasing disposable incomes in emerging economies fueling demand for aesthetic procedures, technological advancements like the development of form-stable and structured saline implants offering improved safety and natural feel, and the expansion of specialized cosmetic surgery clinics and hospitals offering these procedures. The market is segmented by implant type (silicone, form-stable, saline, structured saline), application (reconstructive and cosmetic surgery), and end-user (hospitals, cosmetology clinics, and others). Silicone implants currently dominate the market due to their established use and aesthetic properties, but the form-stable and structured saline segments are expected to witness significant growth due to their perceived safety advantages. Geographical analysis reveals strong market presence in North America and Europe, driven by high healthcare expenditure and advanced medical infrastructure. However, Asia-Pacific is anticipated to demonstrate faster growth due to rising awareness, increasing disposable incomes, and a growing number of cosmetic surgery centers.
Despite the positive outlook, the market faces certain restraints. These include potential risks and complications associated with breast implants, regulatory scrutiny and evolving safety guidelines, and the high cost of procedures limiting accessibility in certain regions. Furthermore, increasing public awareness about the potential long-term health effects and risks associated with certain implant types could moderately impact market growth. Nevertheless, the consistent demand driven by cosmetic and reconstructive needs, coupled with continuous innovation within the industry, is expected to mitigate these challenges and sustain the market's overall positive growth trajectory in the coming years. The major players in this competitive market include AbbVie Inc (Allergan PLC), Silimed, Sientra Inc, HansBioMed, Cereplas, Establishment Labs SA, Polytech Health & Aesthetics GmbH, Laboratories Arion, Johnson & Johnson (Mentor Worldwide LLC), Groupe Sebbin SAS, and GC Aesthetics, constantly striving for innovation and market share.
Breast Implants Market: A Comprehensive Report (2019-2033)
This comprehensive report provides an in-depth analysis of the global Breast Implants market, encompassing market size, growth trends, competitive landscape, and future outlook. The report covers the period from 2019 to 2033, with a focus on the forecast period of 2025-2033, using 2025 as the base year. It segments the market by type (Silicone Implants, Form-stable Implants, Saline Implants, Structured Saline Implants), application (Reconstructive Surgery, Cosmetic Surgery), and end-user (Hospital, Cosmetology Clinic, Other End-users). The report also details key players, industry developments, and emerging opportunities. Expected market size in 2025 is estimated at xx Million units.
Breast Implants Market Dynamics & Structure
The global breast implants market is characterized by moderate concentration, with several key players holding significant market share. Technological innovation, primarily focused on implant safety, biocompatibility, and enhanced aesthetics, is a key driver. Stringent regulatory frameworks, varying across geographies, impact market access and product approvals. The market faces competition from alternative reconstructive and aesthetic procedures. End-user demographics, particularly the increasing number of women undergoing cosmetic procedures, significantly influence market growth. Mergers and acquisitions (M&A) activity is relatively moderate, with strategic partnerships playing a more prominent role.
- Market Concentration: Moderately concentrated, with top 5 players holding approximately xx% market share in 2025.
- Technological Innovation: Focus on improved biocompatibility, longer lifespan, and personalized implants. Significant barriers include high R&D costs and stringent regulatory approvals.
- Regulatory Frameworks: Vary across regions; impact product approvals and market entry. The European Medical Device Regulation (MDR) is a significant factor.
- Competitive Substitutes: Fat grafting, tissue expanders, and other aesthetic procedures pose competition.
- End-User Demographics: Increasing demand driven by rising disposable incomes and increased awareness of cosmetic procedures.
- M&A Activity: Moderate, with xx M&A deals recorded between 2019-2024.
Breast Implants Market Growth Trends & Insights
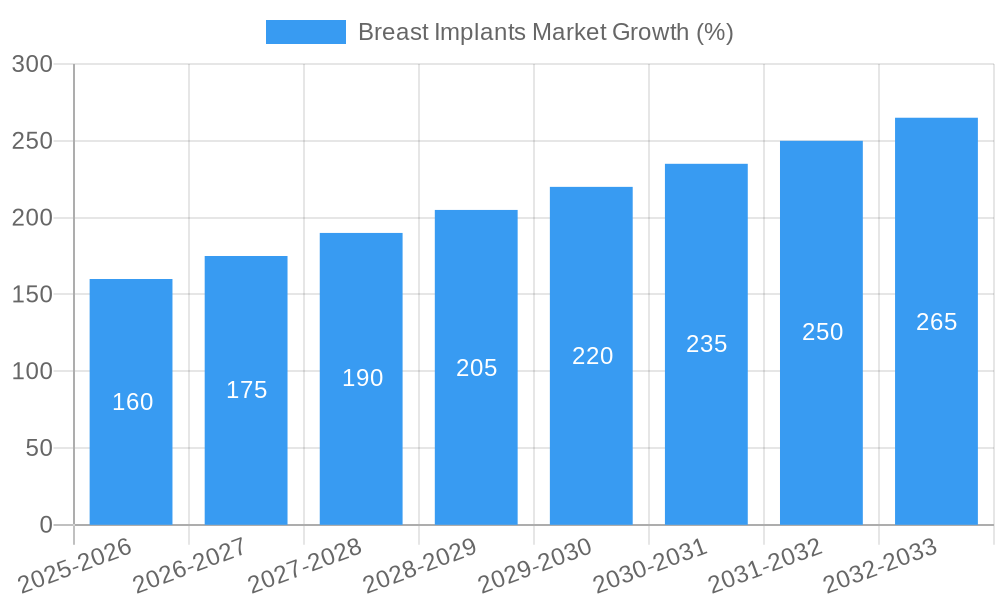
The global breast implants market exhibits steady growth, driven by the increasing prevalence of breast cancer and the rising demand for cosmetic enhancements. The market witnessed a CAGR of xx% during the historical period (2019-2024) and is projected to grow at a CAGR of xx% during the forecast period (2025-2033). Adoption rates are higher in developed regions with advanced healthcare infrastructure and disposable incomes. Technological advancements, such as the introduction of 4D-printed smart implants, are disrupting the market, while consumer preference shifts towards natural-looking results are shaping product development. Market penetration is highest in North America and Europe, with emerging markets presenting significant growth opportunities.
Dominant Regions, Countries, or Segments in Breast Implants Market
The global breast implants market is currently dominated by North America, fueled by high healthcare expenditure, sophisticated medical infrastructure, and a strong preference for cosmetic enhancement procedures. Europe holds a substantial share, benefiting from its established healthcare systems and growing awareness of breast augmentation and reconstruction. Within the product segmentation, silicone implants maintain the largest market share due to their widespread acceptance and proven track record, offering a natural aesthetic. While reconstructive surgery remains a significant application segment driven by breast cancer prevalence, the cosmetic surgery segment exhibits faster growth, reflecting changing societal beauty standards and increased patient demand. Hospitals are the primary end-users, followed by specialized cosmetic surgery clinics and ambulatory surgical centers.
- Key Drivers: Increased disposable incomes in developed nations, advanced healthcare infrastructure facilitating complex procedures, rising awareness and acceptance of cosmetic procedures fueled by media influence and social media trends, and the increasing prevalence of breast cancer necessitating reconstructive surgery.
- Dominance Factors: Established healthcare systems with robust regulatory frameworks (though variations exist across regions), high adoption rates for cosmetic surgeries, strong insurance coverage in specific regions (e.g., North America), and a well-developed distribution network. Market share projections indicate North America's continued lead, anticipated to hold approximately [Insert Percentage]% market share by 2027.
Breast Implants Market Product Landscape
The breast implants market presents a diverse range of products categorized by material (silicone gel-filled, saline-filled), texture (smooth, textured, micro-textured), and shape (round, anatomical, form-stable). Silicone implants continue to command the largest share due to their perceived natural feel and appearance, closely followed by saline implants which offer a more cost-effective option. Recent innovations focus on enhancing implant safety, longevity, and minimizing potential complications such as capsular contracture. Textured implants remain prevalent, aiming to reduce the incidence of capsular contracture, while ongoing research explores novel surface technologies and biocompatible materials for improved integration and reduced adverse events. The emergence of 4D-printed smart implants signifies a pivotal advancement, offering the potential for personalized solutions and functionalities like integrated drug delivery systems for targeted therapeutic applications. This technology is still largely in the research and development phase but is a promising development for the future.
Key Drivers, Barriers & Challenges in Breast Implants Market
Key Drivers:
- Rising incidence of breast cancer globally, driving demand for reconstructive breast surgery.
- Growing awareness and acceptance of cosmetic breast augmentation procedures, driven by evolving societal beauty standards and media influence.
- Technological advancements leading to safer, more durable, and aesthetically pleasing implants with improved biocompatibility.
- Expansion of the market into emerging economies with rising disposable incomes and increased interest in cosmetic procedures.
Challenges & Restraints:
- Stringent regulatory approvals and compliance requirements varying across different geographies, impacting time to market and product availability.
- Potential long-term complications associated with implants, such as capsular contracture, rupture, and implant-associated anaplastic large cell lymphoma (BIA-ALCL), necessitating robust post-operative monitoring and patient education.
- High cost of surgery, potentially limiting accessibility for patients in certain regions or socioeconomic groups.
- Competition from alternative aesthetic procedures, such as fat grafting and breast lifts.
- Concerns regarding the potential environmental impact of implant manufacturing and disposal.
Emerging Opportunities in Breast Implants Market
- Expanding into emerging markets: Untapped potential in developing economies with rising disposable incomes.
- Personalized implants: Tailored solutions addressing individual patient needs and preferences (e.g., 4D printing).
- Innovative materials and technologies: Development of biocompatible materials and minimally invasive procedures.
- Focus on patient safety and reducing long-term complications: Developing enhanced post-operative care strategies.
Growth Accelerators in the Breast Implants Market Industry
Technological advancements in implant design and materials science are pivotal growth drivers, focusing on improved safety profiles, enhanced longevity, and customizable aesthetics. Strategic partnerships between manufacturers, healthcare providers, and distributors facilitate market expansion and access. The penetration of emerging economies presents significant growth opportunities, driven by increased disposable incomes and rising awareness of cosmetic surgery. A strong emphasis on patient safety, minimizing complications, and providing comprehensive post-operative care are crucial for bolstering market acceptance and building patient confidence. Furthermore, advancements in minimally invasive surgical techniques are contributing to shorter recovery times and reduced patient discomfort, increasing the appeal of the procedure.
Key Players Shaping the Breast Implants Market Market
- AbbVie Inc (Allergan PLC)
- Silimed
- Sientra Inc
- HansBioMed
- Cereplas
- Establishment Labs SA
- Polytech Health & Aesthetics GmbH
- Laboratories Arion
- Johnson & Johnson (Mentor Worldwide LLC)
- Groupe Sebbin SAS
- GC Aesthetics
Notable Milestones in Breast Implants Market Sector
- September 2023: Queen's University Belfast announced the development of 4D-printed smart breast implants for cancer patients, incorporating drug delivery capabilities – a significant milestone in personalized medicine.
- April 2024: GC Aesthetics launched the LUNA XT, a micro-textured anatomical breast implant approved under the stringent European Medical Device Regulation (MDR), highlighting advancements in regulatory compliance and product innovation.
- [Add another recent milestone with date and brief description]
In-Depth Breast Implants Market Market Outlook
The breast implants market is poised for sustained growth, driven by technological innovations, market expansion into developing regions, and rising demand for both reconstructive and cosmetic procedures. Strategic partnerships and a focus on enhancing patient safety will further propel market expansion. The increasing acceptance of minimally invasive techniques and personalized solutions will contribute to long-term growth potential, creating lucrative opportunities for manufacturers and healthcare providers alike.
Breast Implants Market Segmentation
-
1. Type
- 1.1. Silicone Implants
- 1.2. Form-stable Implants
- 1.3. Saline Implants
- 1.4. Structured Saline Implants
-
2. Application
- 2.1. Reconstructive Surgery
- 2.2. Cosmetic Surgery
-
3. End-user
- 3.1. Hospital
- 3.2. Cosmetology Clinic
- 3.3. Other End-users
Breast Implants Market Segmentation By Geography
-
1. North America
- 1.1. United States
- 1.2. Canada
- 1.3. Mexico
-
2. Europe
- 2.1. Germany
- 2.2. United Kingdom
- 2.3. France
- 2.4. Italy
- 2.5. Spain
- 2.6. Rest of Europe
-
3. Asia Pacific
- 3.1. China
- 3.2. Japan
- 3.3. India
- 3.4. Australia
- 3.5. South Korea
- 3.6. Rest of Asia Pacific
-
4. Middle East and Africa
- 4.1. GCC
- 4.2. South Africa
- 4.3. Rest of Middle East and Africa
-
5. South America
- 5.1. Brazil
- 5.2. Argentina
- 5.3. Rest of South America
Breast Implants Market REPORT HIGHLIGHTS
| Aspects | Details |
|---|---|
| Study Period | 2019-2033 |
| Base Year | 2024 |
| Estimated Year | 2025 |
| Forecast Period | 2025-2033 |
| Historical Period | 2019-2024 |
| Growth Rate | CAGR of 7.77% from 2019-2033 |
| Segmentation |
|
Table of Contents
- 1. Introduction
- 1.1. Research Scope
- 1.2. Market Segmentation
- 1.3. Research Methodology
- 1.4. Definitions and Assumptions
- 2. Executive Summary
- 2.1. Introduction
- 3. Market Dynamics
- 3.1. Introduction
- 3.2. Market Drivers
- 3.2.1. Rising Incidence of Breast Cancer; Increasing Number of Breast Augmentation Procedures; Technological Advancements
- 3.3. Market Restrains
- 3.3.1. Post Complications and Risks Associated with Breast Implants; High Cost of Breast Implants
- 3.4. Market Trends
- 3.4.1. Silicone Implant is Expected to Hold a Major Share in the Market Over the Forecast Period
- 4. Market Factor Analysis
- 4.1. Porters Five Forces
- 4.2. Supply/Value Chain
- 4.3. PESTEL analysis
- 4.4. Market Entropy
- 4.5. Patent/Trademark Analysis
- 5. Global Breast Implants Market Analysis, Insights and Forecast, 2019-2031
- 5.1. Market Analysis, Insights and Forecast - by Type
- 5.1.1. Silicone Implants
- 5.1.2. Form-stable Implants
- 5.1.3. Saline Implants
- 5.1.4. Structured Saline Implants
- 5.2. Market Analysis, Insights and Forecast - by Application
- 5.2.1. Reconstructive Surgery
- 5.2.2. Cosmetic Surgery
- 5.3. Market Analysis, Insights and Forecast - by End-user
- 5.3.1. Hospital
- 5.3.2. Cosmetology Clinic
- 5.3.3. Other End-users
- 5.4. Market Analysis, Insights and Forecast - by Region
- 5.4.1. North America
- 5.4.2. Europe
- 5.4.3. Asia Pacific
- 5.4.4. Middle East and Africa
- 5.4.5. South America
- 5.1. Market Analysis, Insights and Forecast - by Type
- 6. North America Breast Implants Market Analysis, Insights and Forecast, 2019-2031
- 6.1. Market Analysis, Insights and Forecast - by Type
- 6.1.1. Silicone Implants
- 6.1.2. Form-stable Implants
- 6.1.3. Saline Implants
- 6.1.4. Structured Saline Implants
- 6.2. Market Analysis, Insights and Forecast - by Application
- 6.2.1. Reconstructive Surgery
- 6.2.2. Cosmetic Surgery
- 6.3. Market Analysis, Insights and Forecast - by End-user
- 6.3.1. Hospital
- 6.3.2. Cosmetology Clinic
- 6.3.3. Other End-users
- 6.1. Market Analysis, Insights and Forecast - by Type
- 7. Europe Breast Implants Market Analysis, Insights and Forecast, 2019-2031
- 7.1. Market Analysis, Insights and Forecast - by Type
- 7.1.1. Silicone Implants
- 7.1.2. Form-stable Implants
- 7.1.3. Saline Implants
- 7.1.4. Structured Saline Implants
- 7.2. Market Analysis, Insights and Forecast - by Application
- 7.2.1. Reconstructive Surgery
- 7.2.2. Cosmetic Surgery
- 7.3. Market Analysis, Insights and Forecast - by End-user
- 7.3.1. Hospital
- 7.3.2. Cosmetology Clinic
- 7.3.3. Other End-users
- 7.1. Market Analysis, Insights and Forecast - by Type
- 8. Asia Pacific Breast Implants Market Analysis, Insights and Forecast, 2019-2031
- 8.1. Market Analysis, Insights and Forecast - by Type
- 8.1.1. Silicone Implants
- 8.1.2. Form-stable Implants
- 8.1.3. Saline Implants
- 8.1.4. Structured Saline Implants
- 8.2. Market Analysis, Insights and Forecast - by Application
- 8.2.1. Reconstructive Surgery
- 8.2.2. Cosmetic Surgery
- 8.3. Market Analysis, Insights and Forecast - by End-user
- 8.3.1. Hospital
- 8.3.2. Cosmetology Clinic
- 8.3.3. Other End-users
- 8.1. Market Analysis, Insights and Forecast - by Type
- 9. Middle East and Africa Breast Implants Market Analysis, Insights and Forecast, 2019-2031
- 9.1. Market Analysis, Insights and Forecast - by Type
- 9.1.1. Silicone Implants
- 9.1.2. Form-stable Implants
- 9.1.3. Saline Implants
- 9.1.4. Structured Saline Implants
- 9.2. Market Analysis, Insights and Forecast - by Application
- 9.2.1. Reconstructive Surgery
- 9.2.2. Cosmetic Surgery
- 9.3. Market Analysis, Insights and Forecast - by End-user
- 9.3.1. Hospital
- 9.3.2. Cosmetology Clinic
- 9.3.3. Other End-users
- 9.1. Market Analysis, Insights and Forecast - by Type
- 10. South America Breast Implants Market Analysis, Insights and Forecast, 2019-2031
- 10.1. Market Analysis, Insights and Forecast - by Type
- 10.1.1. Silicone Implants
- 10.1.2. Form-stable Implants
- 10.1.3. Saline Implants
- 10.1.4. Structured Saline Implants
- 10.2. Market Analysis, Insights and Forecast - by Application
- 10.2.1. Reconstructive Surgery
- 10.2.2. Cosmetic Surgery
- 10.3. Market Analysis, Insights and Forecast - by End-user
- 10.3.1. Hospital
- 10.3.2. Cosmetology Clinic
- 10.3.3. Other End-users
- 10.1. Market Analysis, Insights and Forecast - by Type
- 11. North America Breast Implants Market Analysis, Insights and Forecast, 2019-2031
- 11.1. Market Analysis, Insights and Forecast - By Country/Sub-region
- 11.1.1 United States
- 11.1.2 Canada
- 11.1.3 Mexico
- 12. Europe Breast Implants Market Analysis, Insights and Forecast, 2019-2031
- 12.1. Market Analysis, Insights and Forecast - By Country/Sub-region
- 12.1.1 Germany
- 12.1.2 United Kingdom
- 12.1.3 France
- 12.1.4 Italy
- 12.1.5 Spain
- 12.1.6 Rest of Europe
- 13. Asia Pacific Breast Implants Market Analysis, Insights and Forecast, 2019-2031
- 13.1. Market Analysis, Insights and Forecast - By Country/Sub-region
- 13.1.1 China
- 13.1.2 Japan
- 13.1.3 India
- 13.1.4 Australia
- 13.1.5 South Korea
- 13.1.6 Rest of Asia Pacific
- 14. Middle East and Africa Breast Implants Market Analysis, Insights and Forecast, 2019-2031
- 14.1. Market Analysis, Insights and Forecast - By Country/Sub-region
- 14.1.1 GCC
- 14.1.2 South Africa
- 14.1.3 Rest of Middle East and Africa
- 15. South America Breast Implants Market Analysis, Insights and Forecast, 2019-2031
- 15.1. Market Analysis, Insights and Forecast - By Country/Sub-region
- 15.1.1 Brazil
- 15.1.2 Argentina
- 15.1.3 Rest of South America
- 16. Competitive Analysis
- 16.1. Global Market Share Analysis 2024
- 16.2. Company Profiles
- 16.2.1 AbbVie Inc (Allergan PLC)
- 16.2.1.1. Overview
- 16.2.1.2. Products
- 16.2.1.3. SWOT Analysis
- 16.2.1.4. Recent Developments
- 16.2.1.5. Financials (Based on Availability)
- 16.2.2 Silimed
- 16.2.2.1. Overview
- 16.2.2.2. Products
- 16.2.2.3. SWOT Analysis
- 16.2.2.4. Recent Developments
- 16.2.2.5. Financials (Based on Availability)
- 16.2.3 Sientra Inc
- 16.2.3.1. Overview
- 16.2.3.2. Products
- 16.2.3.3. SWOT Analysis
- 16.2.3.4. Recent Developments
- 16.2.3.5. Financials (Based on Availability)
- 16.2.4 HansBioMed
- 16.2.4.1. Overview
- 16.2.4.2. Products
- 16.2.4.3. SWOT Analysis
- 16.2.4.4. Recent Developments
- 16.2.4.5. Financials (Based on Availability)
- 16.2.5 Cereplas
- 16.2.5.1. Overview
- 16.2.5.2. Products
- 16.2.5.3. SWOT Analysis
- 16.2.5.4. Recent Developments
- 16.2.5.5. Financials (Based on Availability)
- 16.2.6 Establishment Labs SA
- 16.2.6.1. Overview
- 16.2.6.2. Products
- 16.2.6.3. SWOT Analysis
- 16.2.6.4. Recent Developments
- 16.2.6.5. Financials (Based on Availability)
- 16.2.7 Polytech Health & Aesthetics GmbH
- 16.2.7.1. Overview
- 16.2.7.2. Products
- 16.2.7.3. SWOT Analysis
- 16.2.7.4. Recent Developments
- 16.2.7.5. Financials (Based on Availability)
- 16.2.8 Laboratories Arion
- 16.2.8.1. Overview
- 16.2.8.2. Products
- 16.2.8.3. SWOT Analysis
- 16.2.8.4. Recent Developments
- 16.2.8.5. Financials (Based on Availability)
- 16.2.9 Johnson & Johnson (Mentor Worldwide LLC )
- 16.2.9.1. Overview
- 16.2.9.2. Products
- 16.2.9.3. SWOT Analysis
- 16.2.9.4. Recent Developments
- 16.2.9.5. Financials (Based on Availability)
- 16.2.10 Groupe Sebbin SAS
- 16.2.10.1. Overview
- 16.2.10.2. Products
- 16.2.10.3. SWOT Analysis
- 16.2.10.4. Recent Developments
- 16.2.10.5. Financials (Based on Availability)
- 16.2.11 GC Aesthetics
- 16.2.11.1. Overview
- 16.2.11.2. Products
- 16.2.11.3. SWOT Analysis
- 16.2.11.4. Recent Developments
- 16.2.11.5. Financials (Based on Availability)
- 16.2.1 AbbVie Inc (Allergan PLC)
List of Figures
- Figure 1: Global Breast Implants Market Revenue Breakdown (Million, %) by Region 2024 & 2032
- Figure 2: Global Breast Implants Market Volume Breakdown (K Unit, %) by Region 2024 & 2032
- Figure 3: North America Breast Implants Market Revenue (Million), by Country 2024 & 2032
- Figure 4: North America Breast Implants Market Volume (K Unit), by Country 2024 & 2032
- Figure 5: North America Breast Implants Market Revenue Share (%), by Country 2024 & 2032
- Figure 6: North America Breast Implants Market Volume Share (%), by Country 2024 & 2032
- Figure 7: Europe Breast Implants Market Revenue (Million), by Country 2024 & 2032
- Figure 8: Europe Breast Implants Market Volume (K Unit), by Country 2024 & 2032
- Figure 9: Europe Breast Implants Market Revenue Share (%), by Country 2024 & 2032
- Figure 10: Europe Breast Implants Market Volume Share (%), by Country 2024 & 2032
- Figure 11: Asia Pacific Breast Implants Market Revenue (Million), by Country 2024 & 2032
- Figure 12: Asia Pacific Breast Implants Market Volume (K Unit), by Country 2024 & 2032
- Figure 13: Asia Pacific Breast Implants Market Revenue Share (%), by Country 2024 & 2032
- Figure 14: Asia Pacific Breast Implants Market Volume Share (%), by Country 2024 & 2032
- Figure 15: Middle East and Africa Breast Implants Market Revenue (Million), by Country 2024 & 2032
- Figure 16: Middle East and Africa Breast Implants Market Volume (K Unit), by Country 2024 & 2032
- Figure 17: Middle East and Africa Breast Implants Market Revenue Share (%), by Country 2024 & 2032
- Figure 18: Middle East and Africa Breast Implants Market Volume Share (%), by Country 2024 & 2032
- Figure 19: South America Breast Implants Market Revenue (Million), by Country 2024 & 2032
- Figure 20: South America Breast Implants Market Volume (K Unit), by Country 2024 & 2032
- Figure 21: South America Breast Implants Market Revenue Share (%), by Country 2024 & 2032
- Figure 22: South America Breast Implants Market Volume Share (%), by Country 2024 & 2032
- Figure 23: North America Breast Implants Market Revenue (Million), by Type 2024 & 2032
- Figure 24: North America Breast Implants Market Volume (K Unit), by Type 2024 & 2032
- Figure 25: North America Breast Implants Market Revenue Share (%), by Type 2024 & 2032
- Figure 26: North America Breast Implants Market Volume Share (%), by Type 2024 & 2032
- Figure 27: North America Breast Implants Market Revenue (Million), by Application 2024 & 2032
- Figure 28: North America Breast Implants Market Volume (K Unit), by Application 2024 & 2032
- Figure 29: North America Breast Implants Market Revenue Share (%), by Application 2024 & 2032
- Figure 30: North America Breast Implants Market Volume Share (%), by Application 2024 & 2032
- Figure 31: North America Breast Implants Market Revenue (Million), by End-user 2024 & 2032
- Figure 32: North America Breast Implants Market Volume (K Unit), by End-user 2024 & 2032
- Figure 33: North America Breast Implants Market Revenue Share (%), by End-user 2024 & 2032
- Figure 34: North America Breast Implants Market Volume Share (%), by End-user 2024 & 2032
- Figure 35: North America Breast Implants Market Revenue (Million), by Country 2024 & 2032
- Figure 36: North America Breast Implants Market Volume (K Unit), by Country 2024 & 2032
- Figure 37: North America Breast Implants Market Revenue Share (%), by Country 2024 & 2032
- Figure 38: North America Breast Implants Market Volume Share (%), by Country 2024 & 2032
- Figure 39: Europe Breast Implants Market Revenue (Million), by Type 2024 & 2032
- Figure 40: Europe Breast Implants Market Volume (K Unit), by Type 2024 & 2032
- Figure 41: Europe Breast Implants Market Revenue Share (%), by Type 2024 & 2032
- Figure 42: Europe Breast Implants Market Volume Share (%), by Type 2024 & 2032
- Figure 43: Europe Breast Implants Market Revenue (Million), by Application 2024 & 2032
- Figure 44: Europe Breast Implants Market Volume (K Unit), by Application 2024 & 2032
- Figure 45: Europe Breast Implants Market Revenue Share (%), by Application 2024 & 2032
- Figure 46: Europe Breast Implants Market Volume Share (%), by Application 2024 & 2032
- Figure 47: Europe Breast Implants Market Revenue (Million), by End-user 2024 & 2032
- Figure 48: Europe Breast Implants Market Volume (K Unit), by End-user 2024 & 2032
- Figure 49: Europe Breast Implants Market Revenue Share (%), by End-user 2024 & 2032
- Figure 50: Europe Breast Implants Market Volume Share (%), by End-user 2024 & 2032
- Figure 51: Europe Breast Implants Market Revenue (Million), by Country 2024 & 2032
- Figure 52: Europe Breast Implants Market Volume (K Unit), by Country 2024 & 2032
- Figure 53: Europe Breast Implants Market Revenue Share (%), by Country 2024 & 2032
- Figure 54: Europe Breast Implants Market Volume Share (%), by Country 2024 & 2032
- Figure 55: Asia Pacific Breast Implants Market Revenue (Million), by Type 2024 & 2032
- Figure 56: Asia Pacific Breast Implants Market Volume (K Unit), by Type 2024 & 2032
- Figure 57: Asia Pacific Breast Implants Market Revenue Share (%), by Type 2024 & 2032
- Figure 58: Asia Pacific Breast Implants Market Volume Share (%), by Type 2024 & 2032
- Figure 59: Asia Pacific Breast Implants Market Revenue (Million), by Application 2024 & 2032
- Figure 60: Asia Pacific Breast Implants Market Volume (K Unit), by Application 2024 & 2032
- Figure 61: Asia Pacific Breast Implants Market Revenue Share (%), by Application 2024 & 2032
- Figure 62: Asia Pacific Breast Implants Market Volume Share (%), by Application 2024 & 2032
- Figure 63: Asia Pacific Breast Implants Market Revenue (Million), by End-user 2024 & 2032
- Figure 64: Asia Pacific Breast Implants Market Volume (K Unit), by End-user 2024 & 2032
- Figure 65: Asia Pacific Breast Implants Market Revenue Share (%), by End-user 2024 & 2032
- Figure 66: Asia Pacific Breast Implants Market Volume Share (%), by End-user 2024 & 2032
- Figure 67: Asia Pacific Breast Implants Market Revenue (Million), by Country 2024 & 2032
- Figure 68: Asia Pacific Breast Implants Market Volume (K Unit), by Country 2024 & 2032
- Figure 69: Asia Pacific Breast Implants Market Revenue Share (%), by Country 2024 & 2032
- Figure 70: Asia Pacific Breast Implants Market Volume Share (%), by Country 2024 & 2032
- Figure 71: Middle East and Africa Breast Implants Market Revenue (Million), by Type 2024 & 2032
- Figure 72: Middle East and Africa Breast Implants Market Volume (K Unit), by Type 2024 & 2032
- Figure 73: Middle East and Africa Breast Implants Market Revenue Share (%), by Type 2024 & 2032
- Figure 74: Middle East and Africa Breast Implants Market Volume Share (%), by Type 2024 & 2032
- Figure 75: Middle East and Africa Breast Implants Market Revenue (Million), by Application 2024 & 2032
- Figure 76: Middle East and Africa Breast Implants Market Volume (K Unit), by Application 2024 & 2032
- Figure 77: Middle East and Africa Breast Implants Market Revenue Share (%), by Application 2024 & 2032
- Figure 78: Middle East and Africa Breast Implants Market Volume Share (%), by Application 2024 & 2032
- Figure 79: Middle East and Africa Breast Implants Market Revenue (Million), by End-user 2024 & 2032
- Figure 80: Middle East and Africa Breast Implants Market Volume (K Unit), by End-user 2024 & 2032
- Figure 81: Middle East and Africa Breast Implants Market Revenue Share (%), by End-user 2024 & 2032
- Figure 82: Middle East and Africa Breast Implants Market Volume Share (%), by End-user 2024 & 2032
- Figure 83: Middle East and Africa Breast Implants Market Revenue (Million), by Country 2024 & 2032
- Figure 84: Middle East and Africa Breast Implants Market Volume (K Unit), by Country 2024 & 2032
- Figure 85: Middle East and Africa Breast Implants Market Revenue Share (%), by Country 2024 & 2032
- Figure 86: Middle East and Africa Breast Implants Market Volume Share (%), by Country 2024 & 2032
- Figure 87: South America Breast Implants Market Revenue (Million), by Type 2024 & 2032
- Figure 88: South America Breast Implants Market Volume (K Unit), by Type 2024 & 2032
- Figure 89: South America Breast Implants Market Revenue Share (%), by Type 2024 & 2032
- Figure 90: South America Breast Implants Market Volume Share (%), by Type 2024 & 2032
- Figure 91: South America Breast Implants Market Revenue (Million), by Application 2024 & 2032
- Figure 92: South America Breast Implants Market Volume (K Unit), by Application 2024 & 2032
- Figure 93: South America Breast Implants Market Revenue Share (%), by Application 2024 & 2032
- Figure 94: South America Breast Implants Market Volume Share (%), by Application 2024 & 2032
- Figure 95: South America Breast Implants Market Revenue (Million), by End-user 2024 & 2032
- Figure 96: South America Breast Implants Market Volume (K Unit), by End-user 2024 & 2032
- Figure 97: South America Breast Implants Market Revenue Share (%), by End-user 2024 & 2032
- Figure 98: South America Breast Implants Market Volume Share (%), by End-user 2024 & 2032
- Figure 99: South America Breast Implants Market Revenue (Million), by Country 2024 & 2032
- Figure 100: South America Breast Implants Market Volume (K Unit), by Country 2024 & 2032
- Figure 101: South America Breast Implants Market Revenue Share (%), by Country 2024 & 2032
- Figure 102: South America Breast Implants Market Volume Share (%), by Country 2024 & 2032
List of Tables
- Table 1: Global Breast Implants Market Revenue Million Forecast, by Region 2019 & 2032
- Table 2: Global Breast Implants Market Volume K Unit Forecast, by Region 2019 & 2032
- Table 3: Global Breast Implants Market Revenue Million Forecast, by Type 2019 & 2032
- Table 4: Global Breast Implants Market Volume K Unit Forecast, by Type 2019 & 2032
- Table 5: Global Breast Implants Market Revenue Million Forecast, by Application 2019 & 2032
- Table 6: Global Breast Implants Market Volume K Unit Forecast, by Application 2019 & 2032
- Table 7: Global Breast Implants Market Revenue Million Forecast, by End-user 2019 & 2032
- Table 8: Global Breast Implants Market Volume K Unit Forecast, by End-user 2019 & 2032
- Table 9: Global Breast Implants Market Revenue Million Forecast, by Region 2019 & 2032
- Table 10: Global Breast Implants Market Volume K Unit Forecast, by Region 2019 & 2032
- Table 11: Global Breast Implants Market Revenue Million Forecast, by Country 2019 & 2032
- Table 12: Global Breast Implants Market Volume K Unit Forecast, by Country 2019 & 2032
- Table 13: United States Breast Implants Market Revenue (Million) Forecast, by Application 2019 & 2032
- Table 14: United States Breast Implants Market Volume (K Unit) Forecast, by Application 2019 & 2032
- Table 15: Canada Breast Implants Market Revenue (Million) Forecast, by Application 2019 & 2032
- Table 16: Canada Breast Implants Market Volume (K Unit) Forecast, by Application 2019 & 2032
- Table 17: Mexico Breast Implants Market Revenue (Million) Forecast, by Application 2019 & 2032
- Table 18: Mexico Breast Implants Market Volume (K Unit) Forecast, by Application 2019 & 2032
- Table 19: Global Breast Implants Market Revenue Million Forecast, by Country 2019 & 2032
- Table 20: Global Breast Implants Market Volume K Unit Forecast, by Country 2019 & 2032
- Table 21: Germany Breast Implants Market Revenue (Million) Forecast, by Application 2019 & 2032
- Table 22: Germany Breast Implants Market Volume (K Unit) Forecast, by Application 2019 & 2032
- Table 23: United Kingdom Breast Implants Market Revenue (Million) Forecast, by Application 2019 & 2032
- Table 24: United Kingdom Breast Implants Market Volume (K Unit) Forecast, by Application 2019 & 2032
- Table 25: France Breast Implants Market Revenue (Million) Forecast, by Application 2019 & 2032
- Table 26: France Breast Implants Market Volume (K Unit) Forecast, by Application 2019 & 2032
- Table 27: Italy Breast Implants Market Revenue (Million) Forecast, by Application 2019 & 2032
- Table 28: Italy Breast Implants Market Volume (K Unit) Forecast, by Application 2019 & 2032
- Table 29: Spain Breast Implants Market Revenue (Million) Forecast, by Application 2019 & 2032
- Table 30: Spain Breast Implants Market Volume (K Unit) Forecast, by Application 2019 & 2032
- Table 31: Rest of Europe Breast Implants Market Revenue (Million) Forecast, by Application 2019 & 2032
- Table 32: Rest of Europe Breast Implants Market Volume (K Unit) Forecast, by Application 2019 & 2032
- Table 33: Global Breast Implants Market Revenue Million Forecast, by Country 2019 & 2032
- Table 34: Global Breast Implants Market Volume K Unit Forecast, by Country 2019 & 2032
- Table 35: China Breast Implants Market Revenue (Million) Forecast, by Application 2019 & 2032
- Table 36: China Breast Implants Market Volume (K Unit) Forecast, by Application 2019 & 2032
- Table 37: Japan Breast Implants Market Revenue (Million) Forecast, by Application 2019 & 2032
- Table 38: Japan Breast Implants Market Volume (K Unit) Forecast, by Application 2019 & 2032
- Table 39: India Breast Implants Market Revenue (Million) Forecast, by Application 2019 & 2032
- Table 40: India Breast Implants Market Volume (K Unit) Forecast, by Application 2019 & 2032
- Table 41: Australia Breast Implants Market Revenue (Million) Forecast, by Application 2019 & 2032
- Table 42: Australia Breast Implants Market Volume (K Unit) Forecast, by Application 2019 & 2032
- Table 43: South Korea Breast Implants Market Revenue (Million) Forecast, by Application 2019 & 2032
- Table 44: South Korea Breast Implants Market Volume (K Unit) Forecast, by Application 2019 & 2032
- Table 45: Rest of Asia Pacific Breast Implants Market Revenue (Million) Forecast, by Application 2019 & 2032
- Table 46: Rest of Asia Pacific Breast Implants Market Volume (K Unit) Forecast, by Application 2019 & 2032
- Table 47: Global Breast Implants Market Revenue Million Forecast, by Country 2019 & 2032
- Table 48: Global Breast Implants Market Volume K Unit Forecast, by Country 2019 & 2032
- Table 49: GCC Breast Implants Market Revenue (Million) Forecast, by Application 2019 & 2032
- Table 50: GCC Breast Implants Market Volume (K Unit) Forecast, by Application 2019 & 2032
- Table 51: South Africa Breast Implants Market Revenue (Million) Forecast, by Application 2019 & 2032
- Table 52: South Africa Breast Implants Market Volume (K Unit) Forecast, by Application 2019 & 2032
- Table 53: Rest of Middle East and Africa Breast Implants Market Revenue (Million) Forecast, by Application 2019 & 2032
- Table 54: Rest of Middle East and Africa Breast Implants Market Volume (K Unit) Forecast, by Application 2019 & 2032
- Table 55: Global Breast Implants Market Revenue Million Forecast, by Country 2019 & 2032
- Table 56: Global Breast Implants Market Volume K Unit Forecast, by Country 2019 & 2032
- Table 57: Brazil Breast Implants Market Revenue (Million) Forecast, by Application 2019 & 2032
- Table 58: Brazil Breast Implants Market Volume (K Unit) Forecast, by Application 2019 & 2032
- Table 59: Argentina Breast Implants Market Revenue (Million) Forecast, by Application 2019 & 2032
- Table 60: Argentina Breast Implants Market Volume (K Unit) Forecast, by Application 2019 & 2032
- Table 61: Rest of South America Breast Implants Market Revenue (Million) Forecast, by Application 2019 & 2032
- Table 62: Rest of South America Breast Implants Market Volume (K Unit) Forecast, by Application 2019 & 2032
- Table 63: Global Breast Implants Market Revenue Million Forecast, by Type 2019 & 2032
- Table 64: Global Breast Implants Market Volume K Unit Forecast, by Type 2019 & 2032
- Table 65: Global Breast Implants Market Revenue Million Forecast, by Application 2019 & 2032
- Table 66: Global Breast Implants Market Volume K Unit Forecast, by Application 2019 & 2032
- Table 67: Global Breast Implants Market Revenue Million Forecast, by End-user 2019 & 2032
- Table 68: Global Breast Implants Market Volume K Unit Forecast, by End-user 2019 & 2032
- Table 69: Global Breast Implants Market Revenue Million Forecast, by Country 2019 & 2032
- Table 70: Global Breast Implants Market Volume K Unit Forecast, by Country 2019 & 2032
- Table 71: United States Breast Implants Market Revenue (Million) Forecast, by Application 2019 & 2032
- Table 72: United States Breast Implants Market Volume (K Unit) Forecast, by Application 2019 & 2032
- Table 73: Canada Breast Implants Market Revenue (Million) Forecast, by Application 2019 & 2032
- Table 74: Canada Breast Implants Market Volume (K Unit) Forecast, by Application 2019 & 2032
- Table 75: Mexico Breast Implants Market Revenue (Million) Forecast, by Application 2019 & 2032
- Table 76: Mexico Breast Implants Market Volume (K Unit) Forecast, by Application 2019 & 2032
- Table 77: Global Breast Implants Market Revenue Million Forecast, by Type 2019 & 2032
- Table 78: Global Breast Implants Market Volume K Unit Forecast, by Type 2019 & 2032
- Table 79: Global Breast Implants Market Revenue Million Forecast, by Application 2019 & 2032
- Table 80: Global Breast Implants Market Volume K Unit Forecast, by Application 2019 & 2032
- Table 81: Global Breast Implants Market Revenue Million Forecast, by End-user 2019 & 2032
- Table 82: Global Breast Implants Market Volume K Unit Forecast, by End-user 2019 & 2032
- Table 83: Global Breast Implants Market Revenue Million Forecast, by Country 2019 & 2032
- Table 84: Global Breast Implants Market Volume K Unit Forecast, by Country 2019 & 2032
- Table 85: Germany Breast Implants Market Revenue (Million) Forecast, by Application 2019 & 2032
- Table 86: Germany Breast Implants Market Volume (K Unit) Forecast, by Application 2019 & 2032
- Table 87: United Kingdom Breast Implants Market Revenue (Million) Forecast, by Application 2019 & 2032
- Table 88: United Kingdom Breast Implants Market Volume (K Unit) Forecast, by Application 2019 & 2032
- Table 89: France Breast Implants Market Revenue (Million) Forecast, by Application 2019 & 2032
- Table 90: France Breast Implants Market Volume (K Unit) Forecast, by Application 2019 & 2032
- Table 91: Italy Breast Implants Market Revenue (Million) Forecast, by Application 2019 & 2032
- Table 92: Italy Breast Implants Market Volume (K Unit) Forecast, by Application 2019 & 2032
- Table 93: Spain Breast Implants Market Revenue (Million) Forecast, by Application 2019 & 2032
- Table 94: Spain Breast Implants Market Volume (K Unit) Forecast, by Application 2019 & 2032
- Table 95: Rest of Europe Breast Implants Market Revenue (Million) Forecast, by Application 2019 & 2032
- Table 96: Rest of Europe Breast Implants Market Volume (K Unit) Forecast, by Application 2019 & 2032
- Table 97: Global Breast Implants Market Revenue Million Forecast, by Type 2019 & 2032
- Table 98: Global Breast Implants Market Volume K Unit Forecast, by Type 2019 & 2032
- Table 99: Global Breast Implants Market Revenue Million Forecast, by Application 2019 & 2032
- Table 100: Global Breast Implants Market Volume K Unit Forecast, by Application 2019 & 2032
- Table 101: Global Breast Implants Market Revenue Million Forecast, by End-user 2019 & 2032
- Table 102: Global Breast Implants Market Volume K Unit Forecast, by End-user 2019 & 2032
- Table 103: Global Breast Implants Market Revenue Million Forecast, by Country 2019 & 2032
- Table 104: Global Breast Implants Market Volume K Unit Forecast, by Country 2019 & 2032
- Table 105: China Breast Implants Market Revenue (Million) Forecast, by Application 2019 & 2032
- Table 106: China Breast Implants Market Volume (K Unit) Forecast, by Application 2019 & 2032
- Table 107: Japan Breast Implants Market Revenue (Million) Forecast, by Application 2019 & 2032
- Table 108: Japan Breast Implants Market Volume (K Unit) Forecast, by Application 2019 & 2032
- Table 109: India Breast Implants Market Revenue (Million) Forecast, by Application 2019 & 2032
- Table 110: India Breast Implants Market Volume (K Unit) Forecast, by Application 2019 & 2032
- Table 111: Australia Breast Implants Market Revenue (Million) Forecast, by Application 2019 & 2032
- Table 112: Australia Breast Implants Market Volume (K Unit) Forecast, by Application 2019 & 2032
- Table 113: South Korea Breast Implants Market Revenue (Million) Forecast, by Application 2019 & 2032
- Table 114: South Korea Breast Implants Market Volume (K Unit) Forecast, by Application 2019 & 2032
- Table 115: Rest of Asia Pacific Breast Implants Market Revenue (Million) Forecast, by Application 2019 & 2032
- Table 116: Rest of Asia Pacific Breast Implants Market Volume (K Unit) Forecast, by Application 2019 & 2032
- Table 117: Global Breast Implants Market Revenue Million Forecast, by Type 2019 & 2032
- Table 118: Global Breast Implants Market Volume K Unit Forecast, by Type 2019 & 2032
- Table 119: Global Breast Implants Market Revenue Million Forecast, by Application 2019 & 2032
- Table 120: Global Breast Implants Market Volume K Unit Forecast, by Application 2019 & 2032
- Table 121: Global Breast Implants Market Revenue Million Forecast, by End-user 2019 & 2032
- Table 122: Global Breast Implants Market Volume K Unit Forecast, by End-user 2019 & 2032
- Table 123: Global Breast Implants Market Revenue Million Forecast, by Country 2019 & 2032
- Table 124: Global Breast Implants Market Volume K Unit Forecast, by Country 2019 & 2032
- Table 125: GCC Breast Implants Market Revenue (Million) Forecast, by Application 2019 & 2032
- Table 126: GCC Breast Implants Market Volume (K Unit) Forecast, by Application 2019 & 2032
- Table 127: South Africa Breast Implants Market Revenue (Million) Forecast, by Application 2019 & 2032
- Table 128: South Africa Breast Implants Market Volume (K Unit) Forecast, by Application 2019 & 2032
- Table 129: Rest of Middle East and Africa Breast Implants Market Revenue (Million) Forecast, by Application 2019 & 2032
- Table 130: Rest of Middle East and Africa Breast Implants Market Volume (K Unit) Forecast, by Application 2019 & 2032
- Table 131: Global Breast Implants Market Revenue Million Forecast, by Type 2019 & 2032
- Table 132: Global Breast Implants Market Volume K Unit Forecast, by Type 2019 & 2032
- Table 133: Global Breast Implants Market Revenue Million Forecast, by Application 2019 & 2032
- Table 134: Global Breast Implants Market Volume K Unit Forecast, by Application 2019 & 2032
- Table 135: Global Breast Implants Market Revenue Million Forecast, by End-user 2019 & 2032
- Table 136: Global Breast Implants Market Volume K Unit Forecast, by End-user 2019 & 2032
- Table 137: Global Breast Implants Market Revenue Million Forecast, by Country 2019 & 2032
- Table 138: Global Breast Implants Market Volume K Unit Forecast, by Country 2019 & 2032
- Table 139: Brazil Breast Implants Market Revenue (Million) Forecast, by Application 2019 & 2032
- Table 140: Brazil Breast Implants Market Volume (K Unit) Forecast, by Application 2019 & 2032
- Table 141: Argentina Breast Implants Market Revenue (Million) Forecast, by Application 2019 & 2032
- Table 142: Argentina Breast Implants Market Volume (K Unit) Forecast, by Application 2019 & 2032
- Table 143: Rest of South America Breast Implants Market Revenue (Million) Forecast, by Application 2019 & 2032
- Table 144: Rest of South America Breast Implants Market Volume (K Unit) Forecast, by Application 2019 & 2032
Frequently Asked Questions
1. What is the projected Compound Annual Growth Rate (CAGR) of the Breast Implants Market?
The projected CAGR is approximately 7.77%.
2. Which companies are prominent players in the Breast Implants Market?
Key companies in the market include AbbVie Inc (Allergan PLC), Silimed, Sientra Inc, HansBioMed, Cereplas, Establishment Labs SA, Polytech Health & Aesthetics GmbH, Laboratories Arion, Johnson & Johnson (Mentor Worldwide LLC ), Groupe Sebbin SAS, GC Aesthetics.
3. What are the main segments of the Breast Implants Market?
The market segments include Type, Application, End-user.
4. Can you provide details about the market size?
The market size is estimated to be USD 2.05 Million as of 2022.
5. What are some drivers contributing to market growth?
Rising Incidence of Breast Cancer; Increasing Number of Breast Augmentation Procedures; Technological Advancements.
6. What are the notable trends driving market growth?
Silicone Implant is Expected to Hold a Major Share in the Market Over the Forecast Period.
7. Are there any restraints impacting market growth?
Post Complications and Risks Associated with Breast Implants; High Cost of Breast Implants.
8. Can you provide examples of recent developments in the market?
In April 2024, GC Aesthetics introduced the LUNA XT, a micro-textured anatomical breast implant, marking one of the pioneering European Medical Device Regulation (MDR)-approved products in its category.
9. What pricing options are available for accessing the report?
Pricing options include single-user, multi-user, and enterprise licenses priced at USD 4750, USD 5250, and USD 8750 respectively.
10. Is the market size provided in terms of value or volume?
The market size is provided in terms of value, measured in Million and volume, measured in K Unit.
11. Are there any specific market keywords associated with the report?
Yes, the market keyword associated with the report is "Breast Implants Market," which aids in identifying and referencing the specific market segment covered.
12. How do I determine which pricing option suits my needs best?
The pricing options vary based on user requirements and access needs. Individual users may opt for single-user licenses, while businesses requiring broader access may choose multi-user or enterprise licenses for cost-effective access to the report.
13. Are there any additional resources or data provided in the Breast Implants Market report?
While the report offers comprehensive insights, it's advisable to review the specific contents or supplementary materials provided to ascertain if additional resources or data are available.
14. How can I stay updated on further developments or reports in the Breast Implants Market?
To stay informed about further developments, trends, and reports in the Breast Implants Market, consider subscribing to industry newsletters, following relevant companies and organizations, or regularly checking reputable industry news sources and publications.
Methodology
Step 1 - Identification of Relevant Samples Size from Population Database


Step 2 - Approaches for Defining Global Market Size (Value, Volume* & Price*)

Note*: In applicable scenarios
Step 3 - Data Sources
Primary Research
- Web Analytics
- Survey Reports
- Research Institute
- Latest Research Reports
- Opinion Leaders
Secondary Research
- Annual Reports
- White Paper
- Latest Press Release
- Industry Association
- Paid Database
- Investor Presentations

Step 4 - Data Triangulation
Involves using different sources of information in order to increase the validity of a study
These sources are likely to be stakeholders in a program - participants, other researchers, program staff, other community members, and so on.
Then we put all data in single framework & apply various statistical tools to find out the dynamic on the market.
During the analysis stage, feedback from the stakeholder groups would be compared to determine areas of agreement as well as areas of divergence


