

Key Insights
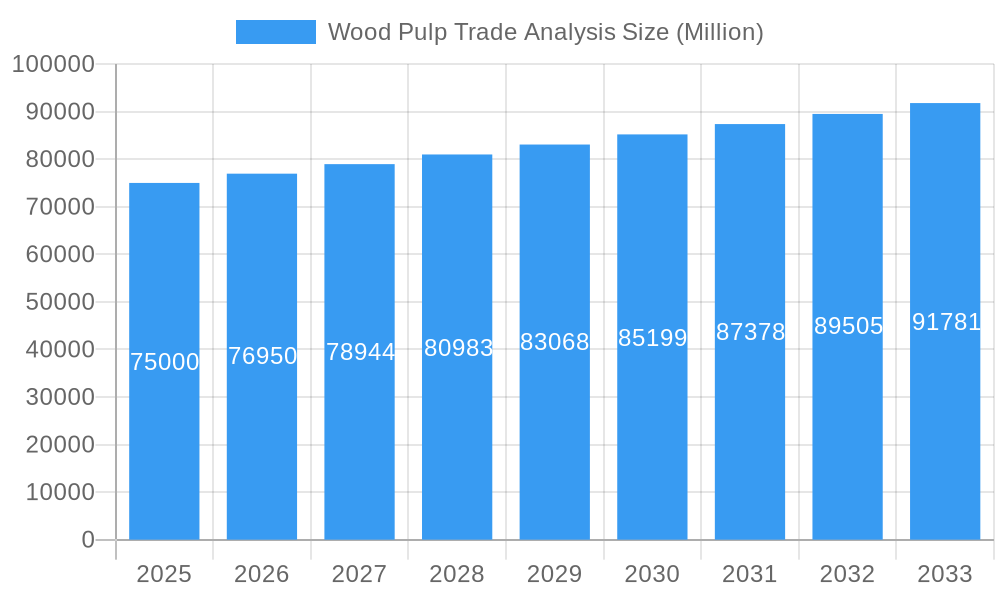
The global wood pulp trade is forecast for consistent expansion, reaching an estimated market size of $166.65 billion in 2025 and projected to grow at a Compound Annual Growth Rate (CAGR) of 2.7% through 2033. This growth is driven by escalating demand from key sectors including packaging, hygiene products, and printing and writing papers. The rapidly expanding e-commerce landscape significantly boosts the need for corrugated packaging, a major wood pulp derivative. Furthermore, rising disposable incomes in emerging economies, particularly in the Asia Pacific, are increasing consumption of paper-based products. Innovations in sustainable and efficient pulp production also support market dynamics.
Wood Pulp Trade Analysis Market Size (In Billion)
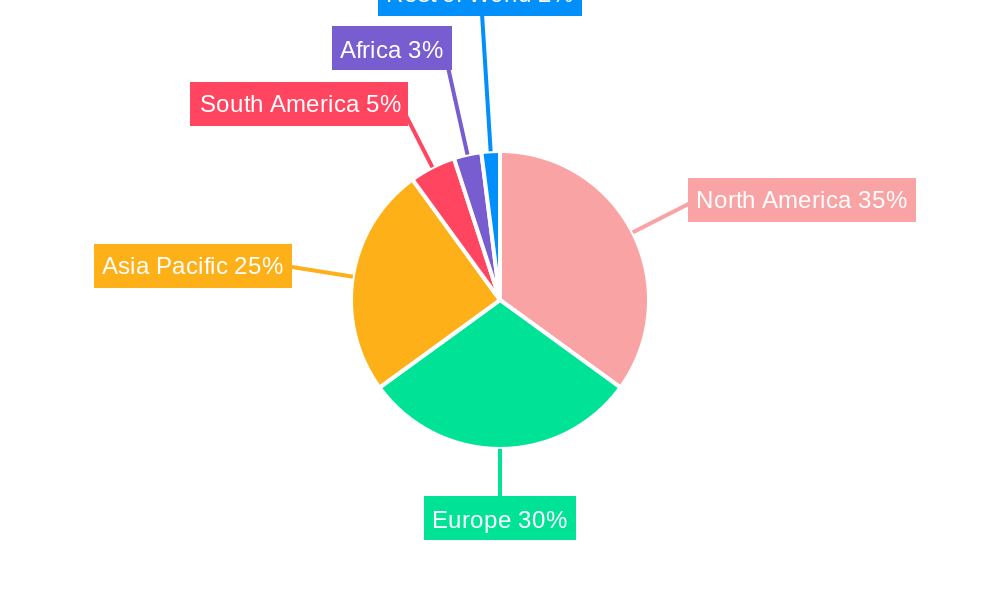
Challenges to the wood pulp trade include increasing operational expenses, stringent environmental regulations, geopolitical instability, and currency fluctuations. A significant market trend is the growing preference for unbleached and recycled pulp due to increasing environmental consciousness. North America and Europe are expected to lead in both production and consumption, while Asia Pacific is anticipated to experience the most rapid growth. Major companies are investing in capacity and sustainable sourcing to maintain market positions.
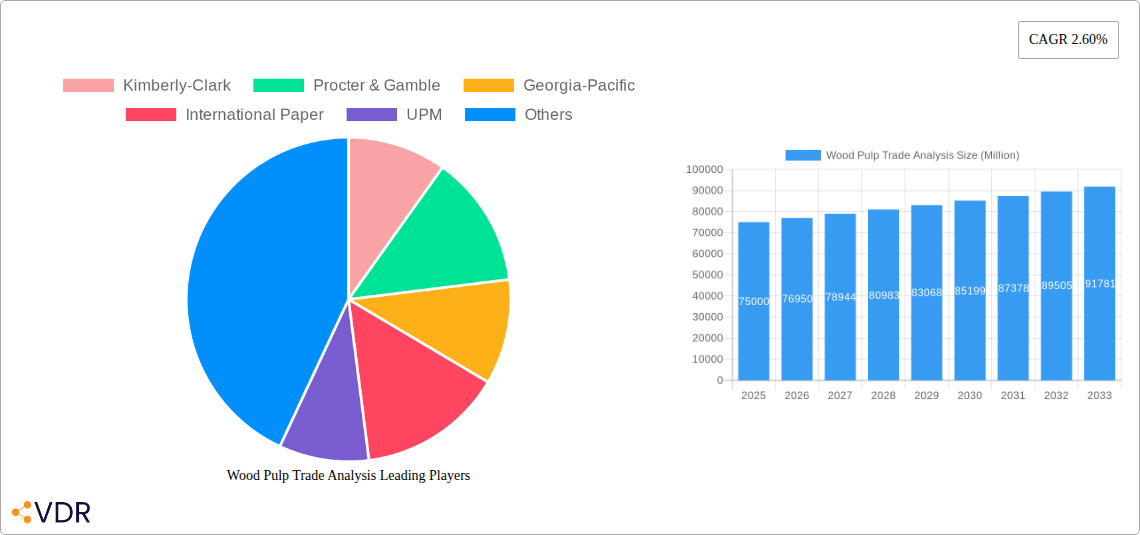
Wood Pulp Trade Analysis Company Market Share
This comprehensive report offers a detailed analysis of the global wood pulp trade market. The study covers the period from 2019 to 2033, with 2025 serving as the base and estimated year. Analyzing historical data from 2019-2024 and projecting future trends to 2033 provides crucial insights for stakeholders in the pulp and paper industry. The report meticulously examines parent market and child market dynamics, delivering actionable intelligence for strategic planning. All data is presented in billions for clarity.
Wood Pulp Trade Analysis Market Dynamics & Structure
The wood pulp market exhibits a moderately concentrated structure, influenced by significant players like Kimberly-Clark, Procter & Gamble, Georgia-Pacific, International Paper, and UPM, which collectively hold substantial market share. Technological innovation acts as a key driver, particularly in improving pulping efficiency and developing sustainable forestry practices. However, innovation is sometimes hindered by the high capital investment required for advanced technologies and the long gestation periods for research and development. Regulatory frameworks, including environmental protection laws and international trade agreements, significantly shape market access and production standards. Competitive product substitutes, such as recycled paper and alternative fiber sources, exert pressure on virgin wood pulp demand. End-user demographics are shifting, with growing demand for packaging materials driven by e-commerce and a decline in printing and writing paper consumption due to digitization. Mergers and acquisitions (M&A) are observed as a strategic tool for market consolidation and portfolio expansion, with a notable volume of deals in recent years aimed at securing supply chains and enhancing market reach. For instance, recent M&A activity indicates a trend towards vertical integration and increased operational scale.
- Market Concentration: Moderately concentrated with key players holding significant share.
- Technological Drivers: Efficiency improvements, sustainable forestry, bio-based pulp innovations.
- Regulatory Impact: Environmental standards, trade policies, and sustainability mandates.
- Substitute Competition: Recycled pulp, agricultural fibers, and synthetic alternatives.
- End-User Shifts: Declining NP/PWP, growing PP demand.
- M&A Trends: Consolidation, vertical integration, supply chain security, an estimated XX M&A deals in the historical period.
Wood Pulp Trade Analysis Growth Trends & Insights
The global wood pulp trade market is poised for robust expansion, driven by evolving consumer preferences and the increasing demand for sustainable packaging solutions. The market size is projected to witness a Compound Annual Growth Rate (CAGR) of approximately XX% during the forecast period. This growth is underpinned by rising adoption rates of innovative wood pulp-based products in diverse applications, ranging from hygiene products to advanced composite materials. Technological disruptions, such as advancements in chemical pulping processes and the development of high-yield pulping methods, are enhancing production efficiency and reducing environmental footprints. Consumer behavior shifts are profoundly impacting the market; the burgeoning e-commerce sector fuels an insatiable demand for packaging paper, a key child market for wood pulp. Conversely, the pervasive influence of digitization continues to dampen demand for traditional newsprint and printing writing papers, highlighting a significant paradigm shift in consumption patterns. The market penetration of specialty wood pulp grades, designed for specific high-performance applications, is also on the rise. The total market size is estimated to reach $XXX Billion by 2033, up from an estimated $XXX Billion in 2025.
- Market Size Evolution: Projected CAGR of XX% from 2025-2033, reaching an estimated $XXX Billion by 2033.
- Adoption Rates: Increasing adoption of sustainable wood pulp products and advanced packaging.
- Technological Disruptions: Innovations in pulping, bio-refining, and fiber treatment.
- Consumer Behavior Shifts: Transition from PWP to PP driven by e-commerce and digitalization.
- Market Penetration: Growing penetration of specialty pulp grades for niche applications.
Dominant Regions, Countries, or Segments in Wood Pulp Trade Analysis
The production analysis of wood pulp is largely dominated by regions with abundant forest resources and established pulp and paper industries. North America, particularly the United States and Canada, along with Nordic countries like Sweden and Finland, are leading global producers, accounting for approximately XX% of the total global production. This dominance is attributed to extensive coniferous and deciduous forests, advanced forestry management practices, and significant investments in pulp manufacturing infrastructure.
In terms of consumption analysis, Asia-Pacific, led by China, is emerging as the largest consuming region, driven by its massive manufacturing base and a rapidly growing middle class. The region accounts for nearly XX% of global wood pulp consumption. This surge is primarily fueled by the escalating demand for packaging paper, a critical child market, to support the booming e-commerce and FMCG sectors.
The import market analysis (value & volume) is also significantly influenced by the Asia-Pacific region, particularly China and India, which rely heavily on imports to meet their burgeoning demand for various wood pulp grades. The value of global wood pulp imports is estimated at $XX Billion in 2025, with Asia-Pacific representing XX% of this value. The volume of imports is projected to reach XXX Million tons in 2025.
Conversely, the export market analysis (value & volume) is dominated by established pulp-producing nations in North America and Europe. These regions export substantial volumes of softwood and hardwood pulp to meet global demand. The value of global wood pulp exports is estimated at $XX Billion in 2025, with North America contributing XX% and Europe contributing XX%. The projected export volume stands at XXX Million tons for 2025.
The price trend analysis indicates a dynamic market influenced by supply-demand imbalances, raw material costs, and geopolitical factors. Historically, prices have fluctuated, with an average annual increase of XX% observed during the historical period. The packaging paper (PP) segment is the primary driver of growth within the child market spectrum, outperforming the declining newsprint papers (NP) and printing writing papers (PWP) segments.
- Production Dominance: North America (XX%) and Europe (XX%) due to vast forest resources and advanced infrastructure.
- Consumption Leadership: Asia-Pacific (XX%) driven by manufacturing and e-commerce growth.
- Import Hubs: China and India in Asia-Pacific, reflecting their substantial demand.
- Export Powerhouses: North America and Europe, supplying global markets.
- Segment Growth Driver: Packaging Paper (PP) segment experiencing significant expansion.
Wood Pulp Trade Analysis Product Landscape
The wood pulp trade encompasses a variety of product types crucial for diverse industrial applications. Key products include bleached and unbleached softwood kraft pulp, hardwood kraft pulp, and mechanical pulp. Softwood pulp is prized for its long fibers, providing strength and durability for paper and board production, while hardwood pulp offers brightness and smoothness for fine papers. Innovations are continuously enhancing pulp performance, leading to the development of specialized grades such as fluff pulp for absorbent hygiene products and high-purity dissolving pulp for rayon and cellulose derivatives. The application landscape is broad, spanning from essential printing and writing papers to high-strength packaging boards, tissue products, and bio-based materials, showcasing the versatility and critical role of wood pulp in the modern economy.
Key Drivers, Barriers & Challenges in Wood Pulp Trade Analysis
The wood pulp trade market is propelled by several key drivers. The escalating global demand for sustainable packaging solutions, fueled by the rise of e-commerce and increasing environmental awareness, is a primary growth catalyst. Advancements in pulping technologies leading to improved efficiency and reduced environmental impact also play a crucial role. Furthermore, the growing demand for tissue and hygiene products in emerging economies represents a significant opportunity.
However, the market faces several barriers and challenges. Fluctuations in raw material costs, particularly timber prices, can significantly impact profitability. Stringent environmental regulations and evolving sustainability standards necessitate continuous investment in greener technologies and practices. Supply chain disruptions, such as logistical bottlenecks and geopolitical instability, can hinder trade flows and increase costs. Intense competition from recycled fiber and other alternative materials also poses a challenge.
- Key Drivers:
- Rising demand for sustainable packaging.
- Technological advancements in pulping.
- Growth in tissue and hygiene products.
- Key Barriers & Challenges:
- Volatile raw material costs.
- Strict environmental regulations.
- Supply chain disruptions.
- Competition from recycled fiber.
Emerging Opportunities in Wood Pulp Trade Analysis
Emerging opportunities in the wood pulp trade lie in the expanding market for biodegradable and compostable packaging materials, where wood pulp can be a key component. The development of advanced bio-based materials and composites utilizing wood pulp fibers presents a significant untapped market. Furthermore, the increasing global focus on circular economy principles creates opportunities for companies that can efficiently integrate recycled pulp with virgin pulp production. The growing demand for specialty pulp grades in niche applications, such as in the textile and pharmaceutical industries, also offers promising avenues for growth.
Growth Accelerators in the Wood Pulp Trade Analysis Industry
Long-term growth in the wood pulp trade industry is being accelerated by several factors. Breakthroughs in bio-refining technologies are enabling the extraction of higher-value co-products from wood pulp processing, diversifying revenue streams and enhancing sustainability. Strategic partnerships between pulp producers, packaging manufacturers, and end-users are fostering innovation and market penetration for new products. Furthermore, market expansion strategies focusing on emerging economies with growing disposable incomes and increasing demand for consumer goods are crucial growth accelerators.
Key Players Shaping the Wood Pulp Trade Analysis Market
- Kimberly-Clark
- Procter & Gamble
- Georgia-Pacific
- International Paper
- UPM
Notable Milestones in Wood Pulp Trade Analysis Sector
- December 2022: The Indian Institute of Technology (IIT) Roorkee, in association with Shah Paper Mills Limited, launched a new project to develop the advanced packaging research laboratory and skill development program at the Department of Paper Technology, Saharanpur Campus. The institute has been fostering collaboration with paper industries from India, focusing on providing cutting-edge innovation research and skill development globally, enhancing the R&D landscape for packaging.
- April 2022: According to the Investment Information and Credit Rating Agency of India Limited (ICRA), the paper industry in India is going through a paradigm shift from a demand perspective. Demand for newsprint papers (NP) and printing writing papers (PWP) is declining, and the impact of digitization is becoming more pronounced. In contrast, the packaging paper (PP) segment is growing, with rising demand for packaging from e-commerce, food and food products, FMCG, and the pharmaceutical sector, signifying a significant market restructuring.
In-Depth Wood Pulp Trade Analysis Market Outlook
The wood pulp trade market outlook is decidedly optimistic, with growth accelerators such as innovation in biodegradable materials and the expanding circular economy paving the way for a sustainable future. Strategic opportunities abound in catering to the burgeoning demand for advanced packaging solutions and specialty pulp grades in developing economies. The industry's ability to adapt to evolving consumer preferences and leverage technological advancements will be key to unlocking its full potential and ensuring sustained growth in the coming years.
Wood Pulp Trade Analysis Segmentation
- 1. Production Analysis
- 2. Consumption Analysis
- 3. Import Market Analysis (Value & Volume)
- 4. Export Market Analysis (Value & Volume)
- 5. Price Trend Analysis
Wood Pulp Trade Analysis Segmentation By Geography
-
1. North America
- 1.1. United States
- 1.2. Canada
- 1.3. Mexico
-
2. Europe
- 2.1. Germany
- 2.2. United Kingdom
- 2.3. Italy
- 2.4. France
- 2.5. Netherlands
- 2.6. Sweden
- 2.7. Russia
-
3. Asia Pacific
- 3.1. China
- 3.2. Australia
- 3.3. India
- 3.4. South Korea
- 3.5. Japan
- 3.6. Indonesia
-
4. South America
- 4.1. Brazil
- 4.2. Chile
-
5. Africa
- 5.1. South Africa
Wood Pulp Trade Analysis Regional Market Share
Geographic Coverage of Wood Pulp Trade Analysis
Wood Pulp Trade Analysis REPORT HIGHLIGHTS
| Aspects | Details |
|---|---|
| Study Period | 2020-2034 |
| Base Year | 2025 |
| Estimated Year | 2026 |
| Forecast Period | 2026-2034 |
| Historical Period | 2020-2025 |
| Growth Rate | CAGR of 2.7% from 2020-2034 |
| Segmentation |
|
Table of Contents
- 1. Introduction
- 1.1. Research Scope
- 1.2. Market Segmentation
- 1.3. Research Objective
- 1.4. Definitions and Assumptions
- 2. Executive Summary
- 2.1. Market Snapshot
- 3. Market Dynamics
- 3.1. Market Drivers
- 3.2. Market Restrains
- 3.3. Market Trends
- 3.4. Market Opportunities
- 4. Market Factor Analysis
- 4.1. Porters Five Forces
- 4.1.1. Bargaining Power of Suppliers
- 4.1.2. Bargaining Power of Buyers
- 4.1.3. Threat of New Entrants
- 4.1.4. Threat of Substitutes
- 4.1.5. Competitive Rivalry
- 4.2. PESTEL analysis
- 4.3. BCG Analysis
- 4.3.1. Stars (High Growth, High Market Share)
- 4.3.2. Cash Cows (Low Growth, High Market Share)
- 4.3.3. Question Mark (High Growth, Low Market Share)
- 4.3.4. Dogs (Low Growth, Low Market Share)
- 4.4. Ansoff Matrix Analysis
- 4.5. Supply Chain Analysis
- 4.6. Regulatory Landscape
- 4.7. Current Market Potential and Opportunity Assessment (TAM–SAM–SOM Framework)
- 4.8. VDR Analyst Note
- 4.1. Porters Five Forces
- 5. Market Analysis, Insights and Forecast 2021-2033
- 5.1. Market Analysis, Insights and Forecast - by Production Analysis
- 5.2. Market Analysis, Insights and Forecast - by Consumption Analysis
- 5.3. Market Analysis, Insights and Forecast - by Import Market Analysis (Value & Volume)
- 5.4. Market Analysis, Insights and Forecast - by Export Market Analysis (Value & Volume)
- 5.5. Market Analysis, Insights and Forecast - by Price Trend Analysis
- 5.6. Market Analysis, Insights and Forecast - by Region
- 5.6.1. North America
- 5.6.2. Europe
- 5.6.3. Asia Pacific
- 5.6.4. South America
- 5.6.5. Africa
- 6. Global Wood Pulp Trade Analysis Analysis, Insights and Forecast, 2021-2033
- 6.1. Market Analysis, Insights and Forecast - by Production Analysis
- 6.2. Market Analysis, Insights and Forecast - by Consumption Analysis
- 6.3. Market Analysis, Insights and Forecast - by Import Market Analysis (Value & Volume)
- 6.4. Market Analysis, Insights and Forecast - by Export Market Analysis (Value & Volume)
- 6.5. Market Analysis, Insights and Forecast - by Price Trend Analysis
- 7. North America Wood Pulp Trade Analysis Analysis, Insights and Forecast, 2021-2033
- 7.1. Market Analysis, Insights and Forecast - by Production Analysis
- 7.2. Market Analysis, Insights and Forecast - by Consumption Analysis
- 7.3. Market Analysis, Insights and Forecast - by Import Market Analysis (Value & Volume)
- 7.4. Market Analysis, Insights and Forecast - by Export Market Analysis (Value & Volume)
- 7.5. Market Analysis, Insights and Forecast - by Price Trend Analysis
- 8. Europe Wood Pulp Trade Analysis Analysis, Insights and Forecast, 2021-2033
- 8.1. Market Analysis, Insights and Forecast - by Production Analysis
- 8.2. Market Analysis, Insights and Forecast - by Consumption Analysis
- 8.3. Market Analysis, Insights and Forecast - by Import Market Analysis (Value & Volume)
- 8.4. Market Analysis, Insights and Forecast - by Export Market Analysis (Value & Volume)
- 8.5. Market Analysis, Insights and Forecast - by Price Trend Analysis
- 9. Asia Pacific Wood Pulp Trade Analysis Analysis, Insights and Forecast, 2021-2033
- 9.1. Market Analysis, Insights and Forecast - by Production Analysis
- 9.2. Market Analysis, Insights and Forecast - by Consumption Analysis
- 9.3. Market Analysis, Insights and Forecast - by Import Market Analysis (Value & Volume)
- 9.4. Market Analysis, Insights and Forecast - by Export Market Analysis (Value & Volume)
- 9.5. Market Analysis, Insights and Forecast - by Price Trend Analysis
- 10. South America Wood Pulp Trade Analysis Analysis, Insights and Forecast, 2021-2033
- 10.1. Market Analysis, Insights and Forecast - by Production Analysis
- 10.2. Market Analysis, Insights and Forecast - by Consumption Analysis
- 10.3. Market Analysis, Insights and Forecast - by Import Market Analysis (Value & Volume)
- 10.4. Market Analysis, Insights and Forecast - by Export Market Analysis (Value & Volume)
- 10.5. Market Analysis, Insights and Forecast - by Price Trend Analysis
- 11. Africa Wood Pulp Trade Analysis Analysis, Insights and Forecast, 2021-2033
- 11.1. Market Analysis, Insights and Forecast - by Production Analysis
- 11.2. Market Analysis, Insights and Forecast - by Consumption Analysis
- 11.3. Market Analysis, Insights and Forecast - by Import Market Analysis (Value & Volume)
- 11.4. Market Analysis, Insights and Forecast - by Export Market Analysis (Value & Volume)
- 11.5. Market Analysis, Insights and Forecast - by Price Trend Analysis
- 12. Competitive Analysis
- 12.1. Company Profiles
- 12.1.1 Kimberly-Clark
- 12.1.1.1. Company Overview
- 12.1.1.2. Products
- 12.1.1.3. Company Financials
- 12.1.1.4. SWOT Analysis
- 12.1.2 Procter & Gamble
- 12.1.2.1. Company Overview
- 12.1.2.2. Products
- 12.1.2.3. Company Financials
- 12.1.2.4. SWOT Analysis
- 12.1.3 Georgia-Pacific
- 12.1.3.1. Company Overview
- 12.1.3.2. Products
- 12.1.3.3. Company Financials
- 12.1.3.4. SWOT Analysis
- 12.1.4 International Paper
- 12.1.4.1. Company Overview
- 12.1.4.2. Products
- 12.1.4.3. Company Financials
- 12.1.4.4. SWOT Analysis
- 12.1.5 UPM
- 12.1.5.1. Company Overview
- 12.1.5.2. Products
- 12.1.5.3. Company Financials
- 12.1.5.4. SWOT Analysis
- 12.1.1 Kimberly-Clark
- 12.2. Market Entropy
- 12.2.1 Company's Key Areas Served
- 12.2.2 Recent Developments
- 12.3. Company Market Share Analysis 2025
- 12.3.1 Top 5 Companies Market Share Analysis
- 12.3.2 Top 3 Companies Market Share Analysis
- 12.4. List of Potential Customers
- 13. Research Methodology
List of Figures
- Figure 1: Global Wood Pulp Trade Analysis Revenue Breakdown (billion, %) by Region 2025 & 2033
- Figure 2: North America Wood Pulp Trade Analysis Revenue (billion), by Production Analysis 2025 & 2033
- Figure 3: North America Wood Pulp Trade Analysis Revenue Share (%), by Production Analysis 2025 & 2033
- Figure 4: North America Wood Pulp Trade Analysis Revenue (billion), by Consumption Analysis 2025 & 2033
- Figure 5: North America Wood Pulp Trade Analysis Revenue Share (%), by Consumption Analysis 2025 & 2033
- Figure 6: North America Wood Pulp Trade Analysis Revenue (billion), by Import Market Analysis (Value & Volume) 2025 & 2033
- Figure 7: North America Wood Pulp Trade Analysis Revenue Share (%), by Import Market Analysis (Value & Volume) 2025 & 2033
- Figure 8: North America Wood Pulp Trade Analysis Revenue (billion), by Export Market Analysis (Value & Volume) 2025 & 2033
- Figure 9: North America Wood Pulp Trade Analysis Revenue Share (%), by Export Market Analysis (Value & Volume) 2025 & 2033
- Figure 10: North America Wood Pulp Trade Analysis Revenue (billion), by Price Trend Analysis 2025 & 2033
- Figure 11: North America Wood Pulp Trade Analysis Revenue Share (%), by Price Trend Analysis 2025 & 2033
- Figure 12: North America Wood Pulp Trade Analysis Revenue (billion), by Country 2025 & 2033
- Figure 13: North America Wood Pulp Trade Analysis Revenue Share (%), by Country 2025 & 2033
- Figure 14: Europe Wood Pulp Trade Analysis Revenue (billion), by Production Analysis 2025 & 2033
- Figure 15: Europe Wood Pulp Trade Analysis Revenue Share (%), by Production Analysis 2025 & 2033
- Figure 16: Europe Wood Pulp Trade Analysis Revenue (billion), by Consumption Analysis 2025 & 2033
- Figure 17: Europe Wood Pulp Trade Analysis Revenue Share (%), by Consumption Analysis 2025 & 2033
- Figure 18: Europe Wood Pulp Trade Analysis Revenue (billion), by Import Market Analysis (Value & Volume) 2025 & 2033
- Figure 19: Europe Wood Pulp Trade Analysis Revenue Share (%), by Import Market Analysis (Value & Volume) 2025 & 2033
- Figure 20: Europe Wood Pulp Trade Analysis Revenue (billion), by Export Market Analysis (Value & Volume) 2025 & 2033
- Figure 21: Europe Wood Pulp Trade Analysis Revenue Share (%), by Export Market Analysis (Value & Volume) 2025 & 2033
- Figure 22: Europe Wood Pulp Trade Analysis Revenue (billion), by Price Trend Analysis 2025 & 2033
- Figure 23: Europe Wood Pulp Trade Analysis Revenue Share (%), by Price Trend Analysis 2025 & 2033
- Figure 24: Europe Wood Pulp Trade Analysis Revenue (billion), by Country 2025 & 2033
- Figure 25: Europe Wood Pulp Trade Analysis Revenue Share (%), by Country 2025 & 2033
- Figure 26: Asia Pacific Wood Pulp Trade Analysis Revenue (billion), by Production Analysis 2025 & 2033
- Figure 27: Asia Pacific Wood Pulp Trade Analysis Revenue Share (%), by Production Analysis 2025 & 2033
- Figure 28: Asia Pacific Wood Pulp Trade Analysis Revenue (billion), by Consumption Analysis 2025 & 2033
- Figure 29: Asia Pacific Wood Pulp Trade Analysis Revenue Share (%), by Consumption Analysis 2025 & 2033
- Figure 30: Asia Pacific Wood Pulp Trade Analysis Revenue (billion), by Import Market Analysis (Value & Volume) 2025 & 2033
- Figure 31: Asia Pacific Wood Pulp Trade Analysis Revenue Share (%), by Import Market Analysis (Value & Volume) 2025 & 2033
- Figure 32: Asia Pacific Wood Pulp Trade Analysis Revenue (billion), by Export Market Analysis (Value & Volume) 2025 & 2033
- Figure 33: Asia Pacific Wood Pulp Trade Analysis Revenue Share (%), by Export Market Analysis (Value & Volume) 2025 & 2033
- Figure 34: Asia Pacific Wood Pulp Trade Analysis Revenue (billion), by Price Trend Analysis 2025 & 2033
- Figure 35: Asia Pacific Wood Pulp Trade Analysis Revenue Share (%), by Price Trend Analysis 2025 & 2033
- Figure 36: Asia Pacific Wood Pulp Trade Analysis Revenue (billion), by Country 2025 & 2033
- Figure 37: Asia Pacific Wood Pulp Trade Analysis Revenue Share (%), by Country 2025 & 2033
- Figure 38: South America Wood Pulp Trade Analysis Revenue (billion), by Production Analysis 2025 & 2033
- Figure 39: South America Wood Pulp Trade Analysis Revenue Share (%), by Production Analysis 2025 & 2033
- Figure 40: South America Wood Pulp Trade Analysis Revenue (billion), by Consumption Analysis 2025 & 2033
- Figure 41: South America Wood Pulp Trade Analysis Revenue Share (%), by Consumption Analysis 2025 & 2033
- Figure 42: South America Wood Pulp Trade Analysis Revenue (billion), by Import Market Analysis (Value & Volume) 2025 & 2033
- Figure 43: South America Wood Pulp Trade Analysis Revenue Share (%), by Import Market Analysis (Value & Volume) 2025 & 2033
- Figure 44: South America Wood Pulp Trade Analysis Revenue (billion), by Export Market Analysis (Value & Volume) 2025 & 2033
- Figure 45: South America Wood Pulp Trade Analysis Revenue Share (%), by Export Market Analysis (Value & Volume) 2025 & 2033
- Figure 46: South America Wood Pulp Trade Analysis Revenue (billion), by Price Trend Analysis 2025 & 2033
- Figure 47: South America Wood Pulp Trade Analysis Revenue Share (%), by Price Trend Analysis 2025 & 2033
- Figure 48: South America Wood Pulp Trade Analysis Revenue (billion), by Country 2025 & 2033
- Figure 49: South America Wood Pulp Trade Analysis Revenue Share (%), by Country 2025 & 2033
- Figure 50: Africa Wood Pulp Trade Analysis Revenue (billion), by Production Analysis 2025 & 2033
- Figure 51: Africa Wood Pulp Trade Analysis Revenue Share (%), by Production Analysis 2025 & 2033
- Figure 52: Africa Wood Pulp Trade Analysis Revenue (billion), by Consumption Analysis 2025 & 2033
- Figure 53: Africa Wood Pulp Trade Analysis Revenue Share (%), by Consumption Analysis 2025 & 2033
- Figure 54: Africa Wood Pulp Trade Analysis Revenue (billion), by Import Market Analysis (Value & Volume) 2025 & 2033
- Figure 55: Africa Wood Pulp Trade Analysis Revenue Share (%), by Import Market Analysis (Value & Volume) 2025 & 2033
- Figure 56: Africa Wood Pulp Trade Analysis Revenue (billion), by Export Market Analysis (Value & Volume) 2025 & 2033
- Figure 57: Africa Wood Pulp Trade Analysis Revenue Share (%), by Export Market Analysis (Value & Volume) 2025 & 2033
- Figure 58: Africa Wood Pulp Trade Analysis Revenue (billion), by Price Trend Analysis 2025 & 2033
- Figure 59: Africa Wood Pulp Trade Analysis Revenue Share (%), by Price Trend Analysis 2025 & 2033
- Figure 60: Africa Wood Pulp Trade Analysis Revenue (billion), by Country 2025 & 2033
- Figure 61: Africa Wood Pulp Trade Analysis Revenue Share (%), by Country 2025 & 2033
List of Tables
- Table 1: Global Wood Pulp Trade Analysis Revenue billion Forecast, by Production Analysis 2020 & 2033
- Table 2: Global Wood Pulp Trade Analysis Revenue billion Forecast, by Consumption Analysis 2020 & 2033
- Table 3: Global Wood Pulp Trade Analysis Revenue billion Forecast, by Import Market Analysis (Value & Volume) 2020 & 2033
- Table 4: Global Wood Pulp Trade Analysis Revenue billion Forecast, by Export Market Analysis (Value & Volume) 2020 & 2033
- Table 5: Global Wood Pulp Trade Analysis Revenue billion Forecast, by Price Trend Analysis 2020 & 2033
- Table 6: Global Wood Pulp Trade Analysis Revenue billion Forecast, by Region 2020 & 2033
- Table 7: Global Wood Pulp Trade Analysis Revenue billion Forecast, by Production Analysis 2020 & 2033
- Table 8: Global Wood Pulp Trade Analysis Revenue billion Forecast, by Consumption Analysis 2020 & 2033
- Table 9: Global Wood Pulp Trade Analysis Revenue billion Forecast, by Import Market Analysis (Value & Volume) 2020 & 2033
- Table 10: Global Wood Pulp Trade Analysis Revenue billion Forecast, by Export Market Analysis (Value & Volume) 2020 & 2033
- Table 11: Global Wood Pulp Trade Analysis Revenue billion Forecast, by Price Trend Analysis 2020 & 2033
- Table 12: Global Wood Pulp Trade Analysis Revenue billion Forecast, by Country 2020 & 2033
- Table 13: United States Wood Pulp Trade Analysis Revenue (billion) Forecast, by Application 2020 & 2033
- Table 14: Canada Wood Pulp Trade Analysis Revenue (billion) Forecast, by Application 2020 & 2033
- Table 15: Mexico Wood Pulp Trade Analysis Revenue (billion) Forecast, by Application 2020 & 2033
- Table 16: Global Wood Pulp Trade Analysis Revenue billion Forecast, by Production Analysis 2020 & 2033
- Table 17: Global Wood Pulp Trade Analysis Revenue billion Forecast, by Consumption Analysis 2020 & 2033
- Table 18: Global Wood Pulp Trade Analysis Revenue billion Forecast, by Import Market Analysis (Value & Volume) 2020 & 2033
- Table 19: Global Wood Pulp Trade Analysis Revenue billion Forecast, by Export Market Analysis (Value & Volume) 2020 & 2033
- Table 20: Global Wood Pulp Trade Analysis Revenue billion Forecast, by Price Trend Analysis 2020 & 2033
- Table 21: Global Wood Pulp Trade Analysis Revenue billion Forecast, by Country 2020 & 2033
- Table 22: Germany Wood Pulp Trade Analysis Revenue (billion) Forecast, by Application 2020 & 2033
- Table 23: United Kingdom Wood Pulp Trade Analysis Revenue (billion) Forecast, by Application 2020 & 2033
- Table 24: Italy Wood Pulp Trade Analysis Revenue (billion) Forecast, by Application 2020 & 2033
- Table 25: France Wood Pulp Trade Analysis Revenue (billion) Forecast, by Application 2020 & 2033
- Table 26: Netherlands Wood Pulp Trade Analysis Revenue (billion) Forecast, by Application 2020 & 2033
- Table 27: Sweden Wood Pulp Trade Analysis Revenue (billion) Forecast, by Application 2020 & 2033
- Table 28: Russia Wood Pulp Trade Analysis Revenue (billion) Forecast, by Application 2020 & 2033
- Table 29: Global Wood Pulp Trade Analysis Revenue billion Forecast, by Production Analysis 2020 & 2033
- Table 30: Global Wood Pulp Trade Analysis Revenue billion Forecast, by Consumption Analysis 2020 & 2033
- Table 31: Global Wood Pulp Trade Analysis Revenue billion Forecast, by Import Market Analysis (Value & Volume) 2020 & 2033
- Table 32: Global Wood Pulp Trade Analysis Revenue billion Forecast, by Export Market Analysis (Value & Volume) 2020 & 2033
- Table 33: Global Wood Pulp Trade Analysis Revenue billion Forecast, by Price Trend Analysis 2020 & 2033
- Table 34: Global Wood Pulp Trade Analysis Revenue billion Forecast, by Country 2020 & 2033
- Table 35: China Wood Pulp Trade Analysis Revenue (billion) Forecast, by Application 2020 & 2033
- Table 36: Australia Wood Pulp Trade Analysis Revenue (billion) Forecast, by Application 2020 & 2033
- Table 37: India Wood Pulp Trade Analysis Revenue (billion) Forecast, by Application 2020 & 2033
- Table 38: South Korea Wood Pulp Trade Analysis Revenue (billion) Forecast, by Application 2020 & 2033
- Table 39: Japan Wood Pulp Trade Analysis Revenue (billion) Forecast, by Application 2020 & 2033
- Table 40: Indonesia Wood Pulp Trade Analysis Revenue (billion) Forecast, by Application 2020 & 2033
- Table 41: Global Wood Pulp Trade Analysis Revenue billion Forecast, by Production Analysis 2020 & 2033
- Table 42: Global Wood Pulp Trade Analysis Revenue billion Forecast, by Consumption Analysis 2020 & 2033
- Table 43: Global Wood Pulp Trade Analysis Revenue billion Forecast, by Import Market Analysis (Value & Volume) 2020 & 2033
- Table 44: Global Wood Pulp Trade Analysis Revenue billion Forecast, by Export Market Analysis (Value & Volume) 2020 & 2033
- Table 45: Global Wood Pulp Trade Analysis Revenue billion Forecast, by Price Trend Analysis 2020 & 2033
- Table 46: Global Wood Pulp Trade Analysis Revenue billion Forecast, by Country 2020 & 2033
- Table 47: Brazil Wood Pulp Trade Analysis Revenue (billion) Forecast, by Application 2020 & 2033
- Table 48: Chile Wood Pulp Trade Analysis Revenue (billion) Forecast, by Application 2020 & 2033
- Table 49: Global Wood Pulp Trade Analysis Revenue billion Forecast, by Production Analysis 2020 & 2033
- Table 50: Global Wood Pulp Trade Analysis Revenue billion Forecast, by Consumption Analysis 2020 & 2033
- Table 51: Global Wood Pulp Trade Analysis Revenue billion Forecast, by Import Market Analysis (Value & Volume) 2020 & 2033
- Table 52: Global Wood Pulp Trade Analysis Revenue billion Forecast, by Export Market Analysis (Value & Volume) 2020 & 2033
- Table 53: Global Wood Pulp Trade Analysis Revenue billion Forecast, by Price Trend Analysis 2020 & 2033
- Table 54: Global Wood Pulp Trade Analysis Revenue billion Forecast, by Country 2020 & 2033
- Table 55: South Africa Wood Pulp Trade Analysis Revenue (billion) Forecast, by Application 2020 & 2033
Frequently Asked Questions
1. What is the projected Compound Annual Growth Rate (CAGR) of the Wood Pulp Trade Analysis?
The projected CAGR is approximately 2.7%.
2. Which companies are prominent players in the Wood Pulp Trade Analysis?
Key companies in the market include Kimberly-Clark , Procter & Gamble , Georgia-Pacific, International Paper , UPM .
3. What are the main segments of the Wood Pulp Trade Analysis?
The market segments include Production Analysis, Consumption Analysis, Import Market Analysis (Value & Volume), Export Market Analysis (Value & Volume), Price Trend Analysis.
4. Can you provide details about the market size?
The market size is estimated to be USD 166.65 billion as of 2022.
5. What are some drivers contributing to market growth?
; Increasing Food Security Concerns; Inclination Toward a Healthy Lifestyle.
6. What are the notable trends driving market growth?
Huge Demand in Packaging and Industrial Papers.
7. Are there any restraints impacting market growth?
; Unfavorable Climatic Conditions; Higher Market Entry Cost.
8. Can you provide examples of recent developments in the market?
December 2022: The Indian Institute of Technology (IIT) Roorkee, in association with Shah Paper Mills Limited, launched a new project to develop the advanced packaging research laboratory and skill development program at the Department of Paper Technology, Saharanpur Campus. The institute has been fostering collaboration with paper industries from India, focusing on providing cutting-edge innovation research and skill development globally.
9. What pricing options are available for accessing the report?
Pricing options include single-user, multi-user, and enterprise licenses priced at USD 4750, USD 5250, and USD 8750 respectively.
10. Is the market size provided in terms of value or volume?
The market size is provided in terms of value, measured in billion.
11. Are there any specific market keywords associated with the report?
Yes, the market keyword associated with the report is "Wood Pulp Trade Analysis," which aids in identifying and referencing the specific market segment covered.
12. How do I determine which pricing option suits my needs best?
The pricing options vary based on user requirements and access needs. Individual users may opt for single-user licenses, while businesses requiring broader access may choose multi-user or enterprise licenses for cost-effective access to the report.
13. Are there any additional resources or data provided in the Wood Pulp Trade Analysis report?
While the report offers comprehensive insights, it's advisable to review the specific contents or supplementary materials provided to ascertain if additional resources or data are available.
14. How can I stay updated on further developments or reports in the Wood Pulp Trade Analysis?
To stay informed about further developments, trends, and reports in the Wood Pulp Trade Analysis, consider subscribing to industry newsletters, following relevant companies and organizations, or regularly checking reputable industry news sources and publications.
Methodology
Step 1 - Identification of Relevant Samples Size from Population Database


Step 2 - Approaches for Defining Global Market Size (Value, Volume* & Price*)

Note*: In applicable scenarios
Step 3 - Data Sources
Primary Research
- Web Analytics
- Survey Reports
- Research Institute
- Latest Research Reports
- Opinion Leaders
Secondary Research
- Annual Reports
- White Paper
- Latest Press Release
- Industry Association
- Paid Database
- Investor Presentations

Step 4 - Data Triangulation
Involves using different sources of information in order to increase the validity of a study
These sources are likely to be stakeholders in a program - participants, other researchers, program staff, other community members, and so on.
Then we put all data in single framework & apply various statistical tools to find out the dynamic on the market.
During the analysis stage, feedback from the stakeholder groups would be compared to determine areas of agreement as well as areas of divergence