

Key Insights
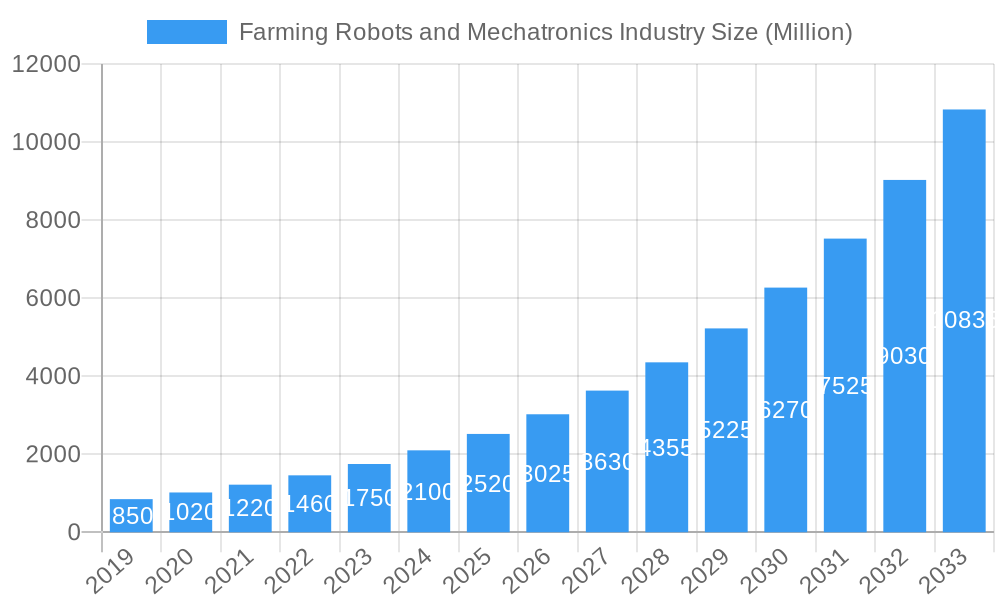
The global Farming Robots and Mechatronics market is poised for significant expansion, projected to reach an estimated market size of approximately $2.8 billion by the end of 2025, with a robust Compound Annual Growth Rate (CAGR) of 20.40% anticipated through 2033. This dynamic growth is primarily propelled by a confluence of factors including the escalating demand for increased agricultural productivity to feed a growing global population, coupled with the inherent labor shortages and rising operational costs in traditional farming. The adoption of advanced technologies like AI-powered robots, autonomous tractors, and precision spraying systems offers compelling solutions for optimizing resource utilization, minimizing environmental impact through targeted interventions, and enhancing crop yields. Further fueling this expansion is the increasing governmental support and initiatives aimed at modernizing the agricultural sector and promoting sustainable farming practices. The market is characterized by a growing trend towards precision agriculture, where robots and mechatronic systems are employed for tasks such as automated seeding, targeted fertilization, weed detection and removal, and intelligent harvesting, thereby contributing to greater efficiency and reduced waste.
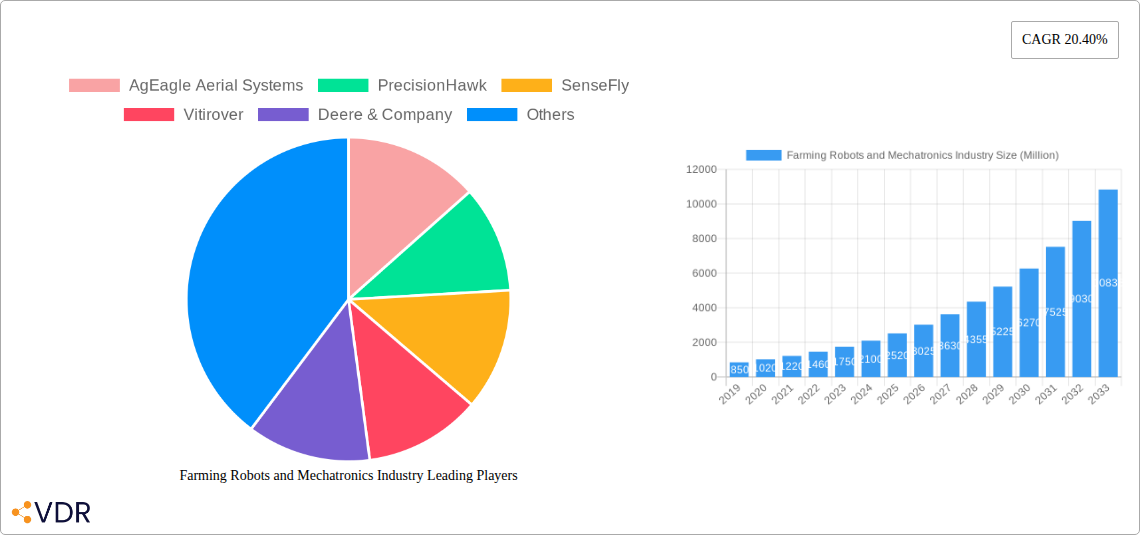
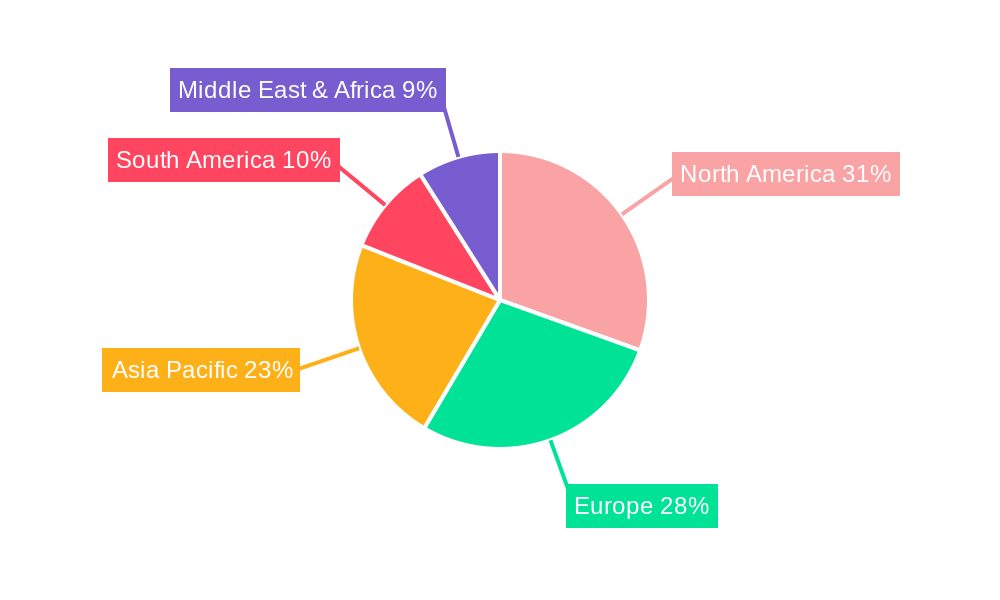
Farming Robots and Mechatronics Industry Market Size (In Million)
The market's trajectory is further shaped by ongoing technological advancements in robotics, sensor technology, and data analytics, enabling the development of more sophisticated and cost-effective farming solutions. While the potential for widespread adoption is immense, certain restraints such as the high initial investment cost for advanced robotic systems and the need for specialized technical expertise for operation and maintenance, particularly in developing regions, could pose challenges to immediate and uniform market penetration. However, ongoing innovation and the increasing availability of rental and service-based models are expected to mitigate these barriers over the forecast period. Geographically, North America and Europe are anticipated to lead the market in terms of adoption and investment, driven by well-established agricultural industries and a strong inclination towards technological integration. The Asia Pacific region, with its vast agricultural base and rapidly developing economies, presents substantial untapped potential for future growth. The competitive landscape features a diverse array of players, from established agricultural machinery giants like Deere & Company and GEA Group to specialized robotics firms such as AgEagle Aerial Systems and Naio Technologies, all vying to capture market share through product innovation and strategic partnerships.
Farming Robots and Mechatronics Industry Company Market Share
This in-depth report provides a holistic analysis of the global farming robots and mechatronics industry, offering crucial insights for stakeholders navigating this rapidly evolving sector. We delve into precision agriculture technology, autonomous farming solutions, agricultural robotics, agritech innovations, and the burgeoning market for smart farming equipment. The report covers the parent market of agricultural automation and the child market of specialized robotic applications, with all quantitative values presented in million units.
Farming Robots and Mechatronics Industry Market Dynamics & Structure
The farming robots and mechatronics industry is characterized by increasing market concentration, driven by significant technological advancements and strategic acquisitions. Key drivers of innovation include the demand for enhanced crop yield optimization, reduced labor dependency, and the necessity for sustainable agricultural practices. Regulatory frameworks are slowly adapting to integrate robotic systems, though challenges remain in standardizing safety and operational protocols. Competitive landscapes are shaped by innovative product substitutes, such as advanced drone technology and sensor-equipped machinery, vying for market share. End-user demographics are shifting, with a growing adoption by both large-scale commercial farms and increasingly tech-savvy smallholder farmers seeking efficiency gains. Mergers and acquisitions are a prominent feature, as larger corporations acquire innovative startups to enhance their product portfolios and market reach. For instance, recent M&A activities indicate a trend towards consolidating expertise in areas like AI-powered navigation and automated harvesting. Barriers to innovation include high upfront costs for advanced robotic systems and the need for extensive farmer training and infrastructure upgrades.
- Market Concentration: Rising due to consolidation and key players investing heavily in R&D.
- Technological Innovation Drivers: Focus on AI, IoT, machine learning for autonomous operations, data analytics for precision farming.
- Regulatory Frameworks: Evolving to address autonomous operation, data privacy, and safety standards.
- Competitive Product Substitutes: Advanced drones, sensor-based machinery, and improved manual farming techniques.
- End-User Demographics: Growing adoption among tech-forward farmers, including younger generations.
- M&A Trends: Strategic acquisitions to gain market share and acquire cutting-edge technology.
- Innovation Barriers: High capital investment, farmer education, and infrastructure readiness.
Farming Robots and Mechatronics Industry Growth Trends & Insights
The farming robots and mechatronics industry is poised for substantial growth, with a projected compound annual growth rate (CAGR) of XX% over the forecast period (2025–2033). This robust expansion is fueled by the escalating global demand for food security, coupled with the inherent inefficiencies and labor shortages in traditional farming methods. The adoption rates of agricultural robots, including autonomous tractors, robotic harvesters, and precision spraying drones, are accelerating as their benefits in terms of increased productivity, reduced operational costs, and minimized environmental impact become increasingly apparent. Technological disruptions are at the forefront, with advancements in artificial intelligence (AI), machine learning, computer vision, and the Internet of Things (IoT) enabling more sophisticated and autonomous farming operations. These innovations are leading to data-driven decision-making, allowing farmers to optimize resource allocation, predict crop diseases, and achieve higher yields with greater precision. Consumer behavior is also shifting, with a growing preference for sustainably grown produce and traceability, which smart farming equipment and agritech innovations readily support. The increasing efficiency and cost-effectiveness of these technologies are driving market penetration, transforming the agricultural landscape from one of manual labor to one of intelligent automation.
Dominant Regions, Countries, or Segments in Farming Robots and Mechatronics Industry
The North America region is emerging as a dominant force in the farming robots and mechatronics industry, primarily driven by the United States and Canada. This dominance is evident across Production Analysis, Consumption Analysis, and Import Market Analysis (Value & Volume). The region's leadership is underpinned by a strong existing agricultural base, significant investment in precision agriculture technology, and a proactive approach to adopting autonomous farming solutions. Government initiatives and subsidies aimed at modernizing the agricultural sector further bolster this growth. The U.S., in particular, exhibits high adoption rates for agricultural robotics due to its large-scale commercial farms requiring efficient and labor-saving technologies.
- Production Analysis: North America leads in the development and manufacturing of advanced robotic systems, driven by companies like Deere & Company and Autonomous Tractor Corporation. Significant R&D investments contribute to the production of sophisticated machinery.
- Consumption Analysis: The large arable land area and the economic capacity of U.S. farmers to invest in high-tech equipment drive substantial consumption of farming robots. Demand for smart farming equipment to improve efficiency and reduce labor costs is paramount.
- Import Market Analysis (Value & Volume): While North America is a major producer, it also imports specialized components and advanced robotic systems, contributing to a robust import market driven by the pursuit of cutting-edge agritech innovations.
- Export Market Analysis (Value & Volume): North America is also a significant exporter of farming robots and related technologies, particularly to other developed agricultural economies seeking to enhance productivity.
- Price Trend Analysis: The region experiences a complex price trend, with initial high costs for advanced systems gradually decreasing due to economies of scale and technological maturity. However, premium pricing for highly specialized or AI-integrated robots persists.
Key drivers include strong economic policies supporting agricultural technology adoption, robust infrastructure for technology deployment, and a culture of innovation among farmers. Market share within North America is distributed among major agricultural machinery manufacturers and specialized robotics companies, with growing potential for new entrants offering niche solutions.
Farming Robots and Mechatronics Industry Product Landscape
The product landscape of the farming robots and mechatronics industry is rapidly diversifying, featuring innovations such as autonomous tractors, precision spraying drones, robotic harvesters, and automated milking systems. These smart farming equipment solutions offer enhanced operational efficiency, reduced manual labor, and improved resource management. Applications range from automated seed planting and weed detection to real-time soil monitoring and livestock management. Performance metrics are continuously improving, with advancements in AI-powered navigation, object recognition, and data analytics enabling greater accuracy and autonomy. Unique selling propositions lie in their ability to increase crop yields, minimize chemical usage, and optimize water consumption, contributing to more sustainable agricultural practices and addressing global food security challenges.
Key Drivers, Barriers & Challenges in Farming Robots and Mechatronics Industry
Key Drivers:
- Growing Global Food Demand: Increasing population necessitates enhanced agricultural productivity.
- Labor Shortages: An aging farming population and a declining rural workforce drive the need for automation.
- Technological Advancements: AI, IoT, and robotics are making sophisticated farming solutions viable and cost-effective.
- Sustainability Initiatives: Demand for reduced water, pesticide, and fertilizer usage favors precision farming.
- Government Support: Policies and subsidies promoting agricultural modernization and technology adoption.
Barriers & Challenges:
- High Initial Investment Costs: The upfront cost of advanced robotic systems can be prohibitive for many farmers.
- Technical Expertise and Training: Farmers require new skills to operate and maintain complex machinery.
- Infrastructure Limitations: Lack of reliable internet connectivity and power supply in some rural areas.
- Regulatory Hurdles: Evolving regulations for autonomous systems can slow adoption.
- Data Security and Privacy: Concerns over the ownership and security of farm data collected by robots.
- Interoperability Issues: Ensuring different robotic systems and software can work together seamlessly.
Emerging Opportunities in Farming Robots and Mechatronics Industry
Emerging opportunities in the farming robots and mechatronics industry lie in the development of cost-effective solutions for smallholder farmers, particularly in developing economies. The application of AI for predictive analytics in disease detection and yield forecasting presents a significant growth area. Furthermore, the expansion of robotics into niche agricultural sectors like vertical farming and indoor agriculture offers untapped market potential. Evolving consumer preferences for traceable and sustainably produced food will continue to drive demand for technologies that enable precise monitoring and control throughout the agricultural value chain. The integration of robotics with renewable energy sources for sustainable farm operations also represents a promising avenue.
Growth Accelerators in the Farming Robots and Mechatronics Industry Industry
Several factors are acting as significant growth accelerators for the farming robots and mechatronics industry. Technological breakthroughs in sensor technology, battery life, and AI algorithms are continuously improving the capabilities and affordability of robotic systems. Strategic partnerships between agricultural technology providers, machinery manufacturers, and software developers are fostering innovation and accelerating market penetration. Furthermore, the expansion of services such as "Robotics as a Service" (RaaS) is lowering the barrier to entry for farmers by offering subscription-based access to advanced equipment, thus stimulating wider adoption. Market expansion strategies targeting emerging economies with large agricultural sectors are also critical growth drivers.
Key Players Shaping the Farming Robots and Mechatronics Industry Market
- AgEagle Aerial Systems
- PrecisionHawk
- SenseFly
- Vitirover
- Deere & Company
- Autonomous Tractor Corporation
- Wall-Ye
- Vision Robotics Corporation
- Lely Industries N V
- Conic System
- AutoProbe Technologies
- Harvest Automation Inc
- A/S S A Christensen & Co (SAC Milking)
- GEA Group Aktiengesellschaft
- Yamaha Motor Co Ltd
- Tetra Laval(DeLaval Inc )
- EcoRobotix Ltd
- Autonomous Solutions (ASI)
- Naio Technologies
- Clearpath Robotics Inc
- BouMatic Robotics
Notable Milestones in Farming Robots and Mechatronics Industry Sector
- February 2023: Yamaha Motor Co., Ltd has announced that it has established a new company in Singapore aimed at expanding its business in Southeast Asia and India, where demand for robots is growing, and intends to secure new clients, as well as provide high-quality after-sales services in line with international standards. The Company will also strengthen its distributor support system while working to expand its distributor network.
- October 2022: Yamaha Motor Co., Ltd has announced that the company has developed a new product, the FAZER R AP, which adds an automatic flight function to the FAZER R industrial unmanned helicopter used for agricultural applications and to help further improve spraying efficiency.
- September 2022: GEA has launched GEA Dairy Feed F4500, an autonomously driving feeding robot that has been designed to take on this task independently and can handle herds of up to 300 cows. At the same time, it uses innovative sensor technology to reduce feed waste to a minimum saving time, money, and natural resources. The GEA Dairy Feed F4500 will initially be available in Germany, Austria, Switzerland, France, and Sweden.
In-Depth Farming Robots and Mechatronics Industry Market Outlook
The future outlook for the farming robots and mechatronics industry is exceptionally promising, driven by the relentless pursuit of efficiency, sustainability, and food security. Key growth accelerators include continued innovation in AI and robotics, leading to increasingly sophisticated and autonomous agricultural machinery. Strategic alliances between technology developers and traditional agricultural players will foster wider adoption and market integration. The expansion of "Robotics as a Service" models is set to democratize access to advanced technologies, empowering a broader spectrum of farmers. Furthermore, the growing emphasis on precision agriculture and data-driven farming practices will create significant opportunities for companies offering integrated solutions. The industry's ability to address labor shortages and environmental concerns positions it for sustained, high-impact growth in the coming years.
Farming Robots and Mechatronics Industry Segmentation
- 1. Production Analysis
- 2. Consumption Analysis
- 3. Import Market Analysis (Value & Volume)
- 4. Export Market Analysis (Value & Volume)
- 5. Price Trend Analysis
Farming Robots and Mechatronics Industry Segmentation By Geography
-
1. North America
- 1.1. United States
- 1.2. Canada
- 1.3. Mexico
-
2. South America
- 2.1. Brazil
- 2.2. Argentina
- 2.3. Rest of South America
-
3. Europe
- 3.1. United Kingdom
- 3.2. Germany
- 3.3. France
- 3.4. Italy
- 3.5. Spain
- 3.6. Russia
- 3.7. Benelux
- 3.8. Nordics
- 3.9. Rest of Europe
-
4. Middle East & Africa
- 4.1. Turkey
- 4.2. Israel
- 4.3. GCC
- 4.4. North Africa
- 4.5. South Africa
- 4.6. Rest of Middle East & Africa
-
5. Asia Pacific
- 5.1. China
- 5.2. India
- 5.3. Japan
- 5.4. South Korea
- 5.5. ASEAN
- 5.6. Oceania
- 5.7. Rest of Asia Pacific
Farming Robots and Mechatronics Industry Regional Market Share
Geographic Coverage of Farming Robots and Mechatronics Industry
Farming Robots and Mechatronics Industry REPORT HIGHLIGHTS
| Aspects | Details |
|---|---|
| Study Period | 2020-2034 |
| Base Year | 2025 |
| Estimated Year | 2026 |
| Forecast Period | 2026-2034 |
| Historical Period | 2020-2025 |
| Growth Rate | CAGR of 26% from 2020-2034 |
| Segmentation |
|
Table of Contents
- 1. Introduction
- 1.1. Research Scope
- 1.2. Market Segmentation
- 1.3. Research Objective
- 1.4. Definitions and Assumptions
- 2. Executive Summary
- 2.1. Market Snapshot
- 3. Market Dynamics
- 3.1. Market Drivers
- 3.2. Market Restrains
- 3.3. Market Trends
- 3.4. Market Opportunities
- 4. Market Factor Analysis
- 4.1. Porters Five Forces
- 4.1.1. Bargaining Power of Suppliers
- 4.1.2. Bargaining Power of Buyers
- 4.1.3. Threat of New Entrants
- 4.1.4. Threat of Substitutes
- 4.1.5. Competitive Rivalry
- 4.2. PESTEL analysis
- 4.3. BCG Analysis
- 4.3.1. Stars (High Growth, High Market Share)
- 4.3.2. Cash Cows (Low Growth, High Market Share)
- 4.3.3. Question Mark (High Growth, Low Market Share)
- 4.3.4. Dogs (Low Growth, Low Market Share)
- 4.4. Ansoff Matrix Analysis
- 4.5. Supply Chain Analysis
- 4.6. Regulatory Landscape
- 4.7. Current Market Potential and Opportunity Assessment (TAM–SAM–SOM Framework)
- 4.8. VDR Analyst Note
- 4.1. Porters Five Forces
- 5. Market Analysis, Insights and Forecast 2021-2033
- 5.1. Market Analysis, Insights and Forecast - by Production Analysis
- 5.2. Market Analysis, Insights and Forecast - by Consumption Analysis
- 5.3. Market Analysis, Insights and Forecast - by Import Market Analysis (Value & Volume)
- 5.4. Market Analysis, Insights and Forecast - by Export Market Analysis (Value & Volume)
- 5.5. Market Analysis, Insights and Forecast - by Price Trend Analysis
- 5.6. Market Analysis, Insights and Forecast - by Region
- 5.6.1. North America
- 5.6.2. South America
- 5.6.3. Europe
- 5.6.4. Middle East & Africa
- 5.6.5. Asia Pacific
- 6. Global Farming Robots and Mechatronics Industry Analysis, Insights and Forecast, 2021-2033
- 6.1. Market Analysis, Insights and Forecast - by Production Analysis
- 6.2. Market Analysis, Insights and Forecast - by Consumption Analysis
- 6.3. Market Analysis, Insights and Forecast - by Import Market Analysis (Value & Volume)
- 6.4. Market Analysis, Insights and Forecast - by Export Market Analysis (Value & Volume)
- 6.5. Market Analysis, Insights and Forecast - by Price Trend Analysis
- 7. North America Farming Robots and Mechatronics Industry Analysis, Insights and Forecast, 2021-2033
- 7.1. Market Analysis, Insights and Forecast - by Production Analysis
- 7.2. Market Analysis, Insights and Forecast - by Consumption Analysis
- 7.3. Market Analysis, Insights and Forecast - by Import Market Analysis (Value & Volume)
- 7.4. Market Analysis, Insights and Forecast - by Export Market Analysis (Value & Volume)
- 7.5. Market Analysis, Insights and Forecast - by Price Trend Analysis
- 8. South America Farming Robots and Mechatronics Industry Analysis, Insights and Forecast, 2021-2033
- 8.1. Market Analysis, Insights and Forecast - by Production Analysis
- 8.2. Market Analysis, Insights and Forecast - by Consumption Analysis
- 8.3. Market Analysis, Insights and Forecast - by Import Market Analysis (Value & Volume)
- 8.4. Market Analysis, Insights and Forecast - by Export Market Analysis (Value & Volume)
- 8.5. Market Analysis, Insights and Forecast - by Price Trend Analysis
- 9. Europe Farming Robots and Mechatronics Industry Analysis, Insights and Forecast, 2021-2033
- 9.1. Market Analysis, Insights and Forecast - by Production Analysis
- 9.2. Market Analysis, Insights and Forecast - by Consumption Analysis
- 9.3. Market Analysis, Insights and Forecast - by Import Market Analysis (Value & Volume)
- 9.4. Market Analysis, Insights and Forecast - by Export Market Analysis (Value & Volume)
- 9.5. Market Analysis, Insights and Forecast - by Price Trend Analysis
- 10. Middle East & Africa Farming Robots and Mechatronics Industry Analysis, Insights and Forecast, 2021-2033
- 10.1. Market Analysis, Insights and Forecast - by Production Analysis
- 10.2. Market Analysis, Insights and Forecast - by Consumption Analysis
- 10.3. Market Analysis, Insights and Forecast - by Import Market Analysis (Value & Volume)
- 10.4. Market Analysis, Insights and Forecast - by Export Market Analysis (Value & Volume)
- 10.5. Market Analysis, Insights and Forecast - by Price Trend Analysis
- 11. Asia Pacific Farming Robots and Mechatronics Industry Analysis, Insights and Forecast, 2021-2033
- 11.1. Market Analysis, Insights and Forecast - by Production Analysis
- 11.2. Market Analysis, Insights and Forecast - by Consumption Analysis
- 11.3. Market Analysis, Insights and Forecast - by Import Market Analysis (Value & Volume)
- 11.4. Market Analysis, Insights and Forecast - by Export Market Analysis (Value & Volume)
- 11.5. Market Analysis, Insights and Forecast - by Price Trend Analysis
- 12. Competitive Analysis
- 12.1. Company Profiles
- 12.1.1 AgEagle Aerial Systems
- 12.1.1.1. Company Overview
- 12.1.1.2. Products
- 12.1.1.3. Company Financials
- 12.1.1.4. SWOT Analysis
- 12.1.2 PrecisionHawk
- 12.1.2.1. Company Overview
- 12.1.2.2. Products
- 12.1.2.3. Company Financials
- 12.1.2.4. SWOT Analysis
- 12.1.3 SenseFly
- 12.1.3.1. Company Overview
- 12.1.3.2. Products
- 12.1.3.3. Company Financials
- 12.1.3.4. SWOT Analysis
- 12.1.4 Vitirover
- 12.1.4.1. Company Overview
- 12.1.4.2. Products
- 12.1.4.3. Company Financials
- 12.1.4.4. SWOT Analysis
- 12.1.5 Deere & Company
- 12.1.5.1. Company Overview
- 12.1.5.2. Products
- 12.1.5.3. Company Financials
- 12.1.5.4. SWOT Analysis
- 12.1.6 Autonomous Tractor Corporation
- 12.1.6.1. Company Overview
- 12.1.6.2. Products
- 12.1.6.3. Company Financials
- 12.1.6.4. SWOT Analysis
- 12.1.7 Wall-Ye
- 12.1.7.1. Company Overview
- 12.1.7.2. Products
- 12.1.7.3. Company Financials
- 12.1.7.4. SWOT Analysis
- 12.1.8 Vision Robotics Corporation
- 12.1.8.1. Company Overview
- 12.1.8.2. Products
- 12.1.8.3. Company Financials
- 12.1.8.4. SWOT Analysis
- 12.1.9 Lely Industries N V
- 12.1.9.1. Company Overview
- 12.1.9.2. Products
- 12.1.9.3. Company Financials
- 12.1.9.4. SWOT Analysis
- 12.1.10 Conic System
- 12.1.10.1. Company Overview
- 12.1.10.2. Products
- 12.1.10.3. Company Financials
- 12.1.10.4. SWOT Analysis
- 12.1.11 AutoProbe Technologies
- 12.1.11.1. Company Overview
- 12.1.11.2. Products
- 12.1.11.3. Company Financials
- 12.1.11.4. SWOT Analysis
- 12.1.12 Harvest Automation Inc
- 12.1.12.1. Company Overview
- 12.1.12.2. Products
- 12.1.12.3. Company Financials
- 12.1.12.4. SWOT Analysis
- 12.1.13 A/S S A Christensen & Co (SAC Milking)
- 12.1.13.1. Company Overview
- 12.1.13.2. Products
- 12.1.13.3. Company Financials
- 12.1.13.4. SWOT Analysis
- 12.1.14 GEA Group Aktiengesellschaft
- 12.1.14.1. Company Overview
- 12.1.14.2. Products
- 12.1.14.3. Company Financials
- 12.1.14.4. SWOT Analysis
- 12.1.15 Yamaha Motor Co Ltd*List Not Exhaustive
- 12.1.15.1. Company Overview
- 12.1.15.2. Products
- 12.1.15.3. Company Financials
- 12.1.15.4. SWOT Analysis
- 12.1.16 Tetra Laval(DeLaval Inc )
- 12.1.16.1. Company Overview
- 12.1.16.2. Products
- 12.1.16.3. Company Financials
- 12.1.16.4. SWOT Analysis
- 12.1.17 EcoRobotix Ltd
- 12.1.17.1. Company Overview
- 12.1.17.2. Products
- 12.1.17.3. Company Financials
- 12.1.17.4. SWOT Analysis
- 12.1.18 Autonomous Solutions (ASI)
- 12.1.18.1. Company Overview
- 12.1.18.2. Products
- 12.1.18.3. Company Financials
- 12.1.18.4. SWOT Analysis
- 12.1.19 Naio Technologies
- 12.1.19.1. Company Overview
- 12.1.19.2. Products
- 12.1.19.3. Company Financials
- 12.1.19.4. SWOT Analysis
- 12.1.20 Clearpath Robotics Inc
- 12.1.20.1. Company Overview
- 12.1.20.2. Products
- 12.1.20.3. Company Financials
- 12.1.20.4. SWOT Analysis
- 12.1.21 BouMatic Robotics
- 12.1.21.1. Company Overview
- 12.1.21.2. Products
- 12.1.21.3. Company Financials
- 12.1.21.4. SWOT Analysis
- 12.1.1 AgEagle Aerial Systems
- 12.2. Market Entropy
- 12.2.1 Company's Key Areas Served
- 12.2.2 Recent Developments
- 12.3. Company Market Share Analysis 2025
- 12.3.1 Top 5 Companies Market Share Analysis
- 12.3.2 Top 3 Companies Market Share Analysis
- 12.4. List of Potential Customers
- 13. Research Methodology
List of Figures
- Figure 1: Global Farming Robots and Mechatronics Industry Revenue Breakdown (billion, %) by Region 2025 & 2033
- Figure 2: North America Farming Robots and Mechatronics Industry Revenue (billion), by Production Analysis 2025 & 2033
- Figure 3: North America Farming Robots and Mechatronics Industry Revenue Share (%), by Production Analysis 2025 & 2033
- Figure 4: North America Farming Robots and Mechatronics Industry Revenue (billion), by Consumption Analysis 2025 & 2033
- Figure 5: North America Farming Robots and Mechatronics Industry Revenue Share (%), by Consumption Analysis 2025 & 2033
- Figure 6: North America Farming Robots and Mechatronics Industry Revenue (billion), by Import Market Analysis (Value & Volume) 2025 & 2033
- Figure 7: North America Farming Robots and Mechatronics Industry Revenue Share (%), by Import Market Analysis (Value & Volume) 2025 & 2033
- Figure 8: North America Farming Robots and Mechatronics Industry Revenue (billion), by Export Market Analysis (Value & Volume) 2025 & 2033
- Figure 9: North America Farming Robots and Mechatronics Industry Revenue Share (%), by Export Market Analysis (Value & Volume) 2025 & 2033
- Figure 10: North America Farming Robots and Mechatronics Industry Revenue (billion), by Price Trend Analysis 2025 & 2033
- Figure 11: North America Farming Robots and Mechatronics Industry Revenue Share (%), by Price Trend Analysis 2025 & 2033
- Figure 12: North America Farming Robots and Mechatronics Industry Revenue (billion), by Country 2025 & 2033
- Figure 13: North America Farming Robots and Mechatronics Industry Revenue Share (%), by Country 2025 & 2033
- Figure 14: South America Farming Robots and Mechatronics Industry Revenue (billion), by Production Analysis 2025 & 2033
- Figure 15: South America Farming Robots and Mechatronics Industry Revenue Share (%), by Production Analysis 2025 & 2033
- Figure 16: South America Farming Robots and Mechatronics Industry Revenue (billion), by Consumption Analysis 2025 & 2033
- Figure 17: South America Farming Robots and Mechatronics Industry Revenue Share (%), by Consumption Analysis 2025 & 2033
- Figure 18: South America Farming Robots and Mechatronics Industry Revenue (billion), by Import Market Analysis (Value & Volume) 2025 & 2033
- Figure 19: South America Farming Robots and Mechatronics Industry Revenue Share (%), by Import Market Analysis (Value & Volume) 2025 & 2033
- Figure 20: South America Farming Robots and Mechatronics Industry Revenue (billion), by Export Market Analysis (Value & Volume) 2025 & 2033
- Figure 21: South America Farming Robots and Mechatronics Industry Revenue Share (%), by Export Market Analysis (Value & Volume) 2025 & 2033
- Figure 22: South America Farming Robots and Mechatronics Industry Revenue (billion), by Price Trend Analysis 2025 & 2033
- Figure 23: South America Farming Robots and Mechatronics Industry Revenue Share (%), by Price Trend Analysis 2025 & 2033
- Figure 24: South America Farming Robots and Mechatronics Industry Revenue (billion), by Country 2025 & 2033
- Figure 25: South America Farming Robots and Mechatronics Industry Revenue Share (%), by Country 2025 & 2033
- Figure 26: Europe Farming Robots and Mechatronics Industry Revenue (billion), by Production Analysis 2025 & 2033
- Figure 27: Europe Farming Robots and Mechatronics Industry Revenue Share (%), by Production Analysis 2025 & 2033
- Figure 28: Europe Farming Robots and Mechatronics Industry Revenue (billion), by Consumption Analysis 2025 & 2033
- Figure 29: Europe Farming Robots and Mechatronics Industry Revenue Share (%), by Consumption Analysis 2025 & 2033
- Figure 30: Europe Farming Robots and Mechatronics Industry Revenue (billion), by Import Market Analysis (Value & Volume) 2025 & 2033
- Figure 31: Europe Farming Robots and Mechatronics Industry Revenue Share (%), by Import Market Analysis (Value & Volume) 2025 & 2033
- Figure 32: Europe Farming Robots and Mechatronics Industry Revenue (billion), by Export Market Analysis (Value & Volume) 2025 & 2033
- Figure 33: Europe Farming Robots and Mechatronics Industry Revenue Share (%), by Export Market Analysis (Value & Volume) 2025 & 2033
- Figure 34: Europe Farming Robots and Mechatronics Industry Revenue (billion), by Price Trend Analysis 2025 & 2033
- Figure 35: Europe Farming Robots and Mechatronics Industry Revenue Share (%), by Price Trend Analysis 2025 & 2033
- Figure 36: Europe Farming Robots and Mechatronics Industry Revenue (billion), by Country 2025 & 2033
- Figure 37: Europe Farming Robots and Mechatronics Industry Revenue Share (%), by Country 2025 & 2033
- Figure 38: Middle East & Africa Farming Robots and Mechatronics Industry Revenue (billion), by Production Analysis 2025 & 2033
- Figure 39: Middle East & Africa Farming Robots and Mechatronics Industry Revenue Share (%), by Production Analysis 2025 & 2033
- Figure 40: Middle East & Africa Farming Robots and Mechatronics Industry Revenue (billion), by Consumption Analysis 2025 & 2033
- Figure 41: Middle East & Africa Farming Robots and Mechatronics Industry Revenue Share (%), by Consumption Analysis 2025 & 2033
- Figure 42: Middle East & Africa Farming Robots and Mechatronics Industry Revenue (billion), by Import Market Analysis (Value & Volume) 2025 & 2033
- Figure 43: Middle East & Africa Farming Robots and Mechatronics Industry Revenue Share (%), by Import Market Analysis (Value & Volume) 2025 & 2033
- Figure 44: Middle East & Africa Farming Robots and Mechatronics Industry Revenue (billion), by Export Market Analysis (Value & Volume) 2025 & 2033
- Figure 45: Middle East & Africa Farming Robots and Mechatronics Industry Revenue Share (%), by Export Market Analysis (Value & Volume) 2025 & 2033
- Figure 46: Middle East & Africa Farming Robots and Mechatronics Industry Revenue (billion), by Price Trend Analysis 2025 & 2033
- Figure 47: Middle East & Africa Farming Robots and Mechatronics Industry Revenue Share (%), by Price Trend Analysis 2025 & 2033
- Figure 48: Middle East & Africa Farming Robots and Mechatronics Industry Revenue (billion), by Country 2025 & 2033
- Figure 49: Middle East & Africa Farming Robots and Mechatronics Industry Revenue Share (%), by Country 2025 & 2033
- Figure 50: Asia Pacific Farming Robots and Mechatronics Industry Revenue (billion), by Production Analysis 2025 & 2033
- Figure 51: Asia Pacific Farming Robots and Mechatronics Industry Revenue Share (%), by Production Analysis 2025 & 2033
- Figure 52: Asia Pacific Farming Robots and Mechatronics Industry Revenue (billion), by Consumption Analysis 2025 & 2033
- Figure 53: Asia Pacific Farming Robots and Mechatronics Industry Revenue Share (%), by Consumption Analysis 2025 & 2033
- Figure 54: Asia Pacific Farming Robots and Mechatronics Industry Revenue (billion), by Import Market Analysis (Value & Volume) 2025 & 2033
- Figure 55: Asia Pacific Farming Robots and Mechatronics Industry Revenue Share (%), by Import Market Analysis (Value & Volume) 2025 & 2033
- Figure 56: Asia Pacific Farming Robots and Mechatronics Industry Revenue (billion), by Export Market Analysis (Value & Volume) 2025 & 2033
- Figure 57: Asia Pacific Farming Robots and Mechatronics Industry Revenue Share (%), by Export Market Analysis (Value & Volume) 2025 & 2033
- Figure 58: Asia Pacific Farming Robots and Mechatronics Industry Revenue (billion), by Price Trend Analysis 2025 & 2033
- Figure 59: Asia Pacific Farming Robots and Mechatronics Industry Revenue Share (%), by Price Trend Analysis 2025 & 2033
- Figure 60: Asia Pacific Farming Robots and Mechatronics Industry Revenue (billion), by Country 2025 & 2033
- Figure 61: Asia Pacific Farming Robots and Mechatronics Industry Revenue Share (%), by Country 2025 & 2033
List of Tables
- Table 1: Global Farming Robots and Mechatronics Industry Revenue billion Forecast, by Production Analysis 2020 & 2033
- Table 2: Global Farming Robots and Mechatronics Industry Revenue billion Forecast, by Consumption Analysis 2020 & 2033
- Table 3: Global Farming Robots and Mechatronics Industry Revenue billion Forecast, by Import Market Analysis (Value & Volume) 2020 & 2033
- Table 4: Global Farming Robots and Mechatronics Industry Revenue billion Forecast, by Export Market Analysis (Value & Volume) 2020 & 2033
- Table 5: Global Farming Robots and Mechatronics Industry Revenue billion Forecast, by Price Trend Analysis 2020 & 2033
- Table 6: Global Farming Robots and Mechatronics Industry Revenue billion Forecast, by Region 2020 & 2033
- Table 7: Global Farming Robots and Mechatronics Industry Revenue billion Forecast, by Production Analysis 2020 & 2033
- Table 8: Global Farming Robots and Mechatronics Industry Revenue billion Forecast, by Consumption Analysis 2020 & 2033
- Table 9: Global Farming Robots and Mechatronics Industry Revenue billion Forecast, by Import Market Analysis (Value & Volume) 2020 & 2033
- Table 10: Global Farming Robots and Mechatronics Industry Revenue billion Forecast, by Export Market Analysis (Value & Volume) 2020 & 2033
- Table 11: Global Farming Robots and Mechatronics Industry Revenue billion Forecast, by Price Trend Analysis 2020 & 2033
- Table 12: Global Farming Robots and Mechatronics Industry Revenue billion Forecast, by Country 2020 & 2033
- Table 13: United States Farming Robots and Mechatronics Industry Revenue (billion) Forecast, by Application 2020 & 2033
- Table 14: Canada Farming Robots and Mechatronics Industry Revenue (billion) Forecast, by Application 2020 & 2033
- Table 15: Mexico Farming Robots and Mechatronics Industry Revenue (billion) Forecast, by Application 2020 & 2033
- Table 16: Global Farming Robots and Mechatronics Industry Revenue billion Forecast, by Production Analysis 2020 & 2033
- Table 17: Global Farming Robots and Mechatronics Industry Revenue billion Forecast, by Consumption Analysis 2020 & 2033
- Table 18: Global Farming Robots and Mechatronics Industry Revenue billion Forecast, by Import Market Analysis (Value & Volume) 2020 & 2033
- Table 19: Global Farming Robots and Mechatronics Industry Revenue billion Forecast, by Export Market Analysis (Value & Volume) 2020 & 2033
- Table 20: Global Farming Robots and Mechatronics Industry Revenue billion Forecast, by Price Trend Analysis 2020 & 2033
- Table 21: Global Farming Robots and Mechatronics Industry Revenue billion Forecast, by Country 2020 & 2033
- Table 22: Brazil Farming Robots and Mechatronics Industry Revenue (billion) Forecast, by Application 2020 & 2033
- Table 23: Argentina Farming Robots and Mechatronics Industry Revenue (billion) Forecast, by Application 2020 & 2033
- Table 24: Rest of South America Farming Robots and Mechatronics Industry Revenue (billion) Forecast, by Application 2020 & 2033
- Table 25: Global Farming Robots and Mechatronics Industry Revenue billion Forecast, by Production Analysis 2020 & 2033
- Table 26: Global Farming Robots and Mechatronics Industry Revenue billion Forecast, by Consumption Analysis 2020 & 2033
- Table 27: Global Farming Robots and Mechatronics Industry Revenue billion Forecast, by Import Market Analysis (Value & Volume) 2020 & 2033
- Table 28: Global Farming Robots and Mechatronics Industry Revenue billion Forecast, by Export Market Analysis (Value & Volume) 2020 & 2033
- Table 29: Global Farming Robots and Mechatronics Industry Revenue billion Forecast, by Price Trend Analysis 2020 & 2033
- Table 30: Global Farming Robots and Mechatronics Industry Revenue billion Forecast, by Country 2020 & 2033
- Table 31: United Kingdom Farming Robots and Mechatronics Industry Revenue (billion) Forecast, by Application 2020 & 2033
- Table 32: Germany Farming Robots and Mechatronics Industry Revenue (billion) Forecast, by Application 2020 & 2033
- Table 33: France Farming Robots and Mechatronics Industry Revenue (billion) Forecast, by Application 2020 & 2033
- Table 34: Italy Farming Robots and Mechatronics Industry Revenue (billion) Forecast, by Application 2020 & 2033
- Table 35: Spain Farming Robots and Mechatronics Industry Revenue (billion) Forecast, by Application 2020 & 2033
- Table 36: Russia Farming Robots and Mechatronics Industry Revenue (billion) Forecast, by Application 2020 & 2033
- Table 37: Benelux Farming Robots and Mechatronics Industry Revenue (billion) Forecast, by Application 2020 & 2033
- Table 38: Nordics Farming Robots and Mechatronics Industry Revenue (billion) Forecast, by Application 2020 & 2033
- Table 39: Rest of Europe Farming Robots and Mechatronics Industry Revenue (billion) Forecast, by Application 2020 & 2033
- Table 40: Global Farming Robots and Mechatronics Industry Revenue billion Forecast, by Production Analysis 2020 & 2033
- Table 41: Global Farming Robots and Mechatronics Industry Revenue billion Forecast, by Consumption Analysis 2020 & 2033
- Table 42: Global Farming Robots and Mechatronics Industry Revenue billion Forecast, by Import Market Analysis (Value & Volume) 2020 & 2033
- Table 43: Global Farming Robots and Mechatronics Industry Revenue billion Forecast, by Export Market Analysis (Value & Volume) 2020 & 2033
- Table 44: Global Farming Robots and Mechatronics Industry Revenue billion Forecast, by Price Trend Analysis 2020 & 2033
- Table 45: Global Farming Robots and Mechatronics Industry Revenue billion Forecast, by Country 2020 & 2033
- Table 46: Turkey Farming Robots and Mechatronics Industry Revenue (billion) Forecast, by Application 2020 & 2033
- Table 47: Israel Farming Robots and Mechatronics Industry Revenue (billion) Forecast, by Application 2020 & 2033
- Table 48: GCC Farming Robots and Mechatronics Industry Revenue (billion) Forecast, by Application 2020 & 2033
- Table 49: North Africa Farming Robots and Mechatronics Industry Revenue (billion) Forecast, by Application 2020 & 2033
- Table 50: South Africa Farming Robots and Mechatronics Industry Revenue (billion) Forecast, by Application 2020 & 2033
- Table 51: Rest of Middle East & Africa Farming Robots and Mechatronics Industry Revenue (billion) Forecast, by Application 2020 & 2033
- Table 52: Global Farming Robots and Mechatronics Industry Revenue billion Forecast, by Production Analysis 2020 & 2033
- Table 53: Global Farming Robots and Mechatronics Industry Revenue billion Forecast, by Consumption Analysis 2020 & 2033
- Table 54: Global Farming Robots and Mechatronics Industry Revenue billion Forecast, by Import Market Analysis (Value & Volume) 2020 & 2033
- Table 55: Global Farming Robots and Mechatronics Industry Revenue billion Forecast, by Export Market Analysis (Value & Volume) 2020 & 2033
- Table 56: Global Farming Robots and Mechatronics Industry Revenue billion Forecast, by Price Trend Analysis 2020 & 2033
- Table 57: Global Farming Robots and Mechatronics Industry Revenue billion Forecast, by Country 2020 & 2033
- Table 58: China Farming Robots and Mechatronics Industry Revenue (billion) Forecast, by Application 2020 & 2033
- Table 59: India Farming Robots and Mechatronics Industry Revenue (billion) Forecast, by Application 2020 & 2033
- Table 60: Japan Farming Robots and Mechatronics Industry Revenue (billion) Forecast, by Application 2020 & 2033
- Table 61: South Korea Farming Robots and Mechatronics Industry Revenue (billion) Forecast, by Application 2020 & 2033
- Table 62: ASEAN Farming Robots and Mechatronics Industry Revenue (billion) Forecast, by Application 2020 & 2033
- Table 63: Oceania Farming Robots and Mechatronics Industry Revenue (billion) Forecast, by Application 2020 & 2033
- Table 64: Rest of Asia Pacific Farming Robots and Mechatronics Industry Revenue (billion) Forecast, by Application 2020 & 2033
Frequently Asked Questions
1. What is the projected Compound Annual Growth Rate (CAGR) of the Farming Robots and Mechatronics Industry?
The projected CAGR is approximately 26%.
2. Which companies are prominent players in the Farming Robots and Mechatronics Industry?
Key companies in the market include AgEagle Aerial Systems, PrecisionHawk, SenseFly, Vitirover, Deere & Company, Autonomous Tractor Corporation, Wall-Ye, Vision Robotics Corporation, Lely Industries N V, Conic System, AutoProbe Technologies, Harvest Automation Inc, A/S S A Christensen & Co (SAC Milking), GEA Group Aktiengesellschaft, Yamaha Motor Co Ltd*List Not Exhaustive, Tetra Laval(DeLaval Inc ), EcoRobotix Ltd, Autonomous Solutions (ASI), Naio Technologies, Clearpath Robotics Inc, BouMatic Robotics.
3. What are the main segments of the Farming Robots and Mechatronics Industry?
The market segments include Production Analysis, Consumption Analysis, Import Market Analysis (Value & Volume), Export Market Analysis (Value & Volume), Price Trend Analysis.
4. Can you provide details about the market size?
The market size is estimated to be USD 17.73 billion as of 2022.
5. What are some drivers contributing to market growth?
Increasing Demand for Tomato; Adoption of Greenhouse Technology in Tomato Cultivation; Government support.
6. What are the notable trends driving market growth?
Shortage and Cost of Labor is Driving the Market.
7. Are there any restraints impacting market growth?
Increasing Loses due to Physiological Disorder. Pest and Disease; Unfavourable Climatic Condition.
8. Can you provide examples of recent developments in the market?
February 2023: Yamaha Motor Co., Ltd has announced that it has established a new company in Singapore aimed at expanding its business in Southeast Asia and India, where demand for robots is growing, and intends to secure new clients, as well as provide high-quality after-sales services in line with international standards. The Company will also strengthen its distributor support system while working to expand its distributor network.
9. What pricing options are available for accessing the report?
Pricing options include single-user, multi-user, and enterprise licenses priced at USD 3800, USD 4500, and USD 5800 respectively.
10. Is the market size provided in terms of value or volume?
The market size is provided in terms of value, measured in billion.
11. Are there any specific market keywords associated with the report?
Yes, the market keyword associated with the report is "Farming Robots and Mechatronics Industry," which aids in identifying and referencing the specific market segment covered.
12. How do I determine which pricing option suits my needs best?
The pricing options vary based on user requirements and access needs. Individual users may opt for single-user licenses, while businesses requiring broader access may choose multi-user or enterprise licenses for cost-effective access to the report.
13. Are there any additional resources or data provided in the Farming Robots and Mechatronics Industry report?
While the report offers comprehensive insights, it's advisable to review the specific contents or supplementary materials provided to ascertain if additional resources or data are available.
14. How can I stay updated on further developments or reports in the Farming Robots and Mechatronics Industry?
To stay informed about further developments, trends, and reports in the Farming Robots and Mechatronics Industry, consider subscribing to industry newsletters, following relevant companies and organizations, or regularly checking reputable industry news sources and publications.
Methodology
Step 1 - Identification of Relevant Samples Size from Population Database


Step 2 - Approaches for Defining Global Market Size (Value, Volume* & Price*)

Note*: In applicable scenarios
Step 3 - Data Sources
Primary Research
- Web Analytics
- Survey Reports
- Research Institute
- Latest Research Reports
- Opinion Leaders
Secondary Research
- Annual Reports
- White Paper
- Latest Press Release
- Industry Association
- Paid Database
- Investor Presentations

Step 4 - Data Triangulation
Involves using different sources of information in order to increase the validity of a study
These sources are likely to be stakeholders in a program - participants, other researchers, program staff, other community members, and so on.
Then we put all data in single framework & apply various statistical tools to find out the dynamic on the market.
During the analysis stage, feedback from the stakeholder groups would be compared to determine areas of agreement as well as areas of divergence