APAC Cashew Industry Expected to Reach XXX Million by 2033

APAC Cashew Industry by Production Analysis, by Consumption Analysis, by Import Market Analysis (Value & Volume), by Export Market Analysis (Value & Volume), by Price Trend Analysis, by China, by Vietnam, by India, by Indonesia, by Sri Lanka, by Japan, by Philippines Forecast 2025-2033

Sep 9 2025
Base Year: 2024

180 Pages
Main Logo

APAC Cashew Industry Expected to Reach XXX Million by 2033


Home
Industries
Agriculture
sponsor image

Tailored for you

  • In-depth Analysis Tailored to Specified Regions or Segments
  • Company Profiles Customized to User Preferences
  • Comprehensive Insights Focused on Specific Segments or Regions
  • Customized Evaluation of Competitive Landscape to Meet Your Needs
  • Tailored Customization to Address Other Specific Requirements
Ask for customization


Key Insights

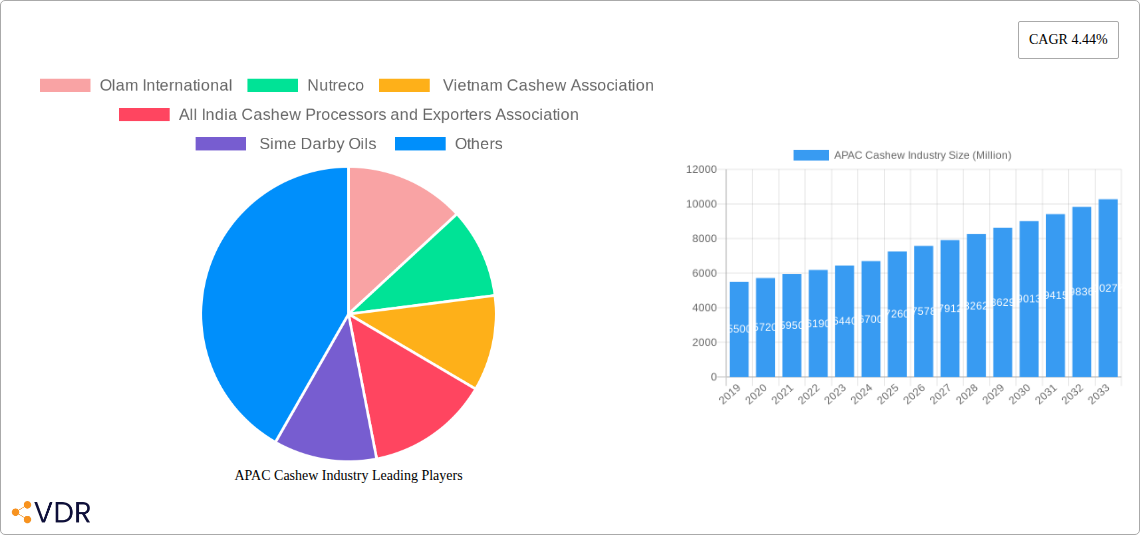
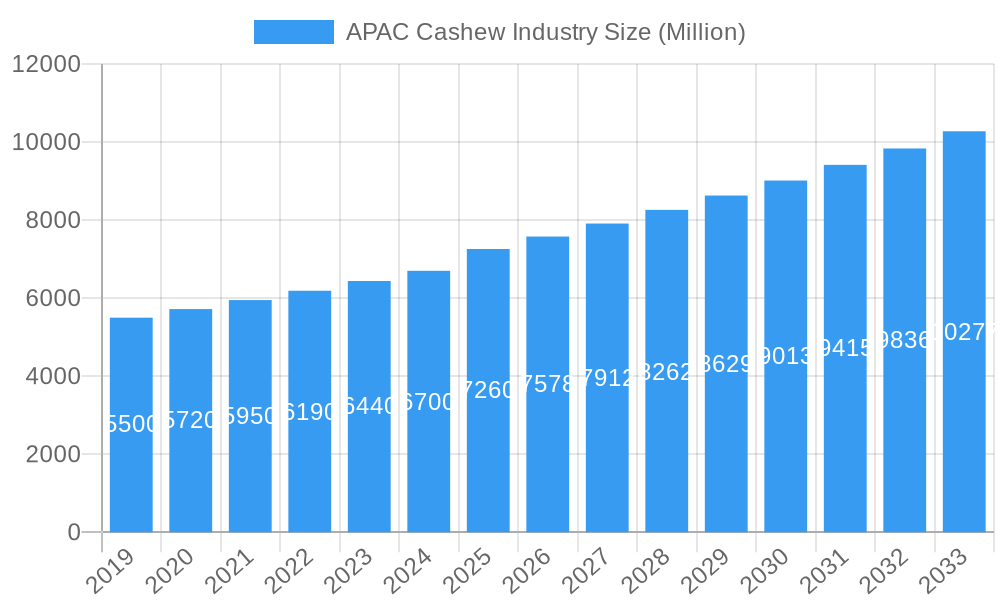
The APAC Cashew Industry is poised for robust expansion, projected to reach a market size of approximately USD 7.26 billion by 2025, with a compelling Compound Annual Growth Rate (CAGR) of 4.44% expected to drive significant value through 2033. This growth trajectory is primarily fueled by escalating consumer demand for healthy and versatile food products, coupled with the increasing adoption of cashews as a key ingredient in confectionery, dairy alternatives, and savory dishes across the region. The burgeoning middle class in countries like India and Vietnam, with their higher disposable incomes, are key contributors to this demand. Furthermore, advancements in cashew processing technologies and a greater focus on sustainable farming practices are enhancing both production efficiency and product quality, further stimulating market penetration. Key industry players are strategically investing in expanding their production capacities and diversifying their product portfolios to cater to evolving consumer preferences, including the growing demand for value-added cashew products such as cashew butter and cashew milk.

Despite the optimistic outlook, the APAC Cashew Industry faces certain headwinds that require strategic navigation. Volatility in raw cashew nut prices, influenced by fluctuating global supply and demand dynamics and adverse weather conditions in key growing regions, presents a significant challenge to price stability and profitability. Additionally, stringent regulatory frameworks and evolving food safety standards in import-dependent nations necessitate continuous adaptation and investment in compliance measures. Labor shortages in some processing hubs and logistical complexities across the vast APAC region can also impact operational efficiency and cost structures. However, the strong underlying demand, driven by health and wellness trends and the increasing versatility of cashews in various culinary applications, is expected to outweigh these restraints. Companies focusing on supply chain optimization, fostering strong farmer relationships, and embracing innovative processing techniques are well-positioned to capitalize on the abundant opportunities within this dynamic market.

APAC Cashew Industry Research Report - Market Size, Growth & Forecast

APAC Cashew Industry Market Dynamics & Structure

The APAC cashew industry is characterized by a moderate to high market concentration, with key players actively shaping its trajectory. Technological innovation in processing techniques and cultivation methods serves as a significant driver, enhancing yield and product quality. Regulatory frameworks, while varying across nations, increasingly focus on sustainable sourcing and fair trade practices, influencing both production and trade. Competitive pressures exist from alternative nut varieties, yet cashews maintain a premium position due to their unique taste and nutritional profile. End-user demographics are diverse, spanning confectioneries, bakery, dairy, and the burgeoning health food segment. Merger and acquisition (M&A) trends, though not extensive, indicate strategic consolidation aimed at expanding market reach and securing supply chains.

  • Market Concentration: Dominated by a few large-scale processors and traders.
  • Technological Drivers: Advanced processing machinery, improved cashew kernel grading, and sustainable farming practices.
  • Regulatory Frameworks: Growing emphasis on food safety standards and import/export regulations.
  • Competitive Substitutes: Almonds, walnuts, and other tree nuts.
  • End-User Segments: Food processing (confectionery, bakery), snack food manufacturers, and the retail consumer.
  • M&A Trends: Strategic acquisitions by major food conglomerates to integrate supply chains.

APAC Cashew Industry Growth Trends & Insights

The APAC cashew industry is poised for substantial expansion, fueled by evolving consumer preferences and robust economic growth across the region. Market size evolution is projected to witness a steady upward trend, driven by increasing demand for healthy snacks and value-added cashew products. Adoption rates for processed and ready-to-eat cashew offerings are accelerating, particularly in urban centers. Technological disruptions, ranging from advanced mechanization in harvesting to sophisticated shelling and grading technologies, are optimizing production efficiency and quality. Consumer behavior shifts are evident, with a growing emphasis on health and wellness, leading to higher consumption of nutrient-rich foods like cashews. The forecast indicates a compound annual growth rate (CAGR) of approximately 6.5% from 2025 to 2033, with market penetration deepening across both developed and emerging economies. This sustained growth is underpinned by an expanding middle class with increased disposable income and a heightened awareness of the health benefits associated with cashew consumption. The parent market of global cashew trade is significantly influenced by APAC's consumption and production dynamics, with the region acting as both a major producer and consumer. The child market segments, such as cashew paste, cashew milk, and cashew butter, are experiencing even faster growth rates as innovative product development caters to niche dietary needs and culinary trends. The increasing availability of fortified cashew products also plays a crucial role in capturing a larger consumer base seeking functional foods.

APAC Cashew Industry Growth

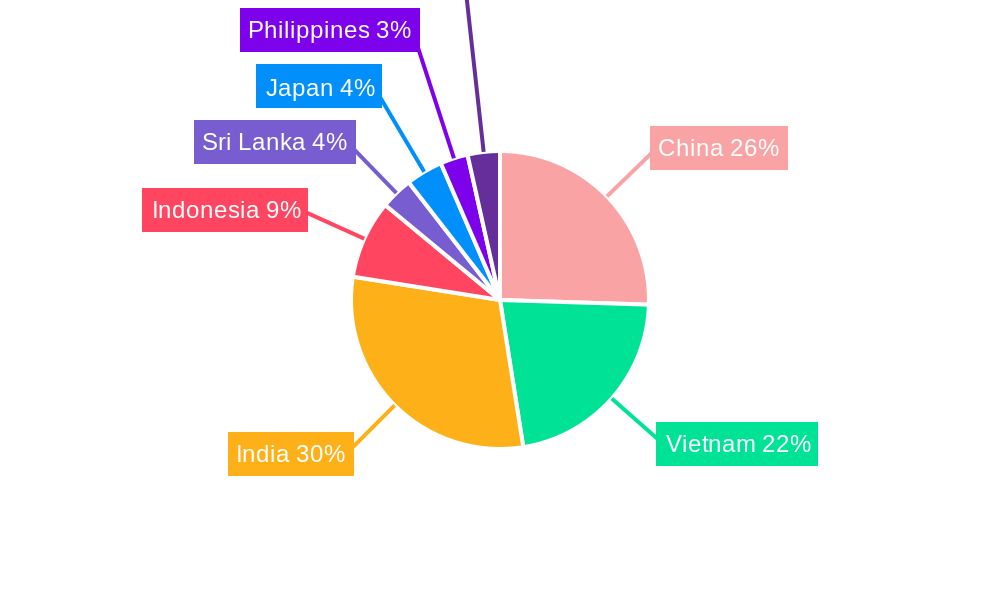
Dominant Regions, Countries, or Segments in APAC Cashew Industry

Vietnam stands out as the undisputed leader in the APAC cashew industry, dominating both production and export volumes. Its strategic location, coupled with a well-established processing infrastructure, has cemented its position. The country's economic policies are highly conducive to agricultural exports, supported by government initiatives aimed at boosting cashew cultivation and processing capabilities.

  • Production Analysis: Vietnam consistently leads APAC in raw cashew nut production, leveraging favorable agro-climatic conditions and extensive farming networks.
  • Consumption Analysis: While Vietnam is a major exporter, domestic consumption is also growing, driven by its own burgeoning food processing industry and increasing local demand for cashew-based snacks and ingredients.
  • Import Market Analysis (Value & Volume): Vietnam's import market primarily comprises raw cashew nuts from other African countries to meet its processing demands, indicating a strong re-export capability. Estimated import volume for 2025 is around xx million units.
  • Export Market Analysis (Value & Volume): Vietnam is the world's largest exporter of processed cashews, with an estimated export volume of 650 million units in 2025. Its processed cashew kernels are highly sought after globally.
  • Price Trend Analysis: While global cashew prices fluctuate based on supply and demand, Vietnam's export pricing remains competitive due to its efficient processing and economies of scale.

Other significant contributors to the APAC cashew landscape include India, which plays a crucial role in cashew processing and consumption. The All India Cashew Processors and Exporters Association actively promotes the industry, with the Indian cashew processing industry extending beyond USD 300,000 million in 2022, a 15% year-on-year growth in revenue. India’s domestic consumption is substantial, driven by traditional culinary uses and a growing snack food market. Initiatives by the Department of Agriculture, Cooperation and Farmers Welfare (DAC&FW) under programs like MIDH and RKVY have led to increased domestic production, with a program approved to extend cashew cultivation by 1.20 lakh hectares.

Indonesia and Philippines are also emerging as significant players, focusing on expanding their cultivation areas and improving processing technologies. The Vietnam Cashew Association plays a pivotal role in shaping Vietnam's dominance and advocating for industry standards. The focus on developing new varieties and investing in processing mills, as seen in Bangladesh through the Department of Agricultural Extension (DAE) efforts, signifies the region's commitment to expanding its cashew footprint.

APAC Cashew Industry Product Landscape

The APAC cashew industry offers a diverse product landscape, ranging from raw and roasted kernels to sophisticated value-added products. Innovations in cashew butter, cashew milk, and cashew-based dairy alternatives are gaining traction, appealing to health-conscious consumers and those with dietary restrictions. Processed cashew ingredients are integral to confectionery, bakery, and savory food formulations. Performance metrics are driven by kernel size, color, and absence of defects, with premium grades commanding higher prices. Technological advancements in roasting and flavoring techniques enhance consumer appeal.

Key Drivers, Barriers & Challenges in APAC Cashew Industry

Key Drivers:

  • Growing Demand for Healthy Snacks: Increased consumer awareness of cashew's nutritional benefits.
  • Rising Disposable Incomes: Enabling higher consumption in emerging economies.
  • Expansion of Food Processing Industry: Driving demand for cashew ingredients.
  • Technological Advancements: Improving cultivation, processing efficiency, and product quality.
  • Government Support: Initiatives promoting cashew cultivation and exports in key producing nations.

Barriers & Challenges:

  • Supply Chain Volatility: Susceptibility to weather patterns and geopolitical instability impacting raw cashew availability.
  • Price Fluctuations: Global commodity price swings affecting profitability.
  • Labor Intensity: Cashew processing remains labor-intensive, leading to higher operational costs.
  • Pest and Disease Outbreaks: Threatening crop yields and quality.
  • Competition from Other Nuts: Intense rivalry from almonds, walnuts, and other edible nuts.
  • Sustainability Concerns: Growing pressure for ethical sourcing and environmentally friendly practices.

Emerging Opportunities in APAC Cashew Industry

Emerging opportunities lie in the development of novel cashew-based functional foods and beverages, catering to the plant-based and clean label trends. Untapped markets in Southeast Asia and Oceania present significant growth potential. Innovative applications in the pharmaceutical and cosmetic industries, leveraging the oleochemical properties of cashew nut shell liquid (CNSL), offer diversification avenues. Evolving consumer preferences for gourmet and exotic flavors in cashew snacks also create niche market openings. The increasing adoption of sustainable farming and processing methods will also unlock opportunities for certified and ethically sourced products.

Growth Accelerators in the APAC Cashew Industry Industry

Long-term growth in the APAC cashew industry will be accelerated by continued investment in research and development for high-yield and disease-resistant cashew varieties. Strategic partnerships between processors, farmers, and technology providers will enhance supply chain efficiency and traceability. Market expansion strategies focused on penetrating underserved urban and rural populations, coupled with aggressive marketing of health benefits, will drive sustained demand. The development of automated processing technologies promises to reduce costs and increase output, further solidifying the region's competitive edge.

Key Players Shaping the APAC Cashew Industry Market

  • Olam International
  • Nutreco
  • Vietnam Cashew Association
  • All India Cashew Processors and Exporters Association
  • Sime Darby Oils

Notable Milestones in APAC Cashew Industry Sector

  • January 2023: According to CRISIL and a branch of S&P Global, the Indian cashew processing industry's revenue extended beyond USD 300,000 million in 2022, marking a 15% year-on-year growth.
  • July 2022: The Department of Agriculture, Cooperation and Farmers Welfare (DAC&FW) approved a program to extend cashew cultivation by 1.20 lakh hectares, supported by initiatives under MIDH and RKVY, leading to increased domestic production.
  • February 2021: The Department of Agricultural Extension (DAE) of the Ministry of Agriculture focused on increasing cashew cultivation area in Bangladesh through developing new varieties and investing in processing mills.

In-Depth APAC Cashew Industry Market Outlook

The APAC cashew industry's outlook is exceptionally promising, driven by a confluence of factors. The escalating global demand for nutritious food products, coupled with a growing affluent consumer base in Asia, will continue to fuel market expansion. Innovations in processing and product development, particularly in the plant-based and convenience food sectors, represent significant growth catalysts. Strategic investments in sustainable agriculture and advanced manufacturing technologies will enhance both the quality and quantity of cashew supply. Furthermore, favorable government policies and the active participation of key industry players like Olam International and Nutreco will foster a dynamic and resilient market, poised for sustained long-term growth and profitability.

APAC Cashew Industry Segmentation

  • 1. Production Analysis
  • 2. Consumption Analysis
  • 3. Import Market Analysis (Value & Volume)
  • 4. Export Market Analysis (Value & Volume)
  • 5. Price Trend Analysis

APAC Cashew Industry Segmentation By Geography

  • 1. China
  • 2. Vietnam
  • 3. India
  • 4. Indonesia
  • 5. Sri Lanka
  • 6. Japan
  • 7. Philippines
APAC Cashew Industry Regional Share


APAC Cashew Industry REPORT HIGHLIGHTS

AspectsDetails
Study Period 2019-2033
Base Year 2024
Estimated Year 2025
Forecast Period2025-2033
Historical Period2019-2024
Growth RateCAGR of 4.44% from 2019-2033
Segmentation
    • By Production Analysis
    • By Consumption Analysis
    • By Import Market Analysis (Value & Volume)
    • By Export Market Analysis (Value & Volume)
    • By Price Trend Analysis
  • By Geography
    • China
    • Vietnam
    • India
    • Indonesia
    • Sri Lanka
    • Japan
    • Philippines


Table of Contents

  1. 1. Introduction
    • 1.1. Research Scope
    • 1.2. Market Segmentation
    • 1.3. Research Methodology
    • 1.4. Definitions and Assumptions
  2. 2. Executive Summary
    • 2.1. Introduction
  3. 3. Market Dynamics
    • 3.1. Introduction
      • 3.2. Market Drivers
        • 3.2.1. Rising Consumption of Cashew Nuts as a Healthy Snack; Increasing Government initiatives; Growing Cashew Nut Imports in The United States
      • 3.3. Market Restrains
        • 3.3.1. Hazardous Climatic Condition Hinders Cashew Production; Stringent Regulations Related To Food Quality Standards
      • 3.4. Market Trends
        • 3.4.1. Increased Cashew Application in Food Industry to boost the Market
  4. 4. Market Factor Analysis
    • 4.1. Porters Five Forces
    • 4.2. Supply/Value Chain
    • 4.3. PESTEL analysis
    • 4.4. Market Entropy
    • 4.5. Patent/Trademark Analysis
  5. 5. Global APAC Cashew Industry Analysis, Insights and Forecast, 2019-2031
    • 5.1. Market Analysis, Insights and Forecast - by Production Analysis
      • 5.2. Market Analysis, Insights and Forecast - by Consumption Analysis
        • 5.3. Market Analysis, Insights and Forecast - by Import Market Analysis (Value & Volume)
          • 5.4. Market Analysis, Insights and Forecast - by Export Market Analysis (Value & Volume)
            • 5.5. Market Analysis, Insights and Forecast - by Price Trend Analysis
              • 5.6. Market Analysis, Insights and Forecast - by Region
                • 5.6.1. China
                • 5.6.2. Vietnam
                • 5.6.3. India
                • 5.6.4. Indonesia
                • 5.6.5. Sri Lanka
                • 5.6.6. Japan
                • 5.6.7. Philippines
            • 6. China APAC Cashew Industry Analysis, Insights and Forecast, 2019-2031
              • 6.1. Market Analysis, Insights and Forecast - by Production Analysis
                • 6.2. Market Analysis, Insights and Forecast - by Consumption Analysis
                  • 6.3. Market Analysis, Insights and Forecast - by Import Market Analysis (Value & Volume)
                    • 6.4. Market Analysis, Insights and Forecast - by Export Market Analysis (Value & Volume)
                      • 6.5. Market Analysis, Insights and Forecast - by Price Trend Analysis
                      • 7. Vietnam APAC Cashew Industry Analysis, Insights and Forecast, 2019-2031
                        • 7.1. Market Analysis, Insights and Forecast - by Production Analysis
                          • 7.2. Market Analysis, Insights and Forecast - by Consumption Analysis
                            • 7.3. Market Analysis, Insights and Forecast - by Import Market Analysis (Value & Volume)
                              • 7.4. Market Analysis, Insights and Forecast - by Export Market Analysis (Value & Volume)
                                • 7.5. Market Analysis, Insights and Forecast - by Price Trend Analysis
                                • 8. India APAC Cashew Industry Analysis, Insights and Forecast, 2019-2031
                                  • 8.1. Market Analysis, Insights and Forecast - by Production Analysis
                                    • 8.2. Market Analysis, Insights and Forecast - by Consumption Analysis
                                      • 8.3. Market Analysis, Insights and Forecast - by Import Market Analysis (Value & Volume)
                                        • 8.4. Market Analysis, Insights and Forecast - by Export Market Analysis (Value & Volume)
                                          • 8.5. Market Analysis, Insights and Forecast - by Price Trend Analysis
                                          • 9. Indonesia APAC Cashew Industry Analysis, Insights and Forecast, 2019-2031
                                            • 9.1. Market Analysis, Insights and Forecast - by Production Analysis
                                              • 9.2. Market Analysis, Insights and Forecast - by Consumption Analysis
                                                • 9.3. Market Analysis, Insights and Forecast - by Import Market Analysis (Value & Volume)
                                                  • 9.4. Market Analysis, Insights and Forecast - by Export Market Analysis (Value & Volume)
                                                    • 9.5. Market Analysis, Insights and Forecast - by Price Trend Analysis
                                                    • 10. Sri Lanka APAC Cashew Industry Analysis, Insights and Forecast, 2019-2031
                                                      • 10.1. Market Analysis, Insights and Forecast - by Production Analysis
                                                        • 10.2. Market Analysis, Insights and Forecast - by Consumption Analysis
                                                          • 10.3. Market Analysis, Insights and Forecast - by Import Market Analysis (Value & Volume)
                                                            • 10.4. Market Analysis, Insights and Forecast - by Export Market Analysis (Value & Volume)
                                                              • 10.5. Market Analysis, Insights and Forecast - by Price Trend Analysis
                                                              • 11. Japan APAC Cashew Industry Analysis, Insights and Forecast, 2019-2031
                                                                • 11.1. Market Analysis, Insights and Forecast - by Production Analysis
                                                                  • 11.2. Market Analysis, Insights and Forecast - by Consumption Analysis
                                                                    • 11.3. Market Analysis, Insights and Forecast - by Import Market Analysis (Value & Volume)
                                                                      • 11.4. Market Analysis, Insights and Forecast - by Export Market Analysis (Value & Volume)
                                                                        • 11.5. Market Analysis, Insights and Forecast - by Price Trend Analysis
                                                                        • 12. Philippines APAC Cashew Industry Analysis, Insights and Forecast, 2019-2031
                                                                          • 12.1. Market Analysis, Insights and Forecast - by Production Analysis
                                                                            • 12.2. Market Analysis, Insights and Forecast - by Consumption Analysis
                                                                              • 12.3. Market Analysis, Insights and Forecast - by Import Market Analysis (Value & Volume)
                                                                                • 12.4. Market Analysis, Insights and Forecast - by Export Market Analysis (Value & Volume)
                                                                                  • 12.5. Market Analysis, Insights and Forecast - by Price Trend Analysis
                                                                                  • 13. China APAC Cashew Industry Analysis, Insights and Forecast, 2019-2031
                                                                                    • 14. Japan APAC Cashew Industry Analysis, Insights and Forecast, 2019-2031
                                                                                      • 15. India APAC Cashew Industry Analysis, Insights and Forecast, 2019-2031
                                                                                        • 16. South Korea APAC Cashew Industry Analysis, Insights and Forecast, 2019-2031
                                                                                          • 17. Taiwan APAC Cashew Industry Analysis, Insights and Forecast, 2019-2031
                                                                                            • 18. Australia APAC Cashew Industry Analysis, Insights and Forecast, 2019-2031
                                                                                              • 19. Rest of Asia-Pacific APAC Cashew Industry Analysis, Insights and Forecast, 2019-2031
                                                                                                • 20. Competitive Analysis
                                                                                                  • 20.1. Global Market Share Analysis 2024
                                                                                                    • 20.2. Company Profiles
                                                                                                      • 20.2.1 Olam International
                                                                                                        • 20.2.1.1. Overview
                                                                                                        • 20.2.1.2. Products
                                                                                                        • 20.2.1.3. SWOT Analysis
                                                                                                        • 20.2.1.4. Recent Developments
                                                                                                        • 20.2.1.5. Financials (Based on Availability)
                                                                                                      • 20.2.2 Nutreco
                                                                                                        • 20.2.2.1. Overview
                                                                                                        • 20.2.2.2. Products
                                                                                                        • 20.2.2.3. SWOT Analysis
                                                                                                        • 20.2.2.4. Recent Developments
                                                                                                        • 20.2.2.5. Financials (Based on Availability)
                                                                                                      • 20.2.3 Vietnam Cashew Association
                                                                                                        • 20.2.3.1. Overview
                                                                                                        • 20.2.3.2. Products
                                                                                                        • 20.2.3.3. SWOT Analysis
                                                                                                        • 20.2.3.4. Recent Developments
                                                                                                        • 20.2.3.5. Financials (Based on Availability)
                                                                                                      • 20.2.4 All India Cashew Processors and Exporters Association
                                                                                                        • 20.2.4.1. Overview
                                                                                                        • 20.2.4.2. Products
                                                                                                        • 20.2.4.3. SWOT Analysis
                                                                                                        • 20.2.4.4. Recent Developments
                                                                                                        • 20.2.4.5. Financials (Based on Availability)
                                                                                                      • 20.2.5 Sime Darby Oils
                                                                                                        • 20.2.5.1. Overview
                                                                                                        • 20.2.5.2. Products
                                                                                                        • 20.2.5.3. SWOT Analysis
                                                                                                        • 20.2.5.4. Recent Developments
                                                                                                        • 20.2.5.5. Financials (Based on Availability)

                                                                                                List of Figures

                                                                                                1. Figure 1: Global APAC Cashew Industry Revenue Breakdown (Million, %) by Region 2024 & 2032
                                                                                                2. Figure 2: Global APAC Cashew Industry Volume Breakdown (Kiloton, %) by Region 2024 & 2032
                                                                                                3. Figure 3: Asia Pacific APAC Cashew Industry Revenue (Million), by Country 2024 & 2032
                                                                                                4. Figure 4: Asia Pacific APAC Cashew Industry Volume (Kiloton), by Country 2024 & 2032
                                                                                                5. Figure 5: Asia Pacific APAC Cashew Industry Revenue Share (%), by Country 2024 & 2032
                                                                                                6. Figure 6: Asia Pacific APAC Cashew Industry Volume Share (%), by Country 2024 & 2032
                                                                                                7. Figure 7: China APAC Cashew Industry Revenue (Million), by Production Analysis 2024 & 2032
                                                                                                8. Figure 8: China APAC Cashew Industry Volume (Kiloton), by Production Analysis 2024 & 2032
                                                                                                9. Figure 9: China APAC Cashew Industry Revenue Share (%), by Production Analysis 2024 & 2032
                                                                                                10. Figure 10: China APAC Cashew Industry Volume Share (%), by Production Analysis 2024 & 2032
                                                                                                11. Figure 11: China APAC Cashew Industry Revenue (Million), by Consumption Analysis 2024 & 2032
                                                                                                12. Figure 12: China APAC Cashew Industry Volume (Kiloton), by Consumption Analysis 2024 & 2032
                                                                                                13. Figure 13: China APAC Cashew Industry Revenue Share (%), by Consumption Analysis 2024 & 2032
                                                                                                14. Figure 14: China APAC Cashew Industry Volume Share (%), by Consumption Analysis 2024 & 2032
                                                                                                15. Figure 15: China APAC Cashew Industry Revenue (Million), by Import Market Analysis (Value & Volume) 2024 & 2032
                                                                                                16. Figure 16: China APAC Cashew Industry Volume (Kiloton), by Import Market Analysis (Value & Volume) 2024 & 2032
                                                                                                17. Figure 17: China APAC Cashew Industry Revenue Share (%), by Import Market Analysis (Value & Volume) 2024 & 2032
                                                                                                18. Figure 18: China APAC Cashew Industry Volume Share (%), by Import Market Analysis (Value & Volume) 2024 & 2032
                                                                                                19. Figure 19: China APAC Cashew Industry Revenue (Million), by Export Market Analysis (Value & Volume) 2024 & 2032
                                                                                                20. Figure 20: China APAC Cashew Industry Volume (Kiloton), by Export Market Analysis (Value & Volume) 2024 & 2032
                                                                                                21. Figure 21: China APAC Cashew Industry Revenue Share (%), by Export Market Analysis (Value & Volume) 2024 & 2032
                                                                                                22. Figure 22: China APAC Cashew Industry Volume Share (%), by Export Market Analysis (Value & Volume) 2024 & 2032
                                                                                                23. Figure 23: China APAC Cashew Industry Revenue (Million), by Price Trend Analysis 2024 & 2032
                                                                                                24. Figure 24: China APAC Cashew Industry Volume (Kiloton), by Price Trend Analysis 2024 & 2032
                                                                                                25. Figure 25: China APAC Cashew Industry Revenue Share (%), by Price Trend Analysis 2024 & 2032
                                                                                                26. Figure 26: China APAC Cashew Industry Volume Share (%), by Price Trend Analysis 2024 & 2032
                                                                                                27. Figure 27: China APAC Cashew Industry Revenue (Million), by Country 2024 & 2032
                                                                                                28. Figure 28: China APAC Cashew Industry Volume (Kiloton), by Country 2024 & 2032
                                                                                                29. Figure 29: China APAC Cashew Industry Revenue Share (%), by Country 2024 & 2032
                                                                                                30. Figure 30: China APAC Cashew Industry Volume Share (%), by Country 2024 & 2032
                                                                                                31. Figure 31: Vietnam APAC Cashew Industry Revenue (Million), by Production Analysis 2024 & 2032
                                                                                                32. Figure 32: Vietnam APAC Cashew Industry Volume (Kiloton), by Production Analysis 2024 & 2032
                                                                                                33. Figure 33: Vietnam APAC Cashew Industry Revenue Share (%), by Production Analysis 2024 & 2032
                                                                                                34. Figure 34: Vietnam APAC Cashew Industry Volume Share (%), by Production Analysis 2024 & 2032
                                                                                                35. Figure 35: Vietnam APAC Cashew Industry Revenue (Million), by Consumption Analysis 2024 & 2032
                                                                                                36. Figure 36: Vietnam APAC Cashew Industry Volume (Kiloton), by Consumption Analysis 2024 & 2032
                                                                                                37. Figure 37: Vietnam APAC Cashew Industry Revenue Share (%), by Consumption Analysis 2024 & 2032
                                                                                                38. Figure 38: Vietnam APAC Cashew Industry Volume Share (%), by Consumption Analysis 2024 & 2032
                                                                                                39. Figure 39: Vietnam APAC Cashew Industry Revenue (Million), by Import Market Analysis (Value & Volume) 2024 & 2032
                                                                                                40. Figure 40: Vietnam APAC Cashew Industry Volume (Kiloton), by Import Market Analysis (Value & Volume) 2024 & 2032
                                                                                                41. Figure 41: Vietnam APAC Cashew Industry Revenue Share (%), by Import Market Analysis (Value & Volume) 2024 & 2032
                                                                                                42. Figure 42: Vietnam APAC Cashew Industry Volume Share (%), by Import Market Analysis (Value & Volume) 2024 & 2032
                                                                                                43. Figure 43: Vietnam APAC Cashew Industry Revenue (Million), by Export Market Analysis (Value & Volume) 2024 & 2032
                                                                                                44. Figure 44: Vietnam APAC Cashew Industry Volume (Kiloton), by Export Market Analysis (Value & Volume) 2024 & 2032
                                                                                                45. Figure 45: Vietnam APAC Cashew Industry Revenue Share (%), by Export Market Analysis (Value & Volume) 2024 & 2032
                                                                                                46. Figure 46: Vietnam APAC Cashew Industry Volume Share (%), by Export Market Analysis (Value & Volume) 2024 & 2032
                                                                                                47. Figure 47: Vietnam APAC Cashew Industry Revenue (Million), by Price Trend Analysis 2024 & 2032
                                                                                                48. Figure 48: Vietnam APAC Cashew Industry Volume (Kiloton), by Price Trend Analysis 2024 & 2032
                                                                                                49. Figure 49: Vietnam APAC Cashew Industry Revenue Share (%), by Price Trend Analysis 2024 & 2032
                                                                                                50. Figure 50: Vietnam APAC Cashew Industry Volume Share (%), by Price Trend Analysis 2024 & 2032
                                                                                                51. Figure 51: Vietnam APAC Cashew Industry Revenue (Million), by Country 2024 & 2032
                                                                                                52. Figure 52: Vietnam APAC Cashew Industry Volume (Kiloton), by Country 2024 & 2032
                                                                                                53. Figure 53: Vietnam APAC Cashew Industry Revenue Share (%), by Country 2024 & 2032
                                                                                                54. Figure 54: Vietnam APAC Cashew Industry Volume Share (%), by Country 2024 & 2032
                                                                                                55. Figure 55: India APAC Cashew Industry Revenue (Million), by Production Analysis 2024 & 2032
                                                                                                56. Figure 56: India APAC Cashew Industry Volume (Kiloton), by Production Analysis 2024 & 2032
                                                                                                57. Figure 57: India APAC Cashew Industry Revenue Share (%), by Production Analysis 2024 & 2032
                                                                                                58. Figure 58: India APAC Cashew Industry Volume Share (%), by Production Analysis 2024 & 2032
                                                                                                59. Figure 59: India APAC Cashew Industry Revenue (Million), by Consumption Analysis 2024 & 2032
                                                                                                60. Figure 60: India APAC Cashew Industry Volume (Kiloton), by Consumption Analysis 2024 & 2032
                                                                                                61. Figure 61: India APAC Cashew Industry Revenue Share (%), by Consumption Analysis 2024 & 2032
                                                                                                62. Figure 62: India APAC Cashew Industry Volume Share (%), by Consumption Analysis 2024 & 2032
                                                                                                63. Figure 63: India APAC Cashew Industry Revenue (Million), by Import Market Analysis (Value & Volume) 2024 & 2032
                                                                                                64. Figure 64: India APAC Cashew Industry Volume (Kiloton), by Import Market Analysis (Value & Volume) 2024 & 2032
                                                                                                65. Figure 65: India APAC Cashew Industry Revenue Share (%), by Import Market Analysis (Value & Volume) 2024 & 2032
                                                                                                66. Figure 66: India APAC Cashew Industry Volume Share (%), by Import Market Analysis (Value & Volume) 2024 & 2032
                                                                                                67. Figure 67: India APAC Cashew Industry Revenue (Million), by Export Market Analysis (Value & Volume) 2024 & 2032
                                                                                                68. Figure 68: India APAC Cashew Industry Volume (Kiloton), by Export Market Analysis (Value & Volume) 2024 & 2032
                                                                                                69. Figure 69: India APAC Cashew Industry Revenue Share (%), by Export Market Analysis (Value & Volume) 2024 & 2032
                                                                                                70. Figure 70: India APAC Cashew Industry Volume Share (%), by Export Market Analysis (Value & Volume) 2024 & 2032
                                                                                                71. Figure 71: India APAC Cashew Industry Revenue (Million), by Price Trend Analysis 2024 & 2032
                                                                                                72. Figure 72: India APAC Cashew Industry Volume (Kiloton), by Price Trend Analysis 2024 & 2032
                                                                                                73. Figure 73: India APAC Cashew Industry Revenue Share (%), by Price Trend Analysis 2024 & 2032
                                                                                                74. Figure 74: India APAC Cashew Industry Volume Share (%), by Price Trend Analysis 2024 & 2032
                                                                                                75. Figure 75: India APAC Cashew Industry Revenue (Million), by Country 2024 & 2032
                                                                                                76. Figure 76: India APAC Cashew Industry Volume (Kiloton), by Country 2024 & 2032
                                                                                                77. Figure 77: India APAC Cashew Industry Revenue Share (%), by Country 2024 & 2032
                                                                                                78. Figure 78: India APAC Cashew Industry Volume Share (%), by Country 2024 & 2032
                                                                                                79. Figure 79: Indonesia APAC Cashew Industry Revenue (Million), by Production Analysis 2024 & 2032
                                                                                                80. Figure 80: Indonesia APAC Cashew Industry Volume (Kiloton), by Production Analysis 2024 & 2032
                                                                                                81. Figure 81: Indonesia APAC Cashew Industry Revenue Share (%), by Production Analysis 2024 & 2032
                                                                                                82. Figure 82: Indonesia APAC Cashew Industry Volume Share (%), by Production Analysis 2024 & 2032
                                                                                                83. Figure 83: Indonesia APAC Cashew Industry Revenue (Million), by Consumption Analysis 2024 & 2032
                                                                                                84. Figure 84: Indonesia APAC Cashew Industry Volume (Kiloton), by Consumption Analysis 2024 & 2032
                                                                                                85. Figure 85: Indonesia APAC Cashew Industry Revenue Share (%), by Consumption Analysis 2024 & 2032
                                                                                                86. Figure 86: Indonesia APAC Cashew Industry Volume Share (%), by Consumption Analysis 2024 & 2032
                                                                                                87. Figure 87: Indonesia APAC Cashew Industry Revenue (Million), by Import Market Analysis (Value & Volume) 2024 & 2032
                                                                                                88. Figure 88: Indonesia APAC Cashew Industry Volume (Kiloton), by Import Market Analysis (Value & Volume) 2024 & 2032
                                                                                                89. Figure 89: Indonesia APAC Cashew Industry Revenue Share (%), by Import Market Analysis (Value & Volume) 2024 & 2032
                                                                                                90. Figure 90: Indonesia APAC Cashew Industry Volume Share (%), by Import Market Analysis (Value & Volume) 2024 & 2032
                                                                                                91. Figure 91: Indonesia APAC Cashew Industry Revenue (Million), by Export Market Analysis (Value & Volume) 2024 & 2032
                                                                                                92. Figure 92: Indonesia APAC Cashew Industry Volume (Kiloton), by Export Market Analysis (Value & Volume) 2024 & 2032
                                                                                                93. Figure 93: Indonesia APAC Cashew Industry Revenue Share (%), by Export Market Analysis (Value & Volume) 2024 & 2032
                                                                                                94. Figure 94: Indonesia APAC Cashew Industry Volume Share (%), by Export Market Analysis (Value & Volume) 2024 & 2032
                                                                                                95. Figure 95: Indonesia APAC Cashew Industry Revenue (Million), by Price Trend Analysis 2024 & 2032
                                                                                                96. Figure 96: Indonesia APAC Cashew Industry Volume (Kiloton), by Price Trend Analysis 2024 & 2032
                                                                                                97. Figure 97: Indonesia APAC Cashew Industry Revenue Share (%), by Price Trend Analysis 2024 & 2032
                                                                                                98. Figure 98: Indonesia APAC Cashew Industry Volume Share (%), by Price Trend Analysis 2024 & 2032
                                                                                                99. Figure 99: Indonesia APAC Cashew Industry Revenue (Million), by Country 2024 & 2032
                                                                                                100. Figure 100: Indonesia APAC Cashew Industry Volume (Kiloton), by Country 2024 & 2032
                                                                                                101. Figure 101: Indonesia APAC Cashew Industry Revenue Share (%), by Country 2024 & 2032
                                                                                                102. Figure 102: Indonesia APAC Cashew Industry Volume Share (%), by Country 2024 & 2032
                                                                                                103. Figure 103: Sri Lanka APAC Cashew Industry Revenue (Million), by Production Analysis 2024 & 2032
                                                                                                104. Figure 104: Sri Lanka APAC Cashew Industry Volume (Kiloton), by Production Analysis 2024 & 2032
                                                                                                105. Figure 105: Sri Lanka APAC Cashew Industry Revenue Share (%), by Production Analysis 2024 & 2032
                                                                                                106. Figure 106: Sri Lanka APAC Cashew Industry Volume Share (%), by Production Analysis 2024 & 2032
                                                                                                107. Figure 107: Sri Lanka APAC Cashew Industry Revenue (Million), by Consumption Analysis 2024 & 2032
                                                                                                108. Figure 108: Sri Lanka APAC Cashew Industry Volume (Kiloton), by Consumption Analysis 2024 & 2032
                                                                                                109. Figure 109: Sri Lanka APAC Cashew Industry Revenue Share (%), by Consumption Analysis 2024 & 2032
                                                                                                110. Figure 110: Sri Lanka APAC Cashew Industry Volume Share (%), by Consumption Analysis 2024 & 2032
                                                                                                111. Figure 111: Sri Lanka APAC Cashew Industry Revenue (Million), by Import Market Analysis (Value & Volume) 2024 & 2032
                                                                                                112. Figure 112: Sri Lanka APAC Cashew Industry Volume (Kiloton), by Import Market Analysis (Value & Volume) 2024 & 2032
                                                                                                113. Figure 113: Sri Lanka APAC Cashew Industry Revenue Share (%), by Import Market Analysis (Value & Volume) 2024 & 2032
                                                                                                114. Figure 114: Sri Lanka APAC Cashew Industry Volume Share (%), by Import Market Analysis (Value & Volume) 2024 & 2032
                                                                                                115. Figure 115: Sri Lanka APAC Cashew Industry Revenue (Million), by Export Market Analysis (Value & Volume) 2024 & 2032
                                                                                                116. Figure 116: Sri Lanka APAC Cashew Industry Volume (Kiloton), by Export Market Analysis (Value & Volume) 2024 & 2032
                                                                                                117. Figure 117: Sri Lanka APAC Cashew Industry Revenue Share (%), by Export Market Analysis (Value & Volume) 2024 & 2032
                                                                                                118. Figure 118: Sri Lanka APAC Cashew Industry Volume Share (%), by Export Market Analysis (Value & Volume) 2024 & 2032
                                                                                                119. Figure 119: Sri Lanka APAC Cashew Industry Revenue (Million), by Price Trend Analysis 2024 & 2032
                                                                                                120. Figure 120: Sri Lanka APAC Cashew Industry Volume (Kiloton), by Price Trend Analysis 2024 & 2032
                                                                                                121. Figure 121: Sri Lanka APAC Cashew Industry Revenue Share (%), by Price Trend Analysis 2024 & 2032
                                                                                                122. Figure 122: Sri Lanka APAC Cashew Industry Volume Share (%), by Price Trend Analysis 2024 & 2032
                                                                                                123. Figure 123: Sri Lanka APAC Cashew Industry Revenue (Million), by Country 2024 & 2032
                                                                                                124. Figure 124: Sri Lanka APAC Cashew Industry Volume (Kiloton), by Country 2024 & 2032
                                                                                                125. Figure 125: Sri Lanka APAC Cashew Industry Revenue Share (%), by Country 2024 & 2032
                                                                                                126. Figure 126: Sri Lanka APAC Cashew Industry Volume Share (%), by Country 2024 & 2032
                                                                                                127. Figure 127: Japan APAC Cashew Industry Revenue (Million), by Production Analysis 2024 & 2032
                                                                                                128. Figure 128: Japan APAC Cashew Industry Volume (Kiloton), by Production Analysis 2024 & 2032
                                                                                                129. Figure 129: Japan APAC Cashew Industry Revenue Share (%), by Production Analysis 2024 & 2032
                                                                                                130. Figure 130: Japan APAC Cashew Industry Volume Share (%), by Production Analysis 2024 & 2032
                                                                                                131. Figure 131: Japan APAC Cashew Industry Revenue (Million), by Consumption Analysis 2024 & 2032
                                                                                                132. Figure 132: Japan APAC Cashew Industry Volume (Kiloton), by Consumption Analysis 2024 & 2032
                                                                                                133. Figure 133: Japan APAC Cashew Industry Revenue Share (%), by Consumption Analysis 2024 & 2032
                                                                                                134. Figure 134: Japan APAC Cashew Industry Volume Share (%), by Consumption Analysis 2024 & 2032
                                                                                                135. Figure 135: Japan APAC Cashew Industry Revenue (Million), by Import Market Analysis (Value & Volume) 2024 & 2032
                                                                                                136. Figure 136: Japan APAC Cashew Industry Volume (Kiloton), by Import Market Analysis (Value & Volume) 2024 & 2032
                                                                                                137. Figure 137: Japan APAC Cashew Industry Revenue Share (%), by Import Market Analysis (Value & Volume) 2024 & 2032
                                                                                                138. Figure 138: Japan APAC Cashew Industry Volume Share (%), by Import Market Analysis (Value & Volume) 2024 & 2032
                                                                                                139. Figure 139: Japan APAC Cashew Industry Revenue (Million), by Export Market Analysis (Value & Volume) 2024 & 2032
                                                                                                140. Figure 140: Japan APAC Cashew Industry Volume (Kiloton), by Export Market Analysis (Value & Volume) 2024 & 2032
                                                                                                141. Figure 141: Japan APAC Cashew Industry Revenue Share (%), by Export Market Analysis (Value & Volume) 2024 & 2032
                                                                                                142. Figure 142: Japan APAC Cashew Industry Volume Share (%), by Export Market Analysis (Value & Volume) 2024 & 2032
                                                                                                143. Figure 143: Japan APAC Cashew Industry Revenue (Million), by Price Trend Analysis 2024 & 2032
                                                                                                144. Figure 144: Japan APAC Cashew Industry Volume (Kiloton), by Price Trend Analysis 2024 & 2032
                                                                                                145. Figure 145: Japan APAC Cashew Industry Revenue Share (%), by Price Trend Analysis 2024 & 2032
                                                                                                146. Figure 146: Japan APAC Cashew Industry Volume Share (%), by Price Trend Analysis 2024 & 2032
                                                                                                147. Figure 147: Japan APAC Cashew Industry Revenue (Million), by Country 2024 & 2032
                                                                                                148. Figure 148: Japan APAC Cashew Industry Volume (Kiloton), by Country 2024 & 2032
                                                                                                149. Figure 149: Japan APAC Cashew Industry Revenue Share (%), by Country 2024 & 2032
                                                                                                150. Figure 150: Japan APAC Cashew Industry Volume Share (%), by Country 2024 & 2032
                                                                                                151. Figure 151: Philippines APAC Cashew Industry Revenue (Million), by Production Analysis 2024 & 2032
                                                                                                152. Figure 152: Philippines APAC Cashew Industry Volume (Kiloton), by Production Analysis 2024 & 2032
                                                                                                153. Figure 153: Philippines APAC Cashew Industry Revenue Share (%), by Production Analysis 2024 & 2032
                                                                                                154. Figure 154: Philippines APAC Cashew Industry Volume Share (%), by Production Analysis 2024 & 2032
                                                                                                155. Figure 155: Philippines APAC Cashew Industry Revenue (Million), by Consumption Analysis 2024 & 2032
                                                                                                156. Figure 156: Philippines APAC Cashew Industry Volume (Kiloton), by Consumption Analysis 2024 & 2032
                                                                                                157. Figure 157: Philippines APAC Cashew Industry Revenue Share (%), by Consumption Analysis 2024 & 2032
                                                                                                158. Figure 158: Philippines APAC Cashew Industry Volume Share (%), by Consumption Analysis 2024 & 2032
                                                                                                159. Figure 159: Philippines APAC Cashew Industry Revenue (Million), by Import Market Analysis (Value & Volume) 2024 & 2032
                                                                                                160. Figure 160: Philippines APAC Cashew Industry Volume (Kiloton), by Import Market Analysis (Value & Volume) 2024 & 2032
                                                                                                161. Figure 161: Philippines APAC Cashew Industry Revenue Share (%), by Import Market Analysis (Value & Volume) 2024 & 2032
                                                                                                162. Figure 162: Philippines APAC Cashew Industry Volume Share (%), by Import Market Analysis (Value & Volume) 2024 & 2032
                                                                                                163. Figure 163: Philippines APAC Cashew Industry Revenue (Million), by Export Market Analysis (Value & Volume) 2024 & 2032
                                                                                                164. Figure 164: Philippines APAC Cashew Industry Volume (Kiloton), by Export Market Analysis (Value & Volume) 2024 & 2032
                                                                                                165. Figure 165: Philippines APAC Cashew Industry Revenue Share (%), by Export Market Analysis (Value & Volume) 2024 & 2032
                                                                                                166. Figure 166: Philippines APAC Cashew Industry Volume Share (%), by Export Market Analysis (Value & Volume) 2024 & 2032
                                                                                                167. Figure 167: Philippines APAC Cashew Industry Revenue (Million), by Price Trend Analysis 2024 & 2032
                                                                                                168. Figure 168: Philippines APAC Cashew Industry Volume (Kiloton), by Price Trend Analysis 2024 & 2032
                                                                                                169. Figure 169: Philippines APAC Cashew Industry Revenue Share (%), by Price Trend Analysis 2024 & 2032
                                                                                                170. Figure 170: Philippines APAC Cashew Industry Volume Share (%), by Price Trend Analysis 2024 & 2032
                                                                                                171. Figure 171: Philippines APAC Cashew Industry Revenue (Million), by Country 2024 & 2032
                                                                                                172. Figure 172: Philippines APAC Cashew Industry Volume (Kiloton), by Country 2024 & 2032
                                                                                                173. Figure 173: Philippines APAC Cashew Industry Revenue Share (%), by Country 2024 & 2032
                                                                                                174. Figure 174: Philippines APAC Cashew Industry Volume Share (%), by Country 2024 & 2032

                                                                                                List of Tables

                                                                                                1. Table 1: Global APAC Cashew Industry Revenue Million Forecast, by Region 2019 & 2032
                                                                                                2. Table 2: Global APAC Cashew Industry Volume Kiloton Forecast, by Region 2019 & 2032
                                                                                                3. Table 3: Global APAC Cashew Industry Revenue Million Forecast, by Production Analysis 2019 & 2032
                                                                                                4. Table 4: Global APAC Cashew Industry Volume Kiloton Forecast, by Production Analysis 2019 & 2032
                                                                                                5. Table 5: Global APAC Cashew Industry Revenue Million Forecast, by Consumption Analysis 2019 & 2032
                                                                                                6. Table 6: Global APAC Cashew Industry Volume Kiloton Forecast, by Consumption Analysis 2019 & 2032
                                                                                                7. Table 7: Global APAC Cashew Industry Revenue Million Forecast, by Import Market Analysis (Value & Volume) 2019 & 2032
                                                                                                8. Table 8: Global APAC Cashew Industry Volume Kiloton Forecast, by Import Market Analysis (Value & Volume) 2019 & 2032
                                                                                                9. Table 9: Global APAC Cashew Industry Revenue Million Forecast, by Export Market Analysis (Value & Volume) 2019 & 2032
                                                                                                10. Table 10: Global APAC Cashew Industry Volume Kiloton Forecast, by Export Market Analysis (Value & Volume) 2019 & 2032
                                                                                                11. Table 11: Global APAC Cashew Industry Revenue Million Forecast, by Price Trend Analysis 2019 & 2032
                                                                                                12. Table 12: Global APAC Cashew Industry Volume Kiloton Forecast, by Price Trend Analysis 2019 & 2032
                                                                                                13. Table 13: Global APAC Cashew Industry Revenue Million Forecast, by Region 2019 & 2032
                                                                                                14. Table 14: Global APAC Cashew Industry Volume Kiloton Forecast, by Region 2019 & 2032
                                                                                                15. Table 15: Global APAC Cashew Industry Revenue Million Forecast, by Country 2019 & 2032
                                                                                                16. Table 16: Global APAC Cashew Industry Volume Kiloton Forecast, by Country 2019 & 2032
                                                                                                17. Table 17: China APAC Cashew Industry Revenue (Million) Forecast, by Application 2019 & 2032
                                                                                                18. Table 18: China APAC Cashew Industry Volume (Kiloton) Forecast, by Application 2019 & 2032
                                                                                                19. Table 19: Japan APAC Cashew Industry Revenue (Million) Forecast, by Application 2019 & 2032
                                                                                                20. Table 20: Japan APAC Cashew Industry Volume (Kiloton) Forecast, by Application 2019 & 2032
                                                                                                21. Table 21: India APAC Cashew Industry Revenue (Million) Forecast, by Application 2019 & 2032
                                                                                                22. Table 22: India APAC Cashew Industry Volume (Kiloton) Forecast, by Application 2019 & 2032
                                                                                                23. Table 23: South Korea APAC Cashew Industry Revenue (Million) Forecast, by Application 2019 & 2032
                                                                                                24. Table 24: South Korea APAC Cashew Industry Volume (Kiloton) Forecast, by Application 2019 & 2032
                                                                                                25. Table 25: Taiwan APAC Cashew Industry Revenue (Million) Forecast, by Application 2019 & 2032
                                                                                                26. Table 26: Taiwan APAC Cashew Industry Volume (Kiloton) Forecast, by Application 2019 & 2032
                                                                                                27. Table 27: Australia APAC Cashew Industry Revenue (Million) Forecast, by Application 2019 & 2032
                                                                                                28. Table 28: Australia APAC Cashew Industry Volume (Kiloton) Forecast, by Application 2019 & 2032
                                                                                                29. Table 29: Rest of Asia-Pacific APAC Cashew Industry Revenue (Million) Forecast, by Application 2019 & 2032
                                                                                                30. Table 30: Rest of Asia-Pacific APAC Cashew Industry Volume (Kiloton) Forecast, by Application 2019 & 2032
                                                                                                31. Table 31: Global APAC Cashew Industry Revenue Million Forecast, by Production Analysis 2019 & 2032
                                                                                                32. Table 32: Global APAC Cashew Industry Volume Kiloton Forecast, by Production Analysis 2019 & 2032
                                                                                                33. Table 33: Global APAC Cashew Industry Revenue Million Forecast, by Consumption Analysis 2019 & 2032
                                                                                                34. Table 34: Global APAC Cashew Industry Volume Kiloton Forecast, by Consumption Analysis 2019 & 2032
                                                                                                35. Table 35: Global APAC Cashew Industry Revenue Million Forecast, by Import Market Analysis (Value & Volume) 2019 & 2032
                                                                                                36. Table 36: Global APAC Cashew Industry Volume Kiloton Forecast, by Import Market Analysis (Value & Volume) 2019 & 2032
                                                                                                37. Table 37: Global APAC Cashew Industry Revenue Million Forecast, by Export Market Analysis (Value & Volume) 2019 & 2032
                                                                                                38. Table 38: Global APAC Cashew Industry Volume Kiloton Forecast, by Export Market Analysis (Value & Volume) 2019 & 2032
                                                                                                39. Table 39: Global APAC Cashew Industry Revenue Million Forecast, by Price Trend Analysis 2019 & 2032
                                                                                                40. Table 40: Global APAC Cashew Industry Volume Kiloton Forecast, by Price Trend Analysis 2019 & 2032
                                                                                                41. Table 41: Global APAC Cashew Industry Revenue Million Forecast, by Country 2019 & 2032
                                                                                                42. Table 42: Global APAC Cashew Industry Volume Kiloton Forecast, by Country 2019 & 2032
                                                                                                43. Table 43: Global APAC Cashew Industry Revenue Million Forecast, by Production Analysis 2019 & 2032
                                                                                                44. Table 44: Global APAC Cashew Industry Volume Kiloton Forecast, by Production Analysis 2019 & 2032
                                                                                                45. Table 45: Global APAC Cashew Industry Revenue Million Forecast, by Consumption Analysis 2019 & 2032
                                                                                                46. Table 46: Global APAC Cashew Industry Volume Kiloton Forecast, by Consumption Analysis 2019 & 2032
                                                                                                47. Table 47: Global APAC Cashew Industry Revenue Million Forecast, by Import Market Analysis (Value & Volume) 2019 & 2032
                                                                                                48. Table 48: Global APAC Cashew Industry Volume Kiloton Forecast, by Import Market Analysis (Value & Volume) 2019 & 2032
                                                                                                49. Table 49: Global APAC Cashew Industry Revenue Million Forecast, by Export Market Analysis (Value & Volume) 2019 & 2032
                                                                                                50. Table 50: Global APAC Cashew Industry Volume Kiloton Forecast, by Export Market Analysis (Value & Volume) 2019 & 2032
                                                                                                51. Table 51: Global APAC Cashew Industry Revenue Million Forecast, by Price Trend Analysis 2019 & 2032
                                                                                                52. Table 52: Global APAC Cashew Industry Volume Kiloton Forecast, by Price Trend Analysis 2019 & 2032
                                                                                                53. Table 53: Global APAC Cashew Industry Revenue Million Forecast, by Country 2019 & 2032
                                                                                                54. Table 54: Global APAC Cashew Industry Volume Kiloton Forecast, by Country 2019 & 2032
                                                                                                55. Table 55: Global APAC Cashew Industry Revenue Million Forecast, by Production Analysis 2019 & 2032
                                                                                                56. Table 56: Global APAC Cashew Industry Volume Kiloton Forecast, by Production Analysis 2019 & 2032
                                                                                                57. Table 57: Global APAC Cashew Industry Revenue Million Forecast, by Consumption Analysis 2019 & 2032
                                                                                                58. Table 58: Global APAC Cashew Industry Volume Kiloton Forecast, by Consumption Analysis 2019 & 2032
                                                                                                59. Table 59: Global APAC Cashew Industry Revenue Million Forecast, by Import Market Analysis (Value & Volume) 2019 & 2032
                                                                                                60. Table 60: Global APAC Cashew Industry Volume Kiloton Forecast, by Import Market Analysis (Value & Volume) 2019 & 2032
                                                                                                61. Table 61: Global APAC Cashew Industry Revenue Million Forecast, by Export Market Analysis (Value & Volume) 2019 & 2032
                                                                                                62. Table 62: Global APAC Cashew Industry Volume Kiloton Forecast, by Export Market Analysis (Value & Volume) 2019 & 2032
                                                                                                63. Table 63: Global APAC Cashew Industry Revenue Million Forecast, by Price Trend Analysis 2019 & 2032
                                                                                                64. Table 64: Global APAC Cashew Industry Volume Kiloton Forecast, by Price Trend Analysis 2019 & 2032
                                                                                                65. Table 65: Global APAC Cashew Industry Revenue Million Forecast, by Country 2019 & 2032
                                                                                                66. Table 66: Global APAC Cashew Industry Volume Kiloton Forecast, by Country 2019 & 2032
                                                                                                67. Table 67: Global APAC Cashew Industry Revenue Million Forecast, by Production Analysis 2019 & 2032
                                                                                                68. Table 68: Global APAC Cashew Industry Volume Kiloton Forecast, by Production Analysis 2019 & 2032
                                                                                                69. Table 69: Global APAC Cashew Industry Revenue Million Forecast, by Consumption Analysis 2019 & 2032
                                                                                                70. Table 70: Global APAC Cashew Industry Volume Kiloton Forecast, by Consumption Analysis 2019 & 2032
                                                                                                71. Table 71: Global APAC Cashew Industry Revenue Million Forecast, by Import Market Analysis (Value & Volume) 2019 & 2032
                                                                                                72. Table 72: Global APAC Cashew Industry Volume Kiloton Forecast, by Import Market Analysis (Value & Volume) 2019 & 2032
                                                                                                73. Table 73: Global APAC Cashew Industry Revenue Million Forecast, by Export Market Analysis (Value & Volume) 2019 & 2032
                                                                                                74. Table 74: Global APAC Cashew Industry Volume Kiloton Forecast, by Export Market Analysis (Value & Volume) 2019 & 2032
                                                                                                75. Table 75: Global APAC Cashew Industry Revenue Million Forecast, by Price Trend Analysis 2019 & 2032
                                                                                                76. Table 76: Global APAC Cashew Industry Volume Kiloton Forecast, by Price Trend Analysis 2019 & 2032
                                                                                                77. Table 77: Global APAC Cashew Industry Revenue Million Forecast, by Country 2019 & 2032
                                                                                                78. Table 78: Global APAC Cashew Industry Volume Kiloton Forecast, by Country 2019 & 2032
                                                                                                79. Table 79: Global APAC Cashew Industry Revenue Million Forecast, by Production Analysis 2019 & 2032
                                                                                                80. Table 80: Global APAC Cashew Industry Volume Kiloton Forecast, by Production Analysis 2019 & 2032
                                                                                                81. Table 81: Global APAC Cashew Industry Revenue Million Forecast, by Consumption Analysis 2019 & 2032
                                                                                                82. Table 82: Global APAC Cashew Industry Volume Kiloton Forecast, by Consumption Analysis 2019 & 2032
                                                                                                83. Table 83: Global APAC Cashew Industry Revenue Million Forecast, by Import Market Analysis (Value & Volume) 2019 & 2032
                                                                                                84. Table 84: Global APAC Cashew Industry Volume Kiloton Forecast, by Import Market Analysis (Value & Volume) 2019 & 2032
                                                                                                85. Table 85: Global APAC Cashew Industry Revenue Million Forecast, by Export Market Analysis (Value & Volume) 2019 & 2032
                                                                                                86. Table 86: Global APAC Cashew Industry Volume Kiloton Forecast, by Export Market Analysis (Value & Volume) 2019 & 2032
                                                                                                87. Table 87: Global APAC Cashew Industry Revenue Million Forecast, by Price Trend Analysis 2019 & 2032
                                                                                                88. Table 88: Global APAC Cashew Industry Volume Kiloton Forecast, by Price Trend Analysis 2019 & 2032
                                                                                                89. Table 89: Global APAC Cashew Industry Revenue Million Forecast, by Country 2019 & 2032
                                                                                                90. Table 90: Global APAC Cashew Industry Volume Kiloton Forecast, by Country 2019 & 2032
                                                                                                91. Table 91: Global APAC Cashew Industry Revenue Million Forecast, by Production Analysis 2019 & 2032
                                                                                                92. Table 92: Global APAC Cashew Industry Volume Kiloton Forecast, by Production Analysis 2019 & 2032
                                                                                                93. Table 93: Global APAC Cashew Industry Revenue Million Forecast, by Consumption Analysis 2019 & 2032
                                                                                                94. Table 94: Global APAC Cashew Industry Volume Kiloton Forecast, by Consumption Analysis 2019 & 2032
                                                                                                95. Table 95: Global APAC Cashew Industry Revenue Million Forecast, by Import Market Analysis (Value & Volume) 2019 & 2032
                                                                                                96. Table 96: Global APAC Cashew Industry Volume Kiloton Forecast, by Import Market Analysis (Value & Volume) 2019 & 2032
                                                                                                97. Table 97: Global APAC Cashew Industry Revenue Million Forecast, by Export Market Analysis (Value & Volume) 2019 & 2032
                                                                                                98. Table 98: Global APAC Cashew Industry Volume Kiloton Forecast, by Export Market Analysis (Value & Volume) 2019 & 2032
                                                                                                99. Table 99: Global APAC Cashew Industry Revenue Million Forecast, by Price Trend Analysis 2019 & 2032
                                                                                                100. Table 100: Global APAC Cashew Industry Volume Kiloton Forecast, by Price Trend Analysis 2019 & 2032
                                                                                                101. Table 101: Global APAC Cashew Industry Revenue Million Forecast, by Country 2019 & 2032
                                                                                                102. Table 102: Global APAC Cashew Industry Volume Kiloton Forecast, by Country 2019 & 2032
                                                                                                103. Table 103: Global APAC Cashew Industry Revenue Million Forecast, by Production Analysis 2019 & 2032
                                                                                                104. Table 104: Global APAC Cashew Industry Volume Kiloton Forecast, by Production Analysis 2019 & 2032
                                                                                                105. Table 105: Global APAC Cashew Industry Revenue Million Forecast, by Consumption Analysis 2019 & 2032
                                                                                                106. Table 106: Global APAC Cashew Industry Volume Kiloton Forecast, by Consumption Analysis 2019 & 2032
                                                                                                107. Table 107: Global APAC Cashew Industry Revenue Million Forecast, by Import Market Analysis (Value & Volume) 2019 & 2032
                                                                                                108. Table 108: Global APAC Cashew Industry Volume Kiloton Forecast, by Import Market Analysis (Value & Volume) 2019 & 2032
                                                                                                109. Table 109: Global APAC Cashew Industry Revenue Million Forecast, by Export Market Analysis (Value & Volume) 2019 & 2032
                                                                                                110. Table 110: Global APAC Cashew Industry Volume Kiloton Forecast, by Export Market Analysis (Value & Volume) 2019 & 2032
                                                                                                111. Table 111: Global APAC Cashew Industry Revenue Million Forecast, by Price Trend Analysis 2019 & 2032
                                                                                                112. Table 112: Global APAC Cashew Industry Volume Kiloton Forecast, by Price Trend Analysis 2019 & 2032
                                                                                                113. Table 113: Global APAC Cashew Industry Revenue Million Forecast, by Country 2019 & 2032
                                                                                                114. Table 114: Global APAC Cashew Industry Volume Kiloton Forecast, by Country 2019 & 2032


                                                                                                Frequently Asked Questions

                                                                                                1. What is the projected Compound Annual Growth Rate (CAGR) of the APAC Cashew Industry?

                                                                                                The projected CAGR is approximately 4.44%.

                                                                                                2. Which companies are prominent players in the APAC Cashew Industry?

                                                                                                Key companies in the market include Olam International, Nutreco, Vietnam Cashew Association , All India Cashew Processors and Exporters Association, Sime Darby Oils .

                                                                                                3. What are the main segments of the APAC Cashew Industry?

                                                                                                The market segments include Production Analysis, Consumption Analysis, Import Market Analysis (Value & Volume), Export Market Analysis (Value & Volume), Price Trend Analysis.

                                                                                                4. Can you provide details about the market size?

                                                                                                The market size is estimated to be USD 7.26 Million as of 2022.

                                                                                                5. What are some drivers contributing to market growth?

                                                                                                Rising Consumption of Cashew Nuts as a Healthy Snack; Increasing Government initiatives; Growing Cashew Nut Imports in The United States.

                                                                                                6. What are the notable trends driving market growth?

                                                                                                Increased Cashew Application in Food Industry to boost the Market.

                                                                                                7. Are there any restraints impacting market growth?

                                                                                                Hazardous Climatic Condition Hinders Cashew Production; Stringent Regulations Related To Food Quality Standards.

                                                                                                8. Can you provide examples of recent developments in the market?

                                                                                                January 2023: According to CRISIL (an Indian consulting firm offering ratings, analysis, risk, and policy advice) and a branch of S&P Global, the Indian cashew processing industry is driving demand for cashews, which extended beyond USD 300,000 million in 2022, an increase of 15% year-on-year growth in revenue.

                                                                                                9. What pricing options are available for accessing the report?

                                                                                                Pricing options include single-user, multi-user, and enterprise licenses priced at USD 4750, USD 5250, and USD 8750 respectively.

                                                                                                10. Is the market size provided in terms of value or volume?

                                                                                                The market size is provided in terms of value, measured in Million and volume, measured in Kiloton.

                                                                                                11. Are there any specific market keywords associated with the report?

                                                                                                Yes, the market keyword associated with the report is "APAC Cashew Industry," which aids in identifying and referencing the specific market segment covered.

                                                                                                12. How do I determine which pricing option suits my needs best?

                                                                                                The pricing options vary based on user requirements and access needs. Individual users may opt for single-user licenses, while businesses requiring broader access may choose multi-user or enterprise licenses for cost-effective access to the report.

                                                                                                13. Are there any additional resources or data provided in the APAC Cashew Industry report?

                                                                                                While the report offers comprehensive insights, it's advisable to review the specific contents or supplementary materials provided to ascertain if additional resources or data are available.

                                                                                                14. How can I stay updated on further developments or reports in the APAC Cashew Industry?

                                                                                                To stay informed about further developments, trends, and reports in the APAC Cashew Industry, consider subscribing to industry newsletters, following relevant companies and organizations, or regularly checking reputable industry news sources and publications.


                                                                                                Methodology

                                                                                                Step 1 - Identification of Relevant Samples Size from Population Database

                                                                                                Step Chart
                                                                                                Bar Chart
                                                                                                Method Chart

                                                                                                Step 2 - Approaches for Defining Global Market Size (Value, Volume* & Price*)

                                                                                                Approach Chart
                                                                                                Top-down and bottom-up approaches are used to validate the global market size and estimate the market size for manufactures, regional segments, product, and application.

                                                                                                Note*: In applicable scenarios

                                                                                                Step 3 - Data Sources

                                                                                                Primary Research

                                                                                                • Web Analytics
                                                                                                • Survey Reports
                                                                                                • Research Institute
                                                                                                • Latest Research Reports
                                                                                                • Opinion Leaders

                                                                                                Secondary Research

                                                                                                • Annual Reports
                                                                                                • White Paper
                                                                                                • Latest Press Release
                                                                                                • Industry Association
                                                                                                • Paid Database
                                                                                                • Investor Presentations
                                                                                                Analyst Chart

                                                                                                Step 4 - Data Triangulation

                                                                                                Involves using different sources of information in order to increase the validity of a study

                                                                                                These sources are likely to be stakeholders in a program - participants, other researchers, program staff, other community members, and so on.

                                                                                                Then we put all data in single framework & apply various statistical tools to find out the dynamic on the market.

                                                                                                During the analysis stage, feedback from the stakeholder groups would be compared to determine areas of agreement as well as areas of divergence

                                                                                                Additionally, after gathering mixed and scattered data from a wide range of sources, data is triangulated and correlated to come up with estimated figures which are further validated through primary mediums or industry experts, opinion leaders.

                                                                                                About Visionary Data Reports

                                                                                                Visionary Data Reports provides future-focused market research, advanced analytics, and strategic insights for technology, healthcare, green energy, and finance. Our reports help you anticipate trends, innovate, and lead in your industry. Our expert team combines primary research, data science, and industry knowledge to deliver actionable intelligence. We offer syndicated reports, custom analytics, and consulting services tailored to your business needs. At Visionary Data Reports, we are committed to quality, transparency, and client satisfaction. Every report is rigorously validated to ensure accuracy and relevance. Our global perspective and forward-thinking approach help you understand both current and emerging market dynamics.

                                                                                                Stay ahead with Visionary Data Reports. Subscribe to our newsletter for the latest insights and research highlights, and follow us on social media for real-time updates. Visionary Data Reports – Your Guide to Tomorrow’s Opportunities.

                                                                                                • Home
                                                                                                • About Us
                                                                                                • Industries
                                                                                                  • Aerospace & Defense
                                                                                                  • Agriculture
                                                                                                  • Animal Nutrition & Wellness
                                                                                                  • Automotive
                                                                                                  • Chemicals & Materials
                                                                                                  • Consumer Goods and Services
                                                                                                  • Energy & Power
                                                                                                  • Financial Services and Investment Intelligence
                                                                                                  • Food & Beverage
                                                                                                  • Home and Property Improvement
                                                                                                  • Hospitality and Tourism
                                                                                                  • Logistics
                                                                                                  • Manufacturing Products and Services
                                                                                                  • Packaging
                                                                                                  • Professional and Commercial Services
                                                                                                  • Real Estate and Construction
                                                                                                  • Retail
                                                                                                  • Technology, Media and Telecom
                                                                                                  • Healthcare
                                                                                                • Services
                                                                                                • Contact
                                                                                                Main Logo
                                                                                                • Home
                                                                                                • About Us
                                                                                                • Industries
                                                                                                  • Aerospace & Defense
                                                                                                  • Agriculture
                                                                                                  • Animal Nutrition & Wellness
                                                                                                  • Automotive
                                                                                                  • Chemicals & Materials
                                                                                                  • Consumer Goods and Services
                                                                                                  • Energy & Power
                                                                                                  • Financial Services and Investment Intelligence
                                                                                                  • Food & Beverage
                                                                                                  • Home and Property Improvement
                                                                                                  • Hospitality and Tourism
                                                                                                  • Logistics
                                                                                                  • Manufacturing Products and Services
                                                                                                  • Packaging
                                                                                                  • Professional and Commercial Services
                                                                                                  • Real Estate and Construction
                                                                                                  • Retail
                                                                                                  • Technology, Media and Telecom
                                                                                                  • Healthcare
                                                                                                • Services
                                                                                                • Contact
                                                                                                +17162654855
                                                                                                [email protected]

                                                                                                +17162654855

                                                                                                [email protected]

                                                                                                artwork spiralartwork spiralRelated Reports
                                                                                                artwork underline

                                                                                                Brazil Seeds Treatment Market Market’s Evolution: Key Growth Drivers 2025-2033

                                                                                                Explore the booming Brazil Seeds Treatment Market, projected to reach $541.81 million by 2025 with a 9.10% CAGR. Discover key drivers, trends, and leading companies shaping agricultural innovation.

                                                                                                October 2025
                                                                                                Base Year: 2024
                                                                                                No Of Pages: 197
                                                                                                Price: $3800

                                                                                                Pumpkin Market Market Predictions: Growth and Size Trends to 2033

                                                                                                Explore the dynamic global pumpkin market analysis, trends, drivers, and forecast (2025-2033). Discover market size, CAGR of 2.80%, and key regional insights for strategic growth.

                                                                                                October 2025
                                                                                                Base Year: 2024
                                                                                                No Of Pages: 234
                                                                                                Price: $4750

                                                                                                India Rice Seed Market Competitive Strategies: Trends and Forecasts 2025-2033

                                                                                                Explore the India Rice Seed Market analysis, covering market size, CAGR of 4.70%, key drivers, trends, and restraints. Discover leading companies and regional demand, focusing on hybrid and open-pollinated varieties for enhanced rice cultivation and food security.

                                                                                                October 2025
                                                                                                Base Year: 2024
                                                                                                No Of Pages: 180
                                                                                                Price: $3800

                                                                                                Exploring Growth Avenues in Hazelnut Industry Market

                                                                                                Explore the booming global hazelnut market, projected to reach $512.62M by 2025 and grow at an 8.10% CAGR. Discover key drivers, trends, and restraints shaping the future of hazelnut consumption in confectionery, bakery, and beyond.

                                                                                                October 2025
                                                                                                Base Year: 2024
                                                                                                No Of Pages: 234
                                                                                                Price: $4750

                                                                                                Robotics and Mechatronics For Agriculture Market in Africa Market Expansion: Growth Outlook 2025-2033

                                                                                                Explore the booming African market for agricultural robotics and mechatronics. Discover market size, growth drivers like food demand and precision farming, key applications, and leading technologies.

                                                                                                October 2025
                                                                                                Base Year: 2024
                                                                                                No Of Pages: 197
                                                                                                Price: $3800

                                                                                                Persimmon Industry Insights: Market Size Analysis to 2033

                                                                                                Explore the dynamic Global Persimmon Market with insights into its $0.89 billion size and 6.16% CAGR. Discover key drivers, trends, restraints, and regional analysis for 2025-2033.

                                                                                                October 2025
                                                                                                Base Year: 2024
                                                                                                No Of Pages: 197
                                                                                                Price: $3800

                                                                                                Mexico Seed Treatment Market 2025 Trends and Forecasts 2033: Analyzing Growth Opportunities

                                                                                                The size of the Mexico Seed Treatment Market market was valued at USD 158.20 Million in 2024 and is projected to reach USD 233.20 Million by 2033, with an expected CAGR of 5.70% during the forecast period.

                                                                                                October 2025
                                                                                                Base Year: 2024
                                                                                                No Of Pages: 197
                                                                                                Price: $3800

                                                                                                United States Micronutrient Fertilizer Market Report 2025: Growth Driven by Government Incentives and Partnerships

                                                                                                The size of the United States Micronutrient Fertilizer Market market was valued at USD XX Million in 2024 and is projected to reach USD XXX Million by 2033, with an expected CAGR of 4.00% during the forecast period.

                                                                                                October 2025
                                                                                                Base Year: 2024
                                                                                                No Of Pages: 197
                                                                                                Price: $3800

                                                                                                Qatar Agriculture Market Report: Trends and Forecasts 2025-2033

                                                                                                Explore the booming Qatar Agriculture Market, projecting USD 170.95M by 2025 with a 5.47% CAGR. Discover key drivers like food security initiatives, technological adoption, and market segments including cereals, fruits, and vegetables.

                                                                                                October 2025
                                                                                                Base Year: 2024
                                                                                                No Of Pages: 150
                                                                                                Price: $3800

                                                                                                Plants Phenotyping Market Charting Growth Trajectories: Analysis and Forecasts 2025-2033

                                                                                                Explore the burgeoning Plants Phenotyping Market, projected to reach USD 605.13 million by 2033 with a 10.50% CAGR. Discover key drivers, emerging trends, and growth opportunities in advanced agricultural research and crop improvement solutions.

                                                                                                October 2025
                                                                                                Base Year: 2024
                                                                                                No Of Pages: 150
                                                                                                Price: $4750

                                                                                                Africa Agrochemicals Industry Report Probes the XXX Million Size, Share, Growth Report and Future Analysis by 2033

                                                                                                Explore the booming African agrochemicals market, valued at USD 7.70 billion in 2025 and projected for 4.60% CAGR through 2033. Discover key drivers, restraints, and growth opportunities for pesticides, fertilizers, and crop protection solutions across Nigeria, South Africa, Egypt, and more.

                                                                                                October 2025
                                                                                                Base Year: 2024
                                                                                                No Of Pages: 234
                                                                                                Price: $4750

                                                                                                Spain Alfalfa Hay Industry Future Pathways: Strategic Insights to 2033

                                                                                                Explore the Spain Alfalfa Hay market analysis, including key insights, market size of USD 1.59 million, and a 4.60% CAGR. Discover drivers, trends, and restraints shaping the future of high-quality animal feed in Spain.

                                                                                                October 2025
                                                                                                Base Year: 2024
                                                                                                No Of Pages: 197
                                                                                                Price: $3800

                                                                                                Rapeseeds Market to Grow at XX CAGR: Market Size Analysis and Forecasts 2025-2033

                                                                                                Explore the booming Rapeseeds Market! Discover key growth drivers, market size of USD 1.85 million, and a 5.33% CAGR. Analyze trends, restraints, and regional shares for this vital agricultural commodity.

                                                                                                September 2025
                                                                                                Base Year: 2024
                                                                                                No Of Pages: 234
                                                                                                Price: $4750

                                                                                                Argentina Fertilizer Market Strategic Roadmap: Analysis and Forecasts 2025-2033

                                                                                                Explore the dynamic Argentina Fertilizer Market, with a projected market size of $2,500 Million by 2025 and a CAGR of 5.72%. Discover key drivers like increasing agricultural demand and technological advancements, alongside market restraints and emerging trends in specialty fertilizers.

                                                                                                September 2025
                                                                                                Base Year: 2024
                                                                                                No Of Pages: 197
                                                                                                Price: $3800

                                                                                                Sprinkler Irrigation Systems Market Market Analysis and Forecasts

                                                                                                Explore the booming Sprinkler Irrigation Systems market, valued at USD 4.94 billion and projected to grow at an 8.60% CAGR. Discover key drivers, trends, and regional insights for efficient agricultural water management.

                                                                                                September 2025
                                                                                                Base Year: 2024
                                                                                                No Of Pages: 234
                                                                                                Price: $4750

                                                                                                India Specialty Fertilizer Industry 2025-2033 Analysis: Trends, Competitor Dynamics, and Growth Opportunities

                                                                                                The size of the India Specialty Fertilizer Industry market was valued at USD XX Million in 2024 and is projected to reach USD XXX Million by 2033, with an expected CAGR of 6.50% during the forecast period.

                                                                                                September 2025
                                                                                                Base Year: 2024
                                                                                                No Of Pages: 197
                                                                                                Price: $3800

                                                                                                Strategic Analysis of Europe Kiwi Fruit Market Industry Opportunities

                                                                                                Explore the thriving Europe kiwi fruit market, projected to reach USD 3,500 million by 2025 with a 5.70% CAGR. Discover key drivers, emerging trends, restraints, and detailed segment analysis for Germany, UK, France, Spain, and Italy.

                                                                                                September 2025
                                                                                                Base Year: 2024
                                                                                                No Of Pages: 180
                                                                                                Price: $4750

                                                                                                United States Haying & Forage Machinery Market Charting Growth Trajectories 2025-2033: Strategic Insights and Forecasts

                                                                                                Explore the robust U.S. Haying & Forage Machinery Market, driven by agricultural innovation and livestock demand. Discover market size, CAGR, key drivers, trends, and leading companies.

                                                                                                September 2025
                                                                                                Base Year: 2024
                                                                                                No Of Pages: 150
                                                                                                Price: $3800

                                                                                                Strategic Projections for South Africa Fruits and Vegetables Industry Market Expansion

                                                                                                Explore the booming South African fruits and vegetables market, driven by health trends and agricultural innovation. Discover growth drivers, key segments, and future projections for this vital industry.

                                                                                                September 2025
                                                                                                Base Year: 2024
                                                                                                No Of Pages: 197
                                                                                                Price: $3800

                                                                                                Biofertilizer Market Drivers of Growth: Opportunities to 2033

                                                                                                Explore the expanding Biofertilizer Market, driven by sustainability and organic farming trends. Discover market size, CAGR, regional insights, and key growth drivers for this vital agricultural sector.

                                                                                                September 2025
                                                                                                Base Year: 2024
                                                                                                No Of Pages: 197
                                                                                                Price: $3800

                                                                                                APAC Cashew Industry Expected to Reach XXX Million by 2033

                                                                                                Explore the booming APAC Cashew Industry. Discover market size, 4.44% CAGR, growth drivers, key trends, and restraints shaping the future of cashews in China, Vietnam, India, and beyond.

                                                                                                September 2025
                                                                                                Base Year: 2024
                                                                                                No Of Pages: 180
                                                                                                Price: $4750

                                                                                                Future Trends Shaping Maize Market in Africa Growth

                                                                                                Explore the burgeoning African Maize Market: drivers, trends, restraints, and growth forecasts from 2019-2033. Gain insights into regional dynamics and key players shaping this vital agricultural sector.

                                                                                                September 2025
                                                                                                Base Year: 2024
                                                                                                No Of Pages: 150
                                                                                                Price: $4750

                                                                                                India Herbicide Market Competitive Advantage: Trends and Opportunities to 2033

                                                                                                Discover the booming India herbicide market! Explore its ₹X billion valuation, 5.31% CAGR growth forecast (2025-2033), key drivers, trends, and leading companies. Learn about market segmentation by application & crop type and unlock insights for investment and growth.

                                                                                                August 2025
                                                                                                Base Year: 2024
                                                                                                No Of Pages: 180
                                                                                                Price: $3800

                                                                                                Future-Ready Strategies for United States Agricultural Biologicals Market Market Growth

                                                                                                The US Agricultural Biologicals Market is booming, projected to reach $2.2 billion by 2033 with a 3.5% CAGR. Discover key trends, market segments (crop nutrition, biopesticides, cash crops, horticulture), leading companies, and growth drivers in this comprehensive analysis. Learn how sustainable farming and consumer demand are shaping this dynamic sector.

                                                                                                August 2025
                                                                                                Base Year: 2024
                                                                                                No Of Pages: 197
                                                                                                Price: $3800

                                                                                                Indonesia Agrochemical Market Market Analysis and Growth Roadmap

                                                                                                Discover the booming Indonesian agrochemical market forecast to 2033! This in-depth analysis reveals key growth drivers, market segmentation by type and application (fertilizers, pesticides, cereals, oilseeds), competitive landscape, and future trends. Learn how leading companies like BASF and Syngenta are capitalizing on this expanding market.

                                                                                                August 2025
                                                                                                Base Year: 2024
                                                                                                No Of Pages: 150
                                                                                                Price: $3800

                                                                                                Africa Fungicide Market Market’s Technological Evolution: Trends and Analysis 2025-2033

                                                                                                The booming Africa fungicide market is projected to reach $XXX million by 2033, driven by increasing crop diseases and the adoption of modern farming techniques. Explore market trends, key players (FMC, Sumitomo, Adama), and regional insights in this comprehensive analysis. Discover growth opportunities in South Africa, Kenya, and other key African nations.

                                                                                                August 2025
                                                                                                Base Year: 2024
                                                                                                No Of Pages: 180
                                                                                                Price: $3800

                                                                                                Strategic Planning for Fresh Cherries Industry Industry Expansion

                                                                                                Discover the booming fresh cherries market! Our comprehensive analysis reveals key trends, growth drivers, and regional market shares from 2019-2033, including insights into leading companies and cherry types. Learn about the projected CAGR and explore opportunities in this lucrative sector.

                                                                                                August 2025
                                                                                                Base Year: 2024
                                                                                                No Of Pages: 180
                                                                                                Price: $4750

                                                                                                Silk Yarn Market Projected to Grow at XX CAGR: Insights and Forecasts 2025-2033

                                                                                                Discover the latest market trends and growth opportunities in the booming silk yarn market. Explore key drivers, restraints, and regional analysis, including projections to 2033. Learn about leading companies and diverse applications in textiles, apparel, and medical devices.

                                                                                                August 2025
                                                                                                Base Year: 2024
                                                                                                No Of Pages: 234
                                                                                                Price: $4750

                                                                                                Seed Market in Vietnam Industry’s Growth Dynamics and Insights

                                                                                                Discover the booming Vietnamese seed market! Explore its $250 million (2025) valuation, 4.70% CAGR, key drivers (hybrid seeds, protected cultivation), and leading companies. This in-depth analysis forecasts growth to 2033, revealing lucrative opportunities in Vietnam's agricultural sector.

                                                                                                August 2025
                                                                                                Base Year: 2024
                                                                                                No Of Pages: 180
                                                                                                Price: $3800

                                                                                                Growth Roadmap for Vietnamese Fertilizers Market Market 2025-2033

                                                                                                Discover the booming Vietnamese fertilizer market! This comprehensive analysis reveals a CAGR of 6.70%, driven by agricultural intensification and government initiatives. Learn about market segments, key players (APROMACO, Grupa Azoty, PetroVietnam), and future growth projections to 2033. Explore trends in fertilizer types, application methods, and regional variations.

                                                                                                August 2025
                                                                                                Base Year: 2024
                                                                                                No Of Pages: 150
                                                                                                Price: $3800

                                                                                                Liquid Fertilizer Market Planning for the Future: Key Trends 2025-2033

                                                                                                Discover the booming liquid fertilizer market! Explore key trends, growth drivers (population increase, precision agriculture), and leading companies shaping this $16 Billion+ industry. Learn about market segmentation by type, application, and crop, and project future growth with our in-depth analysis.

                                                                                                August 2025
                                                                                                Base Year: 2024
                                                                                                No Of Pages: 197
                                                                                                Price: $3800

                                                                                                South America Agricultural Robots and Mechatronics Market Strategic Dynamics: Competitor Analysis 2025-2033

                                                                                                Discover the booming South American Agricultural Robots & Mechatronics market! This comprehensive analysis reveals a 13.10% CAGR, driven by precision agriculture, autonomous tractors, and UAVs. Explore key trends, restraints, and leading companies shaping this dynamic sector in Brazil, Argentina, and beyond. Learn more about market size projections to 2033.

                                                                                                August 2025
                                                                                                Base Year: 2024
                                                                                                No Of Pages: 234
                                                                                                Price: $4750

                                                                                                Africa Biopesticides Market Industry Overview and Projections

                                                                                                Discover the booming Africa biopesticides market! This comprehensive analysis reveals a projected $225 million market by 2033, driven by organic farming trends and government initiatives. Explore key drivers, restraints, and regional market shares across South Africa, Egypt, Nigeria, and more.

                                                                                                August 2025
                                                                                                Base Year: 2024
                                                                                                No Of Pages: 197
                                                                                                Price: $3800

                                                                                                North America Biological Organic Fertilizer Market Market Report: Trends and Growth

                                                                                                Discover the booming North American biological organic fertilizer market! Our analysis reveals a 14.10% CAGR, driven by consumer demand for organic food and sustainable agriculture. Learn about key players, market segments (cereals, legumes, etc.), and future trends impacting this rapidly growing sector.

                                                                                                August 2025
                                                                                                Base Year: 2024
                                                                                                No Of Pages: 150
                                                                                                Price: $4750

                                                                                                Global North America Agricultural Equipment Market Trends: Region-Specific Insights 2025-2033

                                                                                                Discover the booming North American agricultural equipment market! This in-depth analysis reveals a projected 7.90% CAGR through 2033, driven by precision agriculture, increasing food demand, and government initiatives. Learn about key players, market segments (tractors, irrigation, harvesting), and growth challenges.

                                                                                                August 2025
                                                                                                Base Year: 2024
                                                                                                No Of Pages: 234
                                                                                                Price: $4750

                                                                                                Exploring Opportunities in Brazilian Rice Market Sector

                                                                                                Discover the dynamic Brazilian rice market's growth trajectory, projected to reach $X million by 2025, with a CAGR of 1.10% until 2033. Explore key drivers, trends, and restraints impacting this $X billion market, segmented by product type, distribution, and end-user. Learn about major players and regional market shares.

                                                                                                August 2025
                                                                                                Base Year: 2024
                                                                                                No Of Pages: 197
                                                                                                Price: $3800

                                                                                                Artichokes Industry Industry Insights and Forecasts

                                                                                                Discover the latest market analysis of the global artichoke industry, revealing a steady growth trajectory and exploring key drivers, trends, and challenges within the fresh, canned, frozen, and marinated segments. Learn about leading companies and regional market share. Projected to reach $XX million by 2033.

                                                                                                August 2025
                                                                                                Base Year: 2024
                                                                                                No Of Pages: 197
                                                                                                Price: $3800

                                                                                                Lychee Industry Growth Opportunities: Market Size Forecast to 2033

                                                                                                Discover the booming lychee market! Explore a detailed analysis of the $7.1 billion industry, projecting a 5.5% CAGR through 2033. Learn about key drivers, regional trends, and top companies shaping this dynamic sector.

                                                                                                August 2025
                                                                                                Base Year: 2024
                                                                                                No Of Pages: 180
                                                                                                Price: $4750

                                                                                                Understanding Growth Challenges in Round Wood Market Market 2025-2033

                                                                                                Discover the latest insights into the booming round wood market, projected to reach $XXX billion by 2033. Explore market drivers, trends, restraints, and regional analysis, including key players like Weyerhaeuser and International Paper. Learn about the growth opportunities in construction, furniture, and paper & pulp sectors.

                                                                                                August 2025
                                                                                                Base Year: 2024
                                                                                                No Of Pages: 234
                                                                                                Price: $4750

                                                                                                Strategic Insights into Asia-Pacific Organic Fertilizer Market Market Trends

                                                                                                Discover the booming Asia-Pacific organic fertilizer market! This in-depth analysis reveals key trends, drivers, and regional insights, projecting significant growth through 2033. Learn about leading companies and explore opportunities in this sustainable agriculture sector.

                                                                                                August 2025
                                                                                                Base Year: 2024
                                                                                                No Of Pages: 197
                                                                                                Price: $3800

                                                                                                Decoding Market Trends in Seed Industry in Pakistan: 2025-2033 Analysis

                                                                                                Discover the booming Pakistani seed industry, projected to reach \$1.34 billion by 2033 with a 5.3% CAGR. This in-depth analysis explores market drivers, trends, restraints, key players (Rashid Seeds, AllahDin Group, Bayer Crop Science), and regional market share. Learn about the opportunities and challenges shaping this vital sector.

                                                                                                August 2025
                                                                                                Base Year: 2024
                                                                                                No Of Pages: 150
                                                                                                Price: $3800

                                                                                                Fruits and Vegetables Market in Mexico Trends and Forecasts: Comprehensive Insights

                                                                                                Discover the booming Mexican fruits and vegetables market! This comprehensive analysis reveals key trends, growth drivers, and challenges shaping the industry's future (2025-2033). Explore regional market shares, CAGR projections, and leading companies.

                                                                                                August 2025
                                                                                                Base Year: 2024
                                                                                                No Of Pages: 197
                                                                                                Price: $3800

                                                                                                Africa Specialty Fertilizer Industry 2025-2033 Analysis: Trends, Competitor Dynamics, and Growth Opportunities

                                                                                                Discover the booming African specialty fertilizer market! Our comprehensive analysis reveals a 9.02% CAGR, driven by food security needs and technological advancements. Explore market size, key players (Haifa Group, Yara, ICL), and regional trends in South Africa, Nigeria, and beyond. Learn about growth opportunities in CRF, liquid, and water-soluble fertilizers.

                                                                                                August 2025
                                                                                                Base Year: 2024
                                                                                                No Of Pages: 150
                                                                                                Price: $3800

                                                                                                Germany Seed Treatment Market Size, Share, and Growth Report: In-Depth Analysis and Forecast to 2033

                                                                                                Discover the booming Germany seed treatment market, projected to reach €615.39 million by 2033 with a 4.70% CAGR. This in-depth analysis covers market size, key players (Bayer, Syngenta, BASF), regional trends (North Rhine-Westphalia, Bavaria), and future growth drivers. Learn about insecticides, fungicides, and nematicides impacting various crops.

                                                                                                August 2025
                                                                                                Base Year: 2024
                                                                                                No Of Pages: 150
                                                                                                Price: $3800

                                                                                                Russia Crop Protection Chemical Market Strategic Insights: Analysis 2025 and Forecasts 2033

                                                                                                Discover the booming Russia Crop Protection Chemical Market, projected to reach $2.65 billion by 2033 with a 5% CAGR. This in-depth analysis explores market drivers, trends, restraints, key players (FMC, UPL, Syngenta, etc.), and regional breakdowns. Learn about growth opportunities in herbicides, insecticides, and more.

                                                                                                August 2025
                                                                                                Base Year: 2024
                                                                                                No Of Pages: 197
                                                                                                Price: $3800

                                                                                                Utility Tractors Market Decade Long Trends, Analysis and Forecast 2025-2033

                                                                                                The global utility tractor market is booming, projected to reach \$[estimated 2033 value] by 2033, with a CAGR of 4.48%. This in-depth analysis explores market drivers, trends, restraints, and key players like Deere & Company and Kubota, covering segments by type, horsepower, and application across major regions. Discover the latest insights on this rapidly expanding industry.

                                                                                                August 2025
                                                                                                Base Year: 2024
                                                                                                No Of Pages: 180
                                                                                                Price: $4750

                                                                                                Analyzing the Future of South America Biofertilizer Market: Key Trends to 2033

                                                                                                Discover the booming South American biofertilizer market! Projected to reach $610 million by 2033 with a 15% CAGR, this report analyzes market trends, key players (Koppert, Novozymes, Suståne), and regional growth in Brazil, Argentina & more. Explore segments like Azospirillum, Mycorrhiza, and crop types. Invest wisely in this sustainable agriculture opportunity.

                                                                                                August 2025
                                                                                                Base Year: 2024
                                                                                                No Of Pages: 150
                                                                                                Price: $3800

                                                                                                Africa Insecticide Market Growth Forecast and Consumer Insights

                                                                                                Discover the booming African insecticide market, projected to reach $XXX million by 2033 with a 6.30% CAGR. This in-depth analysis explores key drivers, trends, restraints, and regional market share, focusing on South Africa, Kenya, and other key countries. Learn about major players like Sumitomo Chemical and Syngenta and the future of sustainable pest control solutions in Africa.

                                                                                                August 2025
                                                                                                Base Year: 2024
                                                                                                No Of Pages: 180
                                                                                                Price: $3800

                                                                                                NA Quinoa Seed Market Industry’s Future Growth Prospects

                                                                                                Discover the booming North American quinoa seed market! Our in-depth analysis reveals a CAGR of 5.70% through 2033, driven by health trends and diverse applications. Explore market size, key players, and regional insights for strategic decision-making.

                                                                                                August 2025
                                                                                                Base Year: 2024
                                                                                                No Of Pages: 234
                                                                                                Price: $4750

                                                                                                Global Rice Transplanter Market Market Demand and Consumption Trends: Outlook 2025-2033

                                                                                                Discover the latest insights into the booming global rice transplanter market. Explore market size, CAGR, key drivers, and restraints impacting growth through 2033. Learn about leading companies, regional trends, and the future of rice cultivation technology.

                                                                                                August 2025
                                                                                                Base Year: 2024
                                                                                                No Of Pages: 150
                                                                                                Price: $4750

                                                                                                Business Address

                                                                                                Head Office

                                                                                                Ansec House 3 rd floor Tank Road, Yerwada, Pune, Maharashtra 411014

                                                                                                Contact Information

                                                                                                Craig Francis

                                                                                                Business Development Head

                                                                                                +17162654855

                                                                                                [email protected]

                                                                                                Secure Payment Partners

                                                                                                payment image
                                                                                                RetailLogisticsPackagingAutomotiveHealthcareAgricultureEnergy & PowerFood & BeverageAerospace & DefenseChemicals & MaterialsHospitality and TourismAnimal Nutrition & WellnessConsumer Goods and ServicesReal Estate and ConstructionHome and Property ImprovementTechnology, Media and TelecomManufacturing Products and ServicesFinancial Services and Investment Intelligence

                                                                                                © 2025 PRDUA Research & Media Private Limited, All rights reserved

                                                                                                Privacy Policy
                                                                                                Terms and Conditions
                                                                                                FAQ