

Key Insights
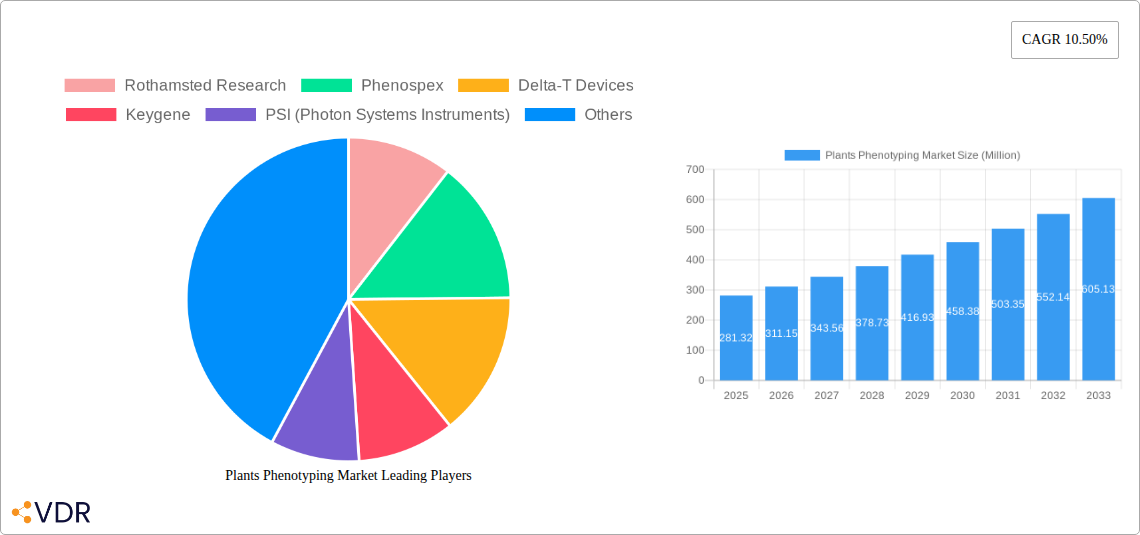
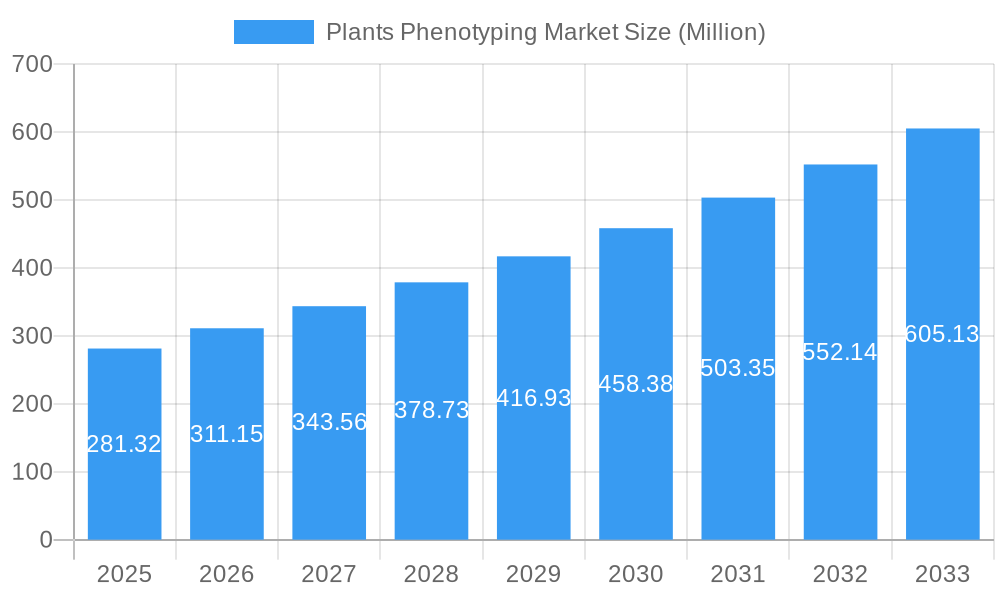
The global Plants Phenotyping Market is poised for significant expansion, with a current market size estimated at USD 281.32 million. Projections indicate a robust Compound Annual Growth Rate (CAGR) of 10.50% from 2025 through 2033, suggesting a dynamic and rapidly evolving landscape. This growth is primarily propelled by the increasing demand for high-throughput phenotyping solutions to accelerate crop breeding programs, enhance agricultural productivity, and address the challenges of climate change and growing global food security needs. Advancements in imaging technologies, sensor development, and data analytics are continuously improving the precision and efficiency of plant trait measurement, making these solutions indispensable for researchers and agricultural companies. The market's expansion is further fueled by government initiatives promoting sustainable agriculture and research into advanced plant genetics.
Plants Phenotyping Market Market Size (In Million)
The market is segmented across various analyses, including production, consumption, import/export dynamics, and price trends. Key drivers for this growth include the need for precise data to understand plant responses to environmental stresses, optimize nutrient and water use, and develop climate-resilient crop varieties. Emerging trends point towards increased adoption of artificial intelligence (AI) and machine learning (ML) for automated data interpretation and predictive modeling, alongside the integration of IoT devices for real-time monitoring. However, high initial investment costs for advanced phenotyping equipment and a shortage of skilled personnel trained in utilizing these sophisticated systems represent significant restraints. Despite these challenges, the market's trajectory remains strongly positive, with substantial opportunities across North America, Europe, and the Asia Pacific regions, driven by innovation and the critical need for agricultural advancements.
Plants Phenotyping Market Company Market Share
This comprehensive report delves into the dynamic Plants Phenotyping Market, a critical sector driving advancements in precision agriculture, crop breeding, and sustainable food production. With a study period spanning 2019–2033, including a base year of 2025, an estimated year of 2025, and a forecast period from 2025–2033, this analysis offers unparalleled insights into market size, growth trajectory, and key influencing factors. We provide granular analysis across Production Analysis, Consumption Analysis, Import Market Analysis (Value & Volume), Export Market Analysis (Value & Volume), Price Trend Analysis, and Industry Developments, all presented in Million units. This report is meticulously crafted to engage industry professionals, researchers, and investors seeking to understand and capitalize on the burgeoning opportunities in plant phenotyping technology.
Plants Phenotyping Market Market Dynamics & Structure
The Plants Phenotyping Market is characterized by a moderately concentrated competitive landscape, with key players investing heavily in research and development to gain a competitive edge. Technological innovation is a primary driver, fueled by the increasing demand for data-driven agricultural practices and the need for improved crop yields and resilience. Advancements in imaging technologies, sensors, artificial intelligence, and machine learning are continuously transforming the capabilities of phenotyping platforms. Regulatory frameworks, particularly those promoting sustainable agriculture and food security, indirectly bolster market growth. While direct regulatory impacts are minimal, government initiatives supporting agricultural research and technology adoption play a significant role. Competitive product substitutes, such as traditional breeding methods, are gradually being overshadowed by the superior efficiency and precision offered by automated phenotyping solutions. End-user demographics are diverse, encompassing academic research institutions, governmental agricultural bodies, seed companies, and large-scale commercial farms. Mergers and acquisitions (M&A) trends are evident as established players seek to expand their technological portfolios and market reach. For instance, the acquisition of smaller, innovative startups by larger corporations aims to integrate cutting-edge technologies and accelerate product development. Barriers to innovation include the high initial investment costs associated with sophisticated phenotyping equipment and the need for specialized expertise to operate and interpret data.
- Market Concentration: Moderately concentrated, with a few key global players and a growing number of niche technology providers.
- Technological Innovation Drivers: Increasing demand for data-driven agriculture, need for improved crop traits (yield, disease resistance, drought tolerance), advancements in AI, IoT, and imaging.
- Regulatory Frameworks: Indirect influence through government funding for agricultural research and technology adoption, food security initiatives, and sustainability goals.
- Competitive Product Substitutes: Traditional breeding methods, manual data collection.
- End-User Demographics: Academic and research institutions, seed companies, government agricultural agencies, large-scale commercial farms, agrochemical companies.
- M&A Trends: Strategic acquisitions by larger companies to acquire innovative technologies and expand market share. For example, recent M&A activity indicates a trend towards consolidation in the automated phenotyping hardware and software segments.
- Innovation Barriers: High capital investment for advanced systems, need for skilled personnel, data standardization challenges.
Plants Phenotyping Market Growth Trends & Insights
The Plants Phenotyping Market is poised for significant expansion, driven by the imperative to address global food security challenges and the growing adoption of precision agriculture techniques. The market size is projected to witness a robust Compound Annual Growth Rate (CAGR), fueled by increasing investments in agricultural research and development worldwide. Adoption rates for plant phenotyping technologies are steadily rising as more researchers and commercial entities recognize their value in accelerating crop improvement cycles and optimizing farming practices. Technological disruptions, particularly in areas like high-throughput imaging, drone-based phenotyping, and AI-powered data analysis, are fundamentally reshaping how plant traits are measured and understood. Consumer behavior shifts, including a growing demand for sustainably produced and higher-quality food products, indirectly influence the market by encouraging the development of more resilient and nutritious crops, a process significantly aided by phenotyping. The market penetration of advanced phenotyping solutions is expanding beyond traditional research institutions into commercial breeding programs and large-scale agricultural operations. This shift is underpinned by the demonstrable return on investment through faster breeding cycles, reduced crop losses, and improved resource management. The integration of genomic data with phenotypic data is a key trend, enabling breeders to select for desired traits more efficiently and accurately. Furthermore, the development of affordable and user-friendly phenotyping tools is democratizing access to these technologies, broadening the market's reach. The demand for real-time data acquisition and analysis is also accelerating the adoption of connected sensors and cloud-based platforms. The parent market, encompassing all agricultural technology solutions, provides a broad context for the growth of plant phenotyping, while the child market, focusing on specific phenotyping applications like trait discovery or breeding support, highlights specialized areas of rapid development. The increasing focus on climate-resilient crops and the need to adapt to changing environmental conditions will continue to be a major impetus for phenotyping advancements. The market is witnessing a gradual increase in market penetration, moving from a niche research tool to an indispensable component of modern agricultural innovation. The projected market size for the forecast period is expected to reach $XXX Million by 2033, reflecting a substantial CAGR from the current landscape.
Dominant Regions, Countries, or Segments in Plants Phenotyping Market
The Plants Phenotyping Market exhibits regional dominance driven by a confluence of factors including robust agricultural research infrastructure, government support for technological innovation, and the presence of leading agricultural economies. North America, particularly the United States, stands out as a dominant region, propelled by significant investments in crop research, a highly advanced agricultural sector, and a strong presence of academic institutions and private R&D companies. The country's extensive agricultural land, coupled with the need to enhance crop productivity and resilience against climate change, fuels the demand for sophisticated phenotyping solutions.
- Dominant Region: North America (specifically the United States).
- Key Drivers in North America:
- Economic Policies: Government funding for agricultural research, tax incentives for R&D.
- Infrastructure: Advanced research facilities, strong network of seed companies and agrochemical giants.
- Technological Adoption: High acceptance rate of new technologies in agriculture.
- Market Share: North America is estimated to hold a significant market share, likely in the range of 35-40% of the global plants phenotyping market.
- Growth Potential: Continued investment in precision agriculture and crop improvement programs ensures sustained growth.
In terms of Production Analysis, North America and Europe are leading in the development and manufacturing of high-throughput phenotyping systems and associated software. Countries like Germany and the Netherlands in Europe are also significant contributors due to their strong engineering capabilities and focus on sustainable agriculture.
For Consumption Analysis, North America leads due to its large-scale commercial agriculture and extensive research activities. Asia Pacific, particularly China and India, is emerging as a rapidly growing consumption market, driven by the need to increase food production for their large populations and increasing governmental focus on agricultural modernization.
The Import Market Analysis (Value & Volume) is dominated by regions with advanced agricultural research but limited indigenous manufacturing capabilities, often importing specialized equipment from leading technology providers. Conversely, the Export Market Analysis (Value & Volume) is led by countries with strong innovation ecosystems and manufacturing expertise, supplying global markets with cutting-edge phenotyping technologies. The current import market value for the United States is estimated at $XXX Million. The export market value from Germany is projected to be $XXX Million in 2025.
Analyzing Price Trend Analysis, the market has seen a general trend of decreasing prices for certain components due to technological advancements and economies of scale, although high-end, fully integrated systems remain premium offerings. The average price for a basic automated phenotyping system is estimated to be between $XXX,XXX and $XXX,XXX.
Industry Developments in North America include the establishment of large-scale phenotyping facilities by research institutions and private companies, fostering collaborative research and accelerating the development of new crop varieties. The increasing adoption of AI and machine learning in data analysis further solidifies North America's dominance.
Plants Phenotyping Market Product Landscape
The product landscape of the Plants Phenotyping Market is rich with innovation, encompassing a wide array of technologies designed to capture, measure, and analyze plant traits with unprecedented precision. Innovations range from advanced imaging systems, including multispectral, hyperspectral, and thermal cameras, to sophisticated sensor networks for monitoring environmental conditions and plant physiological responses. High-throughput phenotyping platforms, such as automated greenhouses, growth chambers, and field-based robotic systems, enable rapid and continuous data acquisition across thousands of plants. Software solutions powered by artificial intelligence and machine learning are crucial for processing vast datasets, identifying complex patterns, and predicting plant performance. Unique selling propositions often lie in the system's ability to provide non-destructive, real-time data on traits like biomass, leaf area index, chlorophyll content, and water stress, significantly accelerating breeding programs and research efforts. Technological advancements are focused on miniaturization, increased automation, and enhanced data analytics capabilities.
Key Drivers, Barriers & Challenges in Plants Phenotyping Market
Key Drivers:
The Plants Phenotyping Market is propelled by several potent drivers. The escalating global population necessitates higher crop yields and improved nutritional value, a goal directly addressed by precision phenotyping. The growing imperative for climate-resilient crops to withstand extreme weather events and changing environmental conditions is another significant catalyst. Furthermore, government initiatives promoting sustainable agriculture, precision farming, and agricultural innovation provide crucial support through funding and policy incentives. The continuous advancements in imaging technology, sensor networks, and artificial intelligence are democratizing access to sophisticated data collection and analysis tools.
Barriers & Challenges:
Despite its immense potential, the market faces notable challenges. The high initial capital investment required for advanced phenotyping equipment can be a significant barrier for smaller research institutions and farmers. The need for specialized expertise to operate complex systems and interpret the generated data presents a skilled labor gap. Data standardization and integration across different platforms and research sites remain a hurdle, impacting the comparability and usability of data. Supply chain disruptions can affect the availability of specialized components, leading to delays and increased costs. Lastly, the long adoption cycles in the agricultural sector, coupled with resistance to new technologies, can slow down widespread market penetration.
Emerging Opportunities in Plants Phenotyping Market
Emerging opportunities in the Plants Phenotyping Market are diverse and promising. The expansion of phenotyping applications beyond traditional breeding to include areas like disease monitoring, pest detection, and soil health assessment presents significant growth potential. The development of affordable, portable phenotyping devices tailored for smallholder farmers in developing regions could unlock a vast untapped market. Furthermore, the integration of phenotyping data with other data streams, such as genomic, proteomic, and environmental data, promises to create comprehensive plant intelligence platforms for highly optimized crop management. The increasing consumer demand for transparent and traceable food supply chains also opens avenues for phenotyping technologies that can verify crop quality and origin.
Growth Accelerators in the Plants Phenotyping Market Industry
Several key catalysts are accelerating long-term growth in the Plants Phenotyping Market Industry. Technological breakthroughs, particularly in AI-driven image recognition and predictive modeling, are enhancing the accuracy and speed of phenotyping analysis. Strategic partnerships between technology providers, seed companies, and research institutions are fostering collaborative innovation and accelerating the commercialization of new phenotyping solutions. Market expansion strategies, including the development of cloud-based platforms and accessible service models, are making these technologies more scalable and cost-effective for a wider range of users. The growing global emphasis on food security and sustainable agricultural practices provides a fundamental, long-term growth driver that will continue to fuel investment and innovation in this sector.
Key Players Shaping the Plants Phenotyping Market Market
- Rothamsted Research
- Phenospex
- Delta-T Devices
- Keygene
- PSI (Photon Systems Instruments)
- BASF SE (Crop Design)
- Heinz Walz GmbH
- The Vienna Biocenter Core Facilities
- LemnaTec GmbH
- Phenomix
- WP
- Qubit Systems
Notable Milestones in Plants Phenotyping Market Sector
- 2019: Introduction of advanced AI algorithms for automated trait analysis, significantly reducing manual interpretation time.
- 2020: Launch of compact, drone-mounted hyperspectral imaging systems, enabling higher resolution aerial phenotyping.
- 2021: Establishment of major public-private partnerships for large-scale phenotyping infrastructure development, particularly in North America and Europe.
- 2022: Significant advancements in real-time physiological monitoring sensors, offering continuous insights into plant stress levels.
- 2023: Increased adoption of cloud-based phenotyping data management platforms, enhancing collaboration and data accessibility.
- 2024: Emergence of specialized phenotyping solutions for vertical farming and controlled environment agriculture.
In-Depth Plants Phenotyping Market Market Outlook
The future outlook for the Plants Phenotyping Market is exceptionally bright, driven by an ongoing commitment to innovation and the increasing recognition of its indispensable role in addressing global agricultural challenges. Growth accelerators such as the continued refinement of AI and machine learning for deeper data insights, alongside strategic alliances between technology developers and agricultural giants, will further democratize access to these powerful tools. The market's trajectory points towards greater integration of phenotyping with genomics and other omics, fostering a holistic approach to crop improvement. As the world grapples with climate change and the need for sustainable food production, the demand for precise, data-driven agricultural solutions will only intensify, positioning the plants phenotyping market as a critical engine for future agricultural advancement.
Plants Phenotyping Market Segmentation
- 1. Production Analysis
- 2. Consumption Analysis
- 3. Import Market Analysis (Value & Volume)
- 4. Export Market Analysis (Value & Volume)
- 5. Price Trend Analysis
Plants Phenotyping Market Segmentation By Geography
-
1. North America
- 1.1. United States
- 1.2. Canada
- 1.3. Mexico
-
2. South America
- 2.1. Brazil
- 2.2. Argentina
- 2.3. Rest of South America
-
3. Europe
- 3.1. United Kingdom
- 3.2. Germany
- 3.3. France
- 3.4. Italy
- 3.5. Spain
- 3.6. Russia
- 3.7. Benelux
- 3.8. Nordics
- 3.9. Rest of Europe
-
4. Middle East & Africa
- 4.1. Turkey
- 4.2. Israel
- 4.3. GCC
- 4.4. North Africa
- 4.5. South Africa
- 4.6. Rest of Middle East & Africa
-
5. Asia Pacific
- 5.1. China
- 5.2. India
- 5.3. Japan
- 5.4. South Korea
- 5.5. ASEAN
- 5.6. Oceania
- 5.7. Rest of Asia Pacific
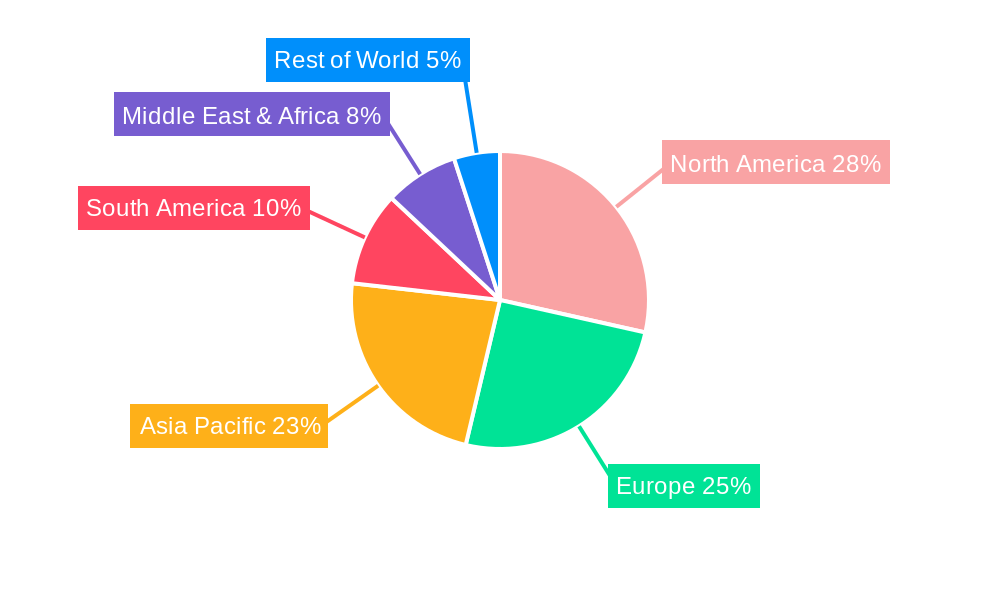
Plants Phenotyping Market Regional Market Share
Geographic Coverage of Plants Phenotyping Market
Plants Phenotyping Market REPORT HIGHLIGHTS
| Aspects | Details |
|---|---|
| Study Period | 2020-2034 |
| Base Year | 2025 |
| Estimated Year | 2026 |
| Forecast Period | 2026-2034 |
| Historical Period | 2020-2025 |
| Growth Rate | CAGR of 10.50% from 2020-2034 |
| Segmentation |
|
Table of Contents
- 1. Introduction
- 1.1. Research Scope
- 1.2. Market Segmentation
- 1.3. Research Objective
- 1.4. Definitions and Assumptions
- 2. Executive Summary
- 2.1. Market Snapshot
- 3. Market Dynamics
- 3.1. Market Drivers
- 3.2. Market Restrains
- 3.3. Market Trends
- 3.4. Market Opportunities
- 4. Market Factor Analysis
- 4.1. Porters Five Forces
- 4.1.1. Bargaining Power of Suppliers
- 4.1.2. Bargaining Power of Buyers
- 4.1.3. Threat of New Entrants
- 4.1.4. Threat of Substitutes
- 4.1.5. Competitive Rivalry
- 4.2. PESTEL analysis
- 4.3. BCG Analysis
- 4.3.1. Stars (High Growth, High Market Share)
- 4.3.2. Cash Cows (Low Growth, High Market Share)
- 4.3.3. Question Mark (High Growth, Low Market Share)
- 4.3.4. Dogs (Low Growth, Low Market Share)
- 4.4. Ansoff Matrix Analysis
- 4.5. Supply Chain Analysis
- 4.6. Regulatory Landscape
- 4.7. Current Market Potential and Opportunity Assessment (TAM–SAM–SOM Framework)
- 4.8. VDR Analyst Note
- 4.1. Porters Five Forces
- 5. Market Analysis, Insights and Forecast 2021-2033
- 5.1. Market Analysis, Insights and Forecast - by Production Analysis
- 5.2. Market Analysis, Insights and Forecast - by Consumption Analysis
- 5.3. Market Analysis, Insights and Forecast - by Import Market Analysis (Value & Volume)
- 5.4. Market Analysis, Insights and Forecast - by Export Market Analysis (Value & Volume)
- 5.5. Market Analysis, Insights and Forecast - by Price Trend Analysis
- 5.6. Market Analysis, Insights and Forecast - by Region
- 5.6.1. North America
- 5.6.2. South America
- 5.6.3. Europe
- 5.6.4. Middle East & Africa
- 5.6.5. Asia Pacific
- 6. Global Plants Phenotyping Market Analysis, Insights and Forecast, 2021-2033
- 6.1. Market Analysis, Insights and Forecast - by Production Analysis
- 6.2. Market Analysis, Insights and Forecast - by Consumption Analysis
- 6.3. Market Analysis, Insights and Forecast - by Import Market Analysis (Value & Volume)
- 6.4. Market Analysis, Insights and Forecast - by Export Market Analysis (Value & Volume)
- 6.5. Market Analysis, Insights and Forecast - by Price Trend Analysis
- 7. North America Plants Phenotyping Market Analysis, Insights and Forecast, 2021-2033
- 7.1. Market Analysis, Insights and Forecast - by Production Analysis
- 7.2. Market Analysis, Insights and Forecast - by Consumption Analysis
- 7.3. Market Analysis, Insights and Forecast - by Import Market Analysis (Value & Volume)
- 7.4. Market Analysis, Insights and Forecast - by Export Market Analysis (Value & Volume)
- 7.5. Market Analysis, Insights and Forecast - by Price Trend Analysis
- 8. South America Plants Phenotyping Market Analysis, Insights and Forecast, 2021-2033
- 8.1. Market Analysis, Insights and Forecast - by Production Analysis
- 8.2. Market Analysis, Insights and Forecast - by Consumption Analysis
- 8.3. Market Analysis, Insights and Forecast - by Import Market Analysis (Value & Volume)
- 8.4. Market Analysis, Insights and Forecast - by Export Market Analysis (Value & Volume)
- 8.5. Market Analysis, Insights and Forecast - by Price Trend Analysis
- 9. Europe Plants Phenotyping Market Analysis, Insights and Forecast, 2021-2033
- 9.1. Market Analysis, Insights and Forecast - by Production Analysis
- 9.2. Market Analysis, Insights and Forecast - by Consumption Analysis
- 9.3. Market Analysis, Insights and Forecast - by Import Market Analysis (Value & Volume)
- 9.4. Market Analysis, Insights and Forecast - by Export Market Analysis (Value & Volume)
- 9.5. Market Analysis, Insights and Forecast - by Price Trend Analysis
- 10. Middle East & Africa Plants Phenotyping Market Analysis, Insights and Forecast, 2021-2033
- 10.1. Market Analysis, Insights and Forecast - by Production Analysis
- 10.2. Market Analysis, Insights and Forecast - by Consumption Analysis
- 10.3. Market Analysis, Insights and Forecast - by Import Market Analysis (Value & Volume)
- 10.4. Market Analysis, Insights and Forecast - by Export Market Analysis (Value & Volume)
- 10.5. Market Analysis, Insights and Forecast - by Price Trend Analysis
- 11. Asia Pacific Plants Phenotyping Market Analysis, Insights and Forecast, 2021-2033
- 11.1. Market Analysis, Insights and Forecast - by Production Analysis
- 11.2. Market Analysis, Insights and Forecast - by Consumption Analysis
- 11.3. Market Analysis, Insights and Forecast - by Import Market Analysis (Value & Volume)
- 11.4. Market Analysis, Insights and Forecast - by Export Market Analysis (Value & Volume)
- 11.5. Market Analysis, Insights and Forecast - by Price Trend Analysis
- 12. Competitive Analysis
- 12.1. Company Profiles
- 12.1.1 Rothamsted Research
- 12.1.1.1. Company Overview
- 12.1.1.2. Products
- 12.1.1.3. Company Financials
- 12.1.1.4. SWOT Analysis
- 12.1.2 Phenospex
- 12.1.2.1. Company Overview
- 12.1.2.2. Products
- 12.1.2.3. Company Financials
- 12.1.2.4. SWOT Analysis
- 12.1.3 Delta-T Devices
- 12.1.3.1. Company Overview
- 12.1.3.2. Products
- 12.1.3.3. Company Financials
- 12.1.3.4. SWOT Analysis
- 12.1.4 Keygene
- 12.1.4.1. Company Overview
- 12.1.4.2. Products
- 12.1.4.3. Company Financials
- 12.1.4.4. SWOT Analysis
- 12.1.5 PSI (Photon Systems Instruments)
- 12.1.5.1. Company Overview
- 12.1.5.2. Products
- 12.1.5.3. Company Financials
- 12.1.5.4. SWOT Analysis
- 12.1.6 BASF SE (Crop Design)
- 12.1.6.1. Company Overview
- 12.1.6.2. Products
- 12.1.6.3. Company Financials
- 12.1.6.4. SWOT Analysis
- 12.1.7 Heinz Walz GmbH
- 12.1.7.1. Company Overview
- 12.1.7.2. Products
- 12.1.7.3. Company Financials
- 12.1.7.4. SWOT Analysis
- 12.1.8 The Vienna Biocenter Core Facilities
- 12.1.8.1. Company Overview
- 12.1.8.2. Products
- 12.1.8.3. Company Financials
- 12.1.8.4. SWOT Analysis
- 12.1.9 LemnaTec GmbH
- 12.1.9.1. Company Overview
- 12.1.9.2. Products
- 12.1.9.3. Company Financials
- 12.1.9.4. SWOT Analysis
- 12.1.10 Phenomix
- 12.1.10.1. Company Overview
- 12.1.10.2. Products
- 12.1.10.3. Company Financials
- 12.1.10.4. SWOT Analysis
- 12.1.11 WP
- 12.1.11.1. Company Overview
- 12.1.11.2. Products
- 12.1.11.3. Company Financials
- 12.1.11.4. SWOT Analysis
- 12.1.12 Qubit Systems
- 12.1.12.1. Company Overview
- 12.1.12.2. Products
- 12.1.12.3. Company Financials
- 12.1.12.4. SWOT Analysis
- 12.1.1 Rothamsted Research
- 12.2. Market Entropy
- 12.2.1 Company's Key Areas Served
- 12.2.2 Recent Developments
- 12.3. Company Market Share Analysis 2025
- 12.3.1 Top 5 Companies Market Share Analysis
- 12.3.2 Top 3 Companies Market Share Analysis
- 12.4. List of Potential Customers
- 13. Research Methodology
List of Figures
- Figure 1: Global Plants Phenotyping Market Revenue Breakdown (Million, %) by Region 2025 & 2033
- Figure 2: North America Plants Phenotyping Market Revenue (Million), by Production Analysis 2025 & 2033
- Figure 3: North America Plants Phenotyping Market Revenue Share (%), by Production Analysis 2025 & 2033
- Figure 4: North America Plants Phenotyping Market Revenue (Million), by Consumption Analysis 2025 & 2033
- Figure 5: North America Plants Phenotyping Market Revenue Share (%), by Consumption Analysis 2025 & 2033
- Figure 6: North America Plants Phenotyping Market Revenue (Million), by Import Market Analysis (Value & Volume) 2025 & 2033
- Figure 7: North America Plants Phenotyping Market Revenue Share (%), by Import Market Analysis (Value & Volume) 2025 & 2033
- Figure 8: North America Plants Phenotyping Market Revenue (Million), by Export Market Analysis (Value & Volume) 2025 & 2033
- Figure 9: North America Plants Phenotyping Market Revenue Share (%), by Export Market Analysis (Value & Volume) 2025 & 2033
- Figure 10: North America Plants Phenotyping Market Revenue (Million), by Price Trend Analysis 2025 & 2033
- Figure 11: North America Plants Phenotyping Market Revenue Share (%), by Price Trend Analysis 2025 & 2033
- Figure 12: North America Plants Phenotyping Market Revenue (Million), by Country 2025 & 2033
- Figure 13: North America Plants Phenotyping Market Revenue Share (%), by Country 2025 & 2033
- Figure 14: South America Plants Phenotyping Market Revenue (Million), by Production Analysis 2025 & 2033
- Figure 15: South America Plants Phenotyping Market Revenue Share (%), by Production Analysis 2025 & 2033
- Figure 16: South America Plants Phenotyping Market Revenue (Million), by Consumption Analysis 2025 & 2033
- Figure 17: South America Plants Phenotyping Market Revenue Share (%), by Consumption Analysis 2025 & 2033
- Figure 18: South America Plants Phenotyping Market Revenue (Million), by Import Market Analysis (Value & Volume) 2025 & 2033
- Figure 19: South America Plants Phenotyping Market Revenue Share (%), by Import Market Analysis (Value & Volume) 2025 & 2033
- Figure 20: South America Plants Phenotyping Market Revenue (Million), by Export Market Analysis (Value & Volume) 2025 & 2033
- Figure 21: South America Plants Phenotyping Market Revenue Share (%), by Export Market Analysis (Value & Volume) 2025 & 2033
- Figure 22: South America Plants Phenotyping Market Revenue (Million), by Price Trend Analysis 2025 & 2033
- Figure 23: South America Plants Phenotyping Market Revenue Share (%), by Price Trend Analysis 2025 & 2033
- Figure 24: South America Plants Phenotyping Market Revenue (Million), by Country 2025 & 2033
- Figure 25: South America Plants Phenotyping Market Revenue Share (%), by Country 2025 & 2033
- Figure 26: Europe Plants Phenotyping Market Revenue (Million), by Production Analysis 2025 & 2033
- Figure 27: Europe Plants Phenotyping Market Revenue Share (%), by Production Analysis 2025 & 2033
- Figure 28: Europe Plants Phenotyping Market Revenue (Million), by Consumption Analysis 2025 & 2033
- Figure 29: Europe Plants Phenotyping Market Revenue Share (%), by Consumption Analysis 2025 & 2033
- Figure 30: Europe Plants Phenotyping Market Revenue (Million), by Import Market Analysis (Value & Volume) 2025 & 2033
- Figure 31: Europe Plants Phenotyping Market Revenue Share (%), by Import Market Analysis (Value & Volume) 2025 & 2033
- Figure 32: Europe Plants Phenotyping Market Revenue (Million), by Export Market Analysis (Value & Volume) 2025 & 2033
- Figure 33: Europe Plants Phenotyping Market Revenue Share (%), by Export Market Analysis (Value & Volume) 2025 & 2033
- Figure 34: Europe Plants Phenotyping Market Revenue (Million), by Price Trend Analysis 2025 & 2033
- Figure 35: Europe Plants Phenotyping Market Revenue Share (%), by Price Trend Analysis 2025 & 2033
- Figure 36: Europe Plants Phenotyping Market Revenue (Million), by Country 2025 & 2033
- Figure 37: Europe Plants Phenotyping Market Revenue Share (%), by Country 2025 & 2033
- Figure 38: Middle East & Africa Plants Phenotyping Market Revenue (Million), by Production Analysis 2025 & 2033
- Figure 39: Middle East & Africa Plants Phenotyping Market Revenue Share (%), by Production Analysis 2025 & 2033
- Figure 40: Middle East & Africa Plants Phenotyping Market Revenue (Million), by Consumption Analysis 2025 & 2033
- Figure 41: Middle East & Africa Plants Phenotyping Market Revenue Share (%), by Consumption Analysis 2025 & 2033
- Figure 42: Middle East & Africa Plants Phenotyping Market Revenue (Million), by Import Market Analysis (Value & Volume) 2025 & 2033
- Figure 43: Middle East & Africa Plants Phenotyping Market Revenue Share (%), by Import Market Analysis (Value & Volume) 2025 & 2033
- Figure 44: Middle East & Africa Plants Phenotyping Market Revenue (Million), by Export Market Analysis (Value & Volume) 2025 & 2033
- Figure 45: Middle East & Africa Plants Phenotyping Market Revenue Share (%), by Export Market Analysis (Value & Volume) 2025 & 2033
- Figure 46: Middle East & Africa Plants Phenotyping Market Revenue (Million), by Price Trend Analysis 2025 & 2033
- Figure 47: Middle East & Africa Plants Phenotyping Market Revenue Share (%), by Price Trend Analysis 2025 & 2033
- Figure 48: Middle East & Africa Plants Phenotyping Market Revenue (Million), by Country 2025 & 2033
- Figure 49: Middle East & Africa Plants Phenotyping Market Revenue Share (%), by Country 2025 & 2033
- Figure 50: Asia Pacific Plants Phenotyping Market Revenue (Million), by Production Analysis 2025 & 2033
- Figure 51: Asia Pacific Plants Phenotyping Market Revenue Share (%), by Production Analysis 2025 & 2033
- Figure 52: Asia Pacific Plants Phenotyping Market Revenue (Million), by Consumption Analysis 2025 & 2033
- Figure 53: Asia Pacific Plants Phenotyping Market Revenue Share (%), by Consumption Analysis 2025 & 2033
- Figure 54: Asia Pacific Plants Phenotyping Market Revenue (Million), by Import Market Analysis (Value & Volume) 2025 & 2033
- Figure 55: Asia Pacific Plants Phenotyping Market Revenue Share (%), by Import Market Analysis (Value & Volume) 2025 & 2033
- Figure 56: Asia Pacific Plants Phenotyping Market Revenue (Million), by Export Market Analysis (Value & Volume) 2025 & 2033
- Figure 57: Asia Pacific Plants Phenotyping Market Revenue Share (%), by Export Market Analysis (Value & Volume) 2025 & 2033
- Figure 58: Asia Pacific Plants Phenotyping Market Revenue (Million), by Price Trend Analysis 2025 & 2033
- Figure 59: Asia Pacific Plants Phenotyping Market Revenue Share (%), by Price Trend Analysis 2025 & 2033
- Figure 60: Asia Pacific Plants Phenotyping Market Revenue (Million), by Country 2025 & 2033
- Figure 61: Asia Pacific Plants Phenotyping Market Revenue Share (%), by Country 2025 & 2033
List of Tables
- Table 1: Global Plants Phenotyping Market Revenue Million Forecast, by Production Analysis 2020 & 2033
- Table 2: Global Plants Phenotyping Market Revenue Million Forecast, by Consumption Analysis 2020 & 2033
- Table 3: Global Plants Phenotyping Market Revenue Million Forecast, by Import Market Analysis (Value & Volume) 2020 & 2033
- Table 4: Global Plants Phenotyping Market Revenue Million Forecast, by Export Market Analysis (Value & Volume) 2020 & 2033
- Table 5: Global Plants Phenotyping Market Revenue Million Forecast, by Price Trend Analysis 2020 & 2033
- Table 6: Global Plants Phenotyping Market Revenue Million Forecast, by Region 2020 & 2033
- Table 7: Global Plants Phenotyping Market Revenue Million Forecast, by Production Analysis 2020 & 2033
- Table 8: Global Plants Phenotyping Market Revenue Million Forecast, by Consumption Analysis 2020 & 2033
- Table 9: Global Plants Phenotyping Market Revenue Million Forecast, by Import Market Analysis (Value & Volume) 2020 & 2033
- Table 10: Global Plants Phenotyping Market Revenue Million Forecast, by Export Market Analysis (Value & Volume) 2020 & 2033
- Table 11: Global Plants Phenotyping Market Revenue Million Forecast, by Price Trend Analysis 2020 & 2033
- Table 12: Global Plants Phenotyping Market Revenue Million Forecast, by Country 2020 & 2033
- Table 13: United States Plants Phenotyping Market Revenue (Million) Forecast, by Application 2020 & 2033
- Table 14: Canada Plants Phenotyping Market Revenue (Million) Forecast, by Application 2020 & 2033
- Table 15: Mexico Plants Phenotyping Market Revenue (Million) Forecast, by Application 2020 & 2033
- Table 16: Global Plants Phenotyping Market Revenue Million Forecast, by Production Analysis 2020 & 2033
- Table 17: Global Plants Phenotyping Market Revenue Million Forecast, by Consumption Analysis 2020 & 2033
- Table 18: Global Plants Phenotyping Market Revenue Million Forecast, by Import Market Analysis (Value & Volume) 2020 & 2033
- Table 19: Global Plants Phenotyping Market Revenue Million Forecast, by Export Market Analysis (Value & Volume) 2020 & 2033
- Table 20: Global Plants Phenotyping Market Revenue Million Forecast, by Price Trend Analysis 2020 & 2033
- Table 21: Global Plants Phenotyping Market Revenue Million Forecast, by Country 2020 & 2033
- Table 22: Brazil Plants Phenotyping Market Revenue (Million) Forecast, by Application 2020 & 2033
- Table 23: Argentina Plants Phenotyping Market Revenue (Million) Forecast, by Application 2020 & 2033
- Table 24: Rest of South America Plants Phenotyping Market Revenue (Million) Forecast, by Application 2020 & 2033
- Table 25: Global Plants Phenotyping Market Revenue Million Forecast, by Production Analysis 2020 & 2033
- Table 26: Global Plants Phenotyping Market Revenue Million Forecast, by Consumption Analysis 2020 & 2033
- Table 27: Global Plants Phenotyping Market Revenue Million Forecast, by Import Market Analysis (Value & Volume) 2020 & 2033
- Table 28: Global Plants Phenotyping Market Revenue Million Forecast, by Export Market Analysis (Value & Volume) 2020 & 2033
- Table 29: Global Plants Phenotyping Market Revenue Million Forecast, by Price Trend Analysis 2020 & 2033
- Table 30: Global Plants Phenotyping Market Revenue Million Forecast, by Country 2020 & 2033
- Table 31: United Kingdom Plants Phenotyping Market Revenue (Million) Forecast, by Application 2020 & 2033
- Table 32: Germany Plants Phenotyping Market Revenue (Million) Forecast, by Application 2020 & 2033
- Table 33: France Plants Phenotyping Market Revenue (Million) Forecast, by Application 2020 & 2033
- Table 34: Italy Plants Phenotyping Market Revenue (Million) Forecast, by Application 2020 & 2033
- Table 35: Spain Plants Phenotyping Market Revenue (Million) Forecast, by Application 2020 & 2033
- Table 36: Russia Plants Phenotyping Market Revenue (Million) Forecast, by Application 2020 & 2033
- Table 37: Benelux Plants Phenotyping Market Revenue (Million) Forecast, by Application 2020 & 2033
- Table 38: Nordics Plants Phenotyping Market Revenue (Million) Forecast, by Application 2020 & 2033
- Table 39: Rest of Europe Plants Phenotyping Market Revenue (Million) Forecast, by Application 2020 & 2033
- Table 40: Global Plants Phenotyping Market Revenue Million Forecast, by Production Analysis 2020 & 2033
- Table 41: Global Plants Phenotyping Market Revenue Million Forecast, by Consumption Analysis 2020 & 2033
- Table 42: Global Plants Phenotyping Market Revenue Million Forecast, by Import Market Analysis (Value & Volume) 2020 & 2033
- Table 43: Global Plants Phenotyping Market Revenue Million Forecast, by Export Market Analysis (Value & Volume) 2020 & 2033
- Table 44: Global Plants Phenotyping Market Revenue Million Forecast, by Price Trend Analysis 2020 & 2033
- Table 45: Global Plants Phenotyping Market Revenue Million Forecast, by Country 2020 & 2033
- Table 46: Turkey Plants Phenotyping Market Revenue (Million) Forecast, by Application 2020 & 2033
- Table 47: Israel Plants Phenotyping Market Revenue (Million) Forecast, by Application 2020 & 2033
- Table 48: GCC Plants Phenotyping Market Revenue (Million) Forecast, by Application 2020 & 2033
- Table 49: North Africa Plants Phenotyping Market Revenue (Million) Forecast, by Application 2020 & 2033
- Table 50: South Africa Plants Phenotyping Market Revenue (Million) Forecast, by Application 2020 & 2033
- Table 51: Rest of Middle East & Africa Plants Phenotyping Market Revenue (Million) Forecast, by Application 2020 & 2033
- Table 52: Global Plants Phenotyping Market Revenue Million Forecast, by Production Analysis 2020 & 2033
- Table 53: Global Plants Phenotyping Market Revenue Million Forecast, by Consumption Analysis 2020 & 2033
- Table 54: Global Plants Phenotyping Market Revenue Million Forecast, by Import Market Analysis (Value & Volume) 2020 & 2033
- Table 55: Global Plants Phenotyping Market Revenue Million Forecast, by Export Market Analysis (Value & Volume) 2020 & 2033
- Table 56: Global Plants Phenotyping Market Revenue Million Forecast, by Price Trend Analysis 2020 & 2033
- Table 57: Global Plants Phenotyping Market Revenue Million Forecast, by Country 2020 & 2033
- Table 58: China Plants Phenotyping Market Revenue (Million) Forecast, by Application 2020 & 2033
- Table 59: India Plants Phenotyping Market Revenue (Million) Forecast, by Application 2020 & 2033
- Table 60: Japan Plants Phenotyping Market Revenue (Million) Forecast, by Application 2020 & 2033
- Table 61: South Korea Plants Phenotyping Market Revenue (Million) Forecast, by Application 2020 & 2033
- Table 62: ASEAN Plants Phenotyping Market Revenue (Million) Forecast, by Application 2020 & 2033
- Table 63: Oceania Plants Phenotyping Market Revenue (Million) Forecast, by Application 2020 & 2033
- Table 64: Rest of Asia Pacific Plants Phenotyping Market Revenue (Million) Forecast, by Application 2020 & 2033
Frequently Asked Questions
1. What is the projected Compound Annual Growth Rate (CAGR) of the Plants Phenotyping Market?
The projected CAGR is approximately 10.50%.
2. Which companies are prominent players in the Plants Phenotyping Market?
Key companies in the market include Rothamsted Research, Phenospex, Delta-T Devices, Keygene, PSI (Photon Systems Instruments), BASF SE (Crop Design), Heinz Walz GmbH, The Vienna Biocenter Core Facilities, LemnaTec GmbH, Phenomix, WP, Qubit Systems.
3. What are the main segments of the Plants Phenotyping Market?
The market segments include Production Analysis, Consumption Analysis, Import Market Analysis (Value & Volume), Export Market Analysis (Value & Volume), Price Trend Analysis.
4. Can you provide details about the market size?
The market size is estimated to be USD 281.32 Million as of 2022.
5. What are some drivers contributing to market growth?
Demand For Landscaping Maintenance; Adoption of Green Spaces and Green Roofs.
6. What are the notable trends driving market growth?
Increasing Number of Seed Borne Diseases is Driving the Market.
7. Are there any restraints impacting market growth?
Shortage of Labor In Landscaping; High Maintenance Cost of Lawn Mowers.
8. Can you provide examples of recent developments in the market?
N/A
9. What pricing options are available for accessing the report?
Pricing options include single-user, multi-user, and enterprise licenses priced at USD 4750, USD 5250, and USD 8750 respectively.
10. Is the market size provided in terms of value or volume?
The market size is provided in terms of value, measured in Million.
11. Are there any specific market keywords associated with the report?
Yes, the market keyword associated with the report is "Plants Phenotyping Market," which aids in identifying and referencing the specific market segment covered.
12. How do I determine which pricing option suits my needs best?
The pricing options vary based on user requirements and access needs. Individual users may opt for single-user licenses, while businesses requiring broader access may choose multi-user or enterprise licenses for cost-effective access to the report.
13. Are there any additional resources or data provided in the Plants Phenotyping Market report?
While the report offers comprehensive insights, it's advisable to review the specific contents or supplementary materials provided to ascertain if additional resources or data are available.
14. How can I stay updated on further developments or reports in the Plants Phenotyping Market?
To stay informed about further developments, trends, and reports in the Plants Phenotyping Market, consider subscribing to industry newsletters, following relevant companies and organizations, or regularly checking reputable industry news sources and publications.
Methodology
Step 1 - Identification of Relevant Samples Size from Population Database


Step 2 - Approaches for Defining Global Market Size (Value, Volume* & Price*)

Note*: In applicable scenarios
Step 3 - Data Sources
Primary Research
- Web Analytics
- Survey Reports
- Research Institute
- Latest Research Reports
- Opinion Leaders
Secondary Research
- Annual Reports
- White Paper
- Latest Press Release
- Industry Association
- Paid Database
- Investor Presentations

Step 4 - Data Triangulation
Involves using different sources of information in order to increase the validity of a study
These sources are likely to be stakeholders in a program - participants, other researchers, program staff, other community members, and so on.
Then we put all data in single framework & apply various statistical tools to find out the dynamic on the market.
During the analysis stage, feedback from the stakeholder groups would be compared to determine areas of agreement as well as areas of divergence