

Key Insights
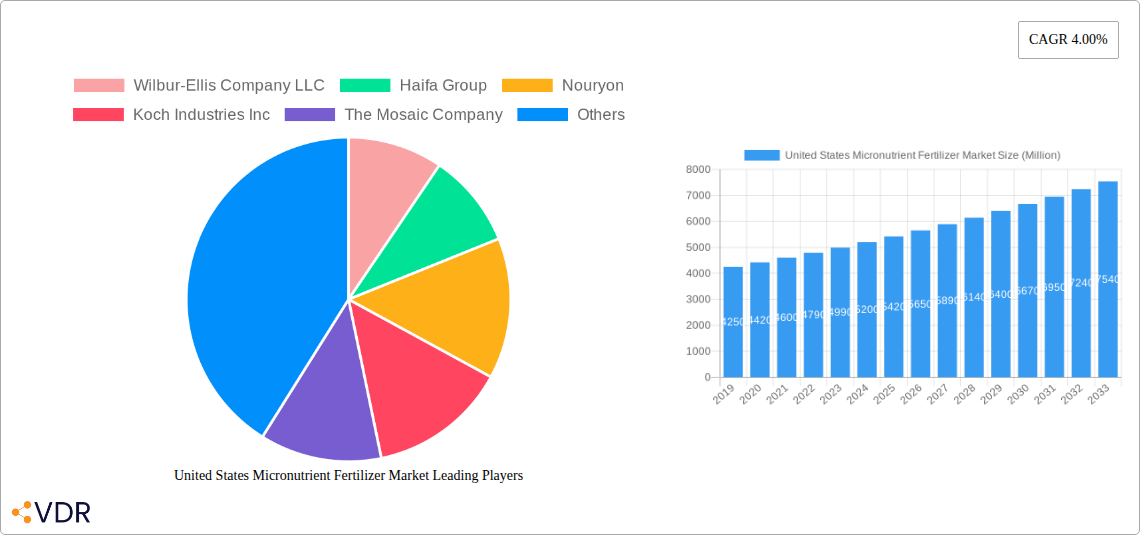
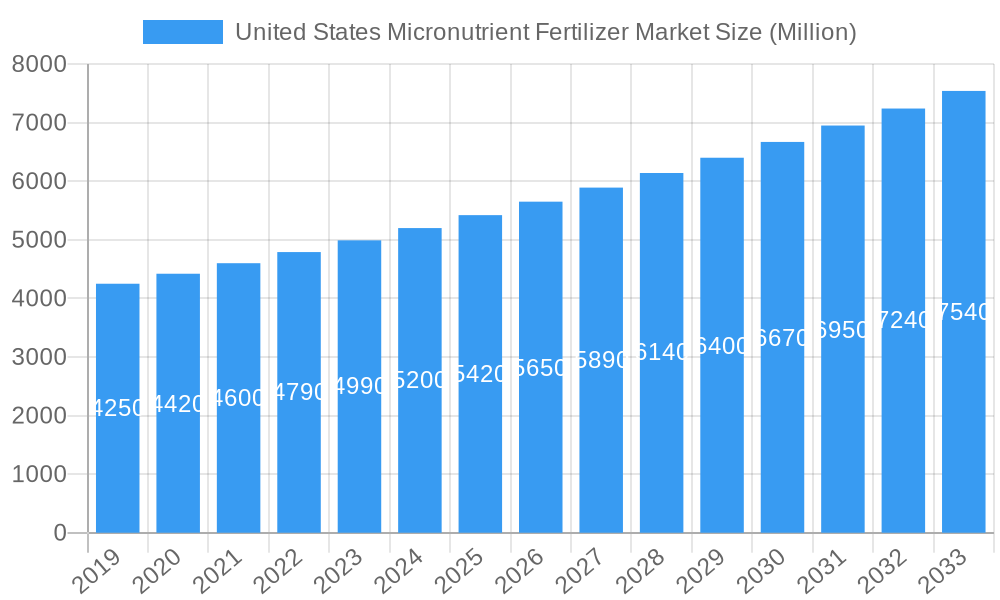
The United States micronutrient fertilizer market is poised for robust expansion, projected to reach an estimated market size of approximately $5,500 million in 2025, with a Compound Annual Growth Rate (CAGR) of 4.00% through 2033. This growth is primarily fueled by increasing awareness among farmers regarding the critical role of micronutrients in enhancing crop yield and quality. The demand for micronutrient fertilizers is being driven by evolving agricultural practices, a growing emphasis on sustainable farming, and the need to address soil deficiencies that are becoming more prevalent due to intensive farming. Furthermore, the rising global food demand necessitates optimized agricultural output, making micronutrient fertilizers an indispensable component of modern crop nutrition strategies. Key micronutrients like zinc, iron, manganese, copper, boron, and molybdenum are crucial for plant physiological processes, and their deficiency can significantly hinder growth and productivity, thus creating a sustained demand.
United States Micronutrient Fertilizer Market Market Size (In Billion)
The market's trajectory is further shaped by a dynamic interplay of trends and restraints. Prominent trends include the increasing adoption of chelated micronutrients for better bioavailability, the development of water-soluble and foliar-applied formulations for efficient nutrient delivery, and the integration of precision agriculture technologies that enable targeted application of micronutrients. However, challenges such as the high cost of some micronutrient fertilizers, fluctuating raw material prices, and the need for greater farmer education on proper application can pose significant restraints. The market is segmented across production, consumption, import, export, and price trends, with the United States exhibiting substantial domestic production and consumption. Key players like Yara International AS, The Mosaic Company, and Nutrien are actively investing in research and development to offer innovative solutions and expand their market reach within this vital agricultural sector.
United States Micronutrient Fertilizer Market Company Market Share
United States Micronutrient Fertilizer Market: Growth, Trends, and Strategic Outlook (2019-2033)
This comprehensive report delivers an in-depth analysis of the United States Micronutrient Fertilizer Market, a critical segment within the broader agricultural input market. We provide a granular examination of market dynamics, growth trajectories, and strategic opportunities for stakeholders from 2019 to 2033, with a base and estimated year of 2025 and a forecast period of 2025–2033. This report is essential for understanding the evolving landscape of specialty fertilizers, crop nutrition solutions, and precision agriculture.
The report meticulously covers:
- Production Analysis: Insights into manufacturing capabilities and regional output.
- Consumption Analysis: Detailed breakdown of demand across various agricultural sectors.
- Import Market Analysis (Value & Volume): Understanding global supply chain integration and trade flows.
- Export Market Analysis (Value & Volume): Assessing the US's role in the global micronutrient fertilizer trade.
- Price Trend Analysis: Tracking price fluctuations and their underlying drivers.
- Industry Developments: Key M&A activities, product launches, and strategic partnerships.
Keywords: United States Micronutrient Fertilizer Market, Specialty Fertilizers, Crop Nutrition, Agricultural Inputs, Precision Agriculture, Soil Health, Plant Nutrients, Zinc Fertilizer, Iron Fertilizer, Manganese Fertilizer, Boron Fertilizer, Copper Fertilizer, Molybdenum Fertilizer, Chelated Micronutrients, Foliar Fertilizers, Granular Fertilizers, Liquid Fertilizers, Farm Management, Sustainable Agriculture, Organic Fertilizers, Soil Testing, Crop Yield, Agricultural Chemicals, Agrochemicals, Fertilizers Market, Child Market, Parent Market, Wilbur-Ellis Company LLC, Haifa Group, Nouryon, Koch Industries Inc, The Mosaic Company, The Andersons Inc, Yara International AS, Sociedad Quimica y Minera de Chile SA.
United States Micronutrient Fertilizer Market Market Dynamics & Structure
The United States Micronutrient Fertilizer Market is characterized by a moderately concentrated structure, with key players like Wilbur-Ellis Company LLC, Haifa Group, Nouryon, Koch Industries Inc, The Mosaic Company, The Andersons Inc, Yara International AS, and Sociedad Quimica y Minera de Chile SA holding significant market shares. Technological innovation is a primary driver, fueled by advancements in chelating micronutrient formulations, foliar application techniques, and the increasing adoption of precision agriculture technologies that enable targeted nutrient delivery. Regulatory frameworks, particularly those concerning environmental impact and product safety, play a crucial role in shaping market access and product development. Competitive product substitutes include enhanced efficiency fertilizers and organic nutrient sources, but the specific efficacy of micronutrients in addressing deficiencies remains a strong differentiator. End-user demographics are evolving, with a growing segment of progressive farmers and large agricultural corporations prioritizing soil health and crop yield optimization. Mergers and acquisitions (M&A) are actively reshaping the market landscape. For instance, the acquisition of ADOB by Nouryon in April 2023 significantly broadened Nouryon’s innovative crop nutrition portfolio, demonstrating a strategic move to consolidate expertise and expand product offerings. The Andersons’ acquisition of Mote Farm Service Inc. in October 2022 highlights a trend towards expanding retail networks to enhance farmer accessibility.
- Market Concentration: Moderately concentrated with a few dominant players.
- Technological Drivers: Chelation technology, foliar application, nanotechnology in fertilizers.
- Regulatory Influence: EPA regulations, organic certification standards.
- Competitive Landscape: Competition from enhanced efficiency fertilizers and organic alternatives.
- End-User Segmentation: Large-scale commercial farms, organic farms, specialty crop producers.
- M&A Trends: Strategic acquisitions to enhance product portfolios and market reach.
United States Micronutrient Fertilizer Market Growth Trends & Insights
The United States Micronutrient Fertilizer Market is poised for robust growth, driven by a confluence of factors that are transforming agricultural practices. The increasing awareness among farmers about the detrimental effects of micronutrient deficiencies on crop yield and quality is a significant catalyst. As the global population continues to expand, the demand for higher agricultural productivity necessitates optimized nutrient management, placing micronutrient fertilizers at the forefront of modern farming. The market is witnessing a steady evolution in adoption rates, particularly among growers who are embracing data-driven farming techniques. These advancements, coupled with a deeper understanding of soil science and plant physiology, are encouraging the proactive application of micronutrients rather than merely reactive measures.
Technological disruptions are playing a pivotal role, with the development of novel delivery systems and enhanced formulations. Chelated micronutrients offer superior bioavailability, ensuring that essential elements like zinc, iron, manganese, and boron are readily absorbed by plants, even in challenging soil conditions. Furthermore, the rise of liquid fertilizers and foliar sprays allows for rapid nutrient uptake, providing quick solutions to crop stress and deficiency symptoms. Consumer behavior shifts are also contributing to market expansion. There is a growing preference for nutrient-dense food products, which directly links to the nutritional quality imparted by optimal plant nutrition, including micronutrients. This has led to a greater emphasis on soil health and sustainable farming practices, where micronutrient management is an integral component.
The market penetration of micronutrient fertilizers is expanding beyond traditional row crops to include high-value specialty crops such as fruits, vegetables, and nuts, where even minor deficiencies can significantly impact quality and marketability. The shift towards precision agriculture further accelerates this trend, enabling farmers to conduct detailed soil and tissue analyses and apply micronutrients precisely where and when they are needed, thereby maximizing efficiency and minimizing waste. The CAGR for the US micronutrient fertilizer market is projected to be in the range of XX% over the forecast period, indicative of sustained demand and innovation. This growth is underpinned by a deep understanding of the child market segment's specific needs and the parent market's overall agricultural economic drivers.
Dominant Regions, Countries, or Segments in United States Micronutrient Fertilizer Market
The United States Micronutrient Fertilizer Market exhibits regional dominance driven by a complex interplay of agricultural intensity, soil conditions, crop types, and economic factors. From a Production Analysis perspective, the Midwest region, often referred to as the "breadbasket of America," is a significant contributor due to its vast acreage of corn, soybeans, and wheat, which have substantial micronutrient requirements. States like Iowa, Illinois, and Indiana are key production hubs for both fertilizer manufacturing and formulation.
In terms of Consumption Analysis, the dominance is similarly tilted towards the agricultural heartland. The extensive cultivation of major crops necessitates large volumes of essential micronutrients to optimize yields and ensure crop quality. Beyond the Midwest, the West Coast, particularly California, represents a crucial consumption segment due to its diverse and high-value specialty crop production, including fruits, vegetables, and nuts. These crops are often highly sensitive to micronutrient imbalances, driving demand for specialized formulations.
The Import Market Analysis (Value & Volume) reveals that while the US is a significant producer, it also relies on imports for certain raw materials and specialized micronutrient products. Countries in South America, particularly Chile, are major exporters of key mineral inputs relevant to the fertilizer industry, influencing the import landscape. The Export Market Analysis (Value & Volume) showcases the US as a net exporter of some fertilizer products, but the export of highly specialized micronutrient formulations is also growing as US companies expand their global reach.
The Price Trend Analysis is influenced by global commodity prices, energy costs, and domestic supply-demand dynamics. The price of key micronutrients like zinc sulfate and iron chelates can fluctuate based on the availability of their primary sources and manufacturing costs. Regionally, pricing can vary based on transportation costs and local market competition.
Across these analytical segments, the Midwest and California consistently emerge as dominant forces. The Midwest leads in terms of sheer volume consumption due to its vast agricultural scale. California, however, represents a significant child market within the broader agricultural input sector due to its high demand for specialized, premium micronutrient products driven by crop value and precise nutritional needs. Economic policies supporting agriculture, robust infrastructure for distribution, and extensive agricultural extension services in these regions further solidify their dominance. The market share for micronutrients in these key regions often exceeds XX% of the national total, driven by specific crop needs and advanced farming practices.
United States Micronutrient Fertilizer Market Product Landscape
The United States Micronutrient Fertilizer Market product landscape is characterized by innovation focused on enhancing nutrient availability and delivery. Key products include zinc, iron, manganese, boron, copper, and molybdenum fertilizers, offered in various forms such as sulfates, chelates, and oxides. Chelated forms, utilizing agents like EDTA, DTPA, and EDDHA, are highly valued for their stability and efficiency in complex soil environments, ensuring consistent plant uptake. Foliar fertilizers, delivering nutrients directly to the plant's leaves, represent a significant application for rapid correction of deficiencies and stress mitigation. These products are engineered for improved adhesion, penetration, and translocation within the plant, offering unique selling propositions in terms of quick efficacy and targeted intervention. Technological advancements are also seen in slow-release formulations and the integration of micronutrients with other crop enhancement solutions.
Key Drivers, Barriers & Challenges in United States Micronutrient Fertilizer Market
Key Drivers:
- Increasing Awareness of Soil Health: Farmers are recognizing the critical role of micronutrients in overall soil fertility and plant vitality.
- Demand for Higher Crop Yields and Quality: To meet growing food demands, optimizing nutrient uptake is paramount for maximizing agricultural output.
- Advancements in Precision Agriculture: Technologies enabling precise soil testing and targeted nutrient application are boosting micronutrient adoption.
- Growth of Specialty Crops: High-value crops often have more specific and demanding micronutrient requirements.
- Government Support and Subsidies: Initiatives promoting sustainable farming practices can indirectly encourage micronutrient use.
Barriers & Challenges:
- High Cost of Production and Application: Specialized micronutrient formulations can be more expensive than macronutrient fertilizers.
- Lack of Farmer Education and Awareness: In some regions, there's a need for greater understanding of micronutrient importance and correct application.
- Complex Soil Chemistry: Interactions within the soil can affect micronutrient availability and uptake, requiring sophisticated solutions.
- Regulatory Hurdles: Obtaining approvals for new formulations and ensuring compliance with environmental standards can be time-consuming and costly.
- Supply Chain Disruptions: Global events can impact the availability and price of raw materials for micronutrient production.
- Competition from Generic Products: Market saturation with less effective or imitation products can pose challenges for premium offerings.
Emerging Opportunities in United States Micronutrient Fertilizer Market
Emerging opportunities in the United States Micronutrient Fertilizer Market lie in the development of bio-based and organic micronutrient solutions, catering to the growing demand for sustainable and environmentally friendly agricultural inputs. The integration of micronutrient delivery with advanced digital farming platforms, offering personalized nutrient recommendations based on real-time data analytics, presents a significant growth avenue. Furthermore, untapped markets in niche agricultural sectors, such as urban farming and hydroponics, require specialized micronutrient blends that can be tailored to controlled environment agriculture. Evolving consumer preferences for nutrient-fortified foods also drive demand for micronutrients that enhance the nutritional profile of crops, creating opportunities for product differentiation.
Growth Accelerators in the United States Micronutrient Fertilizer Market Industry
Long-term growth in the United States Micronutrient Fertilizer Market is being accelerated by continuous technological breakthroughs in formulation and delivery. The development of nano-fertilizers offering enhanced nutrient solubility and absorption is a key catalyst. Strategic partnerships between fertilizer manufacturers, agricultural technology providers, and research institutions are fostering innovation and accelerating product development cycles. Market expansion strategies, including the penetration of underserved regional markets within the US and the export of advanced micronutrient solutions to global markets, are also significant growth drivers. The increasing focus on crop-specific nutrient management plans, driven by scientific research and field trials, is solidifying the role of micronutrients in maximizing agricultural productivity and profitability.
Key Players Shaping the United States Micronutrient Fertilizer Market Market
- Wilbur-Ellis Company LLC
- Haifa Group
- Nouryon
- Koch Industries Inc
- The Mosaic Company
- The Andersons Inc
- Yara International AS
- Sociedad Quimica y Minera de Chile SA
Notable Milestones in United States Micronutrient Fertilizer Market Sector
- April 2023: Nouryon acquired ADOB, a Polish provider of chelating micronutrients and specialty farming solutions, significantly broadening its innovative crop nutrition portfolio.
- October 2022: The Andersons entered an agreement to acquire the assets of Mote Farm Service Inc., aiming to expand its retail farm center network.
- March 2022: Haifa Group entered a purchase agreement with HORTICOOP BV to acquire Horticoop Andina, a distributor of agricultural nutritional products, to expand its Latin American market presence and strengthen its global brand in advanced plant nutrition.
In-Depth United States Micronutrient Fertilizer Market Market Outlook
The United States Micronutrient Fertilizer Market is characterized by a promising future, fueled by ongoing advancements in agricultural science and technology. Growth accelerators like the development of bio-stimulant-enhanced micronutrient formulations and the wider adoption of digital soil analysis tools will continue to drive market expansion. Strategic partnerships and collaborations between key industry players are expected to foster innovation and lead to the introduction of more efficient and sustainable crop nutrition solutions. The increasing emphasis on precision farming and the demand for nutrient-dense crops will further solidify the market's trajectory. Future opportunities lie in the development of tailor-made micronutrient solutions for specific soil types and crop varieties, thereby unlocking new revenue streams and enhancing agricultural sustainability. The market is projected to witness sustained growth driven by the imperative to maximize food production while minimizing environmental impact.
United States Micronutrient Fertilizer Market Segmentation
- 1. Production Analysis
- 2. Consumption Analysis
- 3. Import Market Analysis (Value & Volume)
- 4. Export Market Analysis (Value & Volume)
- 5. Price Trend Analysis
United States Micronutrient Fertilizer Market Segmentation By Geography
- 1. United States
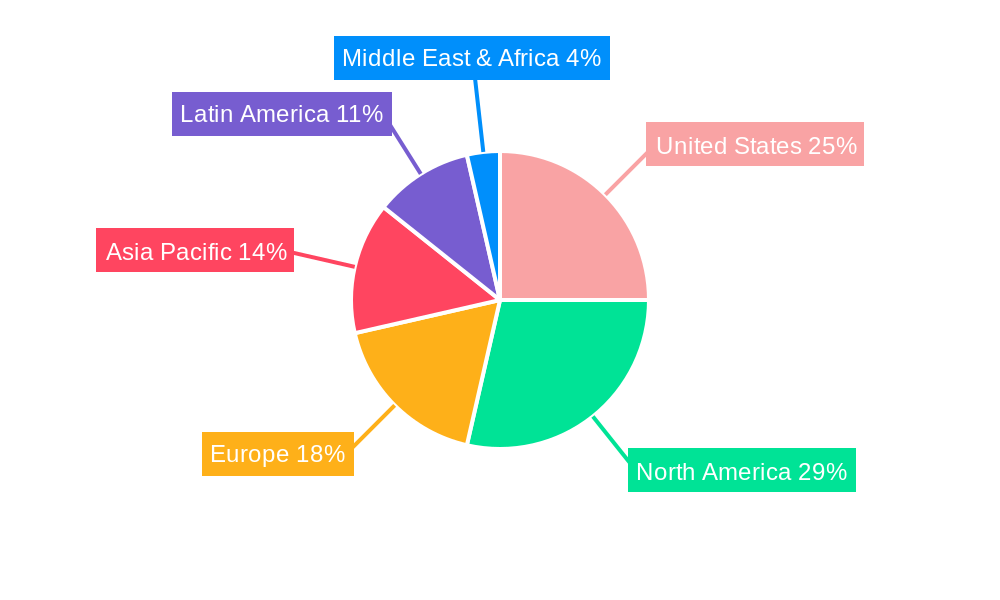
United States Micronutrient Fertilizer Market Regional Market Share
Geographic Coverage of United States Micronutrient Fertilizer Market
United States Micronutrient Fertilizer Market REPORT HIGHLIGHTS
| Aspects | Details |
|---|---|
| Study Period | 2020-2034 |
| Base Year | 2025 |
| Estimated Year | 2026 |
| Forecast Period | 2026-2034 |
| Historical Period | 2020-2025 |
| Growth Rate | CAGR of 4.00% from 2020-2034 |
| Segmentation |
|
Table of Contents
- 1. Introduction
- 1.1. Research Scope
- 1.2. Market Segmentation
- 1.3. Research Objective
- 1.4. Definitions and Assumptions
- 2. Executive Summary
- 2.1. Market Snapshot
- 3. Market Dynamics
- 3.1. Market Drivers
- 3.2. Market Restrains
- 3.3. Market Trends
- 3.4. Market Opportunities
- 4. Market Factor Analysis
- 4.1. Porters Five Forces
- 4.1.1. Bargaining Power of Suppliers
- 4.1.2. Bargaining Power of Buyers
- 4.1.3. Threat of New Entrants
- 4.1.4. Threat of Substitutes
- 4.1.5. Competitive Rivalry
- 4.2. PESTEL analysis
- 4.3. BCG Analysis
- 4.3.1. Stars (High Growth, High Market Share)
- 4.3.2. Cash Cows (Low Growth, High Market Share)
- 4.3.3. Question Mark (High Growth, Low Market Share)
- 4.3.4. Dogs (Low Growth, Low Market Share)
- 4.4. Ansoff Matrix Analysis
- 4.5. Supply Chain Analysis
- 4.6. Regulatory Landscape
- 4.7. Current Market Potential and Opportunity Assessment (TAM–SAM–SOM Framework)
- 4.8. VDR Analyst Note
- 4.1. Porters Five Forces
- 5. Market Analysis, Insights and Forecast 2021-2033
- 5.1. Market Analysis, Insights and Forecast - by Production Analysis
- 5.2. Market Analysis, Insights and Forecast - by Consumption Analysis
- 5.3. Market Analysis, Insights and Forecast - by Import Market Analysis (Value & Volume)
- 5.4. Market Analysis, Insights and Forecast - by Export Market Analysis (Value & Volume)
- 5.5. Market Analysis, Insights and Forecast - by Price Trend Analysis
- 5.6. Market Analysis, Insights and Forecast - by Region
- 5.6.1. United States
- 6. United States Micronutrient Fertilizer Market Analysis, Insights and Forecast, 2021-2033
- 6.1. Market Analysis, Insights and Forecast - by Production Analysis
- 6.2. Market Analysis, Insights and Forecast - by Consumption Analysis
- 6.3. Market Analysis, Insights and Forecast - by Import Market Analysis (Value & Volume)
- 6.4. Market Analysis, Insights and Forecast - by Export Market Analysis (Value & Volume)
- 6.5. Market Analysis, Insights and Forecast - by Price Trend Analysis
- 7. Competitive Analysis
- 7.1. Company Profiles
- 7.1.1 Wilbur-Ellis Company LLC
- 7.1.1.1. Company Overview
- 7.1.1.2. Products
- 7.1.1.3. Company Financials
- 7.1.1.4. SWOT Analysis
- 7.1.2 Haifa Group
- 7.1.2.1. Company Overview
- 7.1.2.2. Products
- 7.1.2.3. Company Financials
- 7.1.2.4. SWOT Analysis
- 7.1.3 Nouryon
- 7.1.3.1. Company Overview
- 7.1.3.2. Products
- 7.1.3.3. Company Financials
- 7.1.3.4. SWOT Analysis
- 7.1.4 Koch Industries Inc
- 7.1.4.1. Company Overview
- 7.1.4.2. Products
- 7.1.4.3. Company Financials
- 7.1.4.4. SWOT Analysis
- 7.1.5 The Mosaic Company
- 7.1.5.1. Company Overview
- 7.1.5.2. Products
- 7.1.5.3. Company Financials
- 7.1.5.4. SWOT Analysis
- 7.1.6 The Andersons Inc
- 7.1.6.1. Company Overview
- 7.1.6.2. Products
- 7.1.6.3. Company Financials
- 7.1.6.4. SWOT Analysis
- 7.1.7 Yara International AS
- 7.1.7.1. Company Overview
- 7.1.7.2. Products
- 7.1.7.3. Company Financials
- 7.1.7.4. SWOT Analysis
- 7.1.8 Sociedad Quimica y Minera de Chile SA
- 7.1.8.1. Company Overview
- 7.1.8.2. Products
- 7.1.8.3. Company Financials
- 7.1.8.4. SWOT Analysis
- 7.1.1 Wilbur-Ellis Company LLC
- 7.2. Market Entropy
- 7.2.1 Company's Key Areas Served
- 7.2.2 Recent Developments
- 7.3. Company Market Share Analysis 2025
- 7.3.1 Top 5 Companies Market Share Analysis
- 7.3.2 Top 3 Companies Market Share Analysis
- 7.4. List of Potential Customers
- 8. Research Methodology
List of Figures
- Figure 1: United States Micronutrient Fertilizer Market Revenue Breakdown (Million, %) by Product 2025 & 2033
- Figure 2: United States Micronutrient Fertilizer Market Share (%) by Company 2025
List of Tables
- Table 1: United States Micronutrient Fertilizer Market Revenue Million Forecast, by Production Analysis 2020 & 2033
- Table 2: United States Micronutrient Fertilizer Market Revenue Million Forecast, by Consumption Analysis 2020 & 2033
- Table 3: United States Micronutrient Fertilizer Market Revenue Million Forecast, by Import Market Analysis (Value & Volume) 2020 & 2033
- Table 4: United States Micronutrient Fertilizer Market Revenue Million Forecast, by Export Market Analysis (Value & Volume) 2020 & 2033
- Table 5: United States Micronutrient Fertilizer Market Revenue Million Forecast, by Price Trend Analysis 2020 & 2033
- Table 6: United States Micronutrient Fertilizer Market Revenue Million Forecast, by Region 2020 & 2033
- Table 7: United States Micronutrient Fertilizer Market Revenue Million Forecast, by Production Analysis 2020 & 2033
- Table 8: United States Micronutrient Fertilizer Market Revenue Million Forecast, by Consumption Analysis 2020 & 2033
- Table 9: United States Micronutrient Fertilizer Market Revenue Million Forecast, by Import Market Analysis (Value & Volume) 2020 & 2033
- Table 10: United States Micronutrient Fertilizer Market Revenue Million Forecast, by Export Market Analysis (Value & Volume) 2020 & 2033
- Table 11: United States Micronutrient Fertilizer Market Revenue Million Forecast, by Price Trend Analysis 2020 & 2033
- Table 12: United States Micronutrient Fertilizer Market Revenue Million Forecast, by Country 2020 & 2033
Frequently Asked Questions
1. What is the projected Compound Annual Growth Rate (CAGR) of the United States Micronutrient Fertilizer Market?
The projected CAGR is approximately 4.00%.
2. Which companies are prominent players in the United States Micronutrient Fertilizer Market?
Key companies in the market include Wilbur-Ellis Company LLC, Haifa Group, Nouryon, Koch Industries Inc, The Mosaic Company, The Andersons Inc, Yara International AS, Sociedad Quimica y Minera de Chile SA.
3. What are the main segments of the United States Micronutrient Fertilizer Market?
The market segments include Production Analysis, Consumption Analysis, Import Market Analysis (Value & Volume), Export Market Analysis (Value & Volume), Price Trend Analysis.
4. Can you provide details about the market size?
The market size is estimated to be USD XX Million as of 2022.
5. What are some drivers contributing to market growth?
Awareness of Landscaping Maintenance; Technological Advancements.
6. What are the notable trends driving market growth?
OTHER KEY INDUSTRY TRENDS COVERED IN THE REPORT.
7. Are there any restraints impacting market growth?
Shortage of Skilled Labor; Wastage of High Amount of Water For Irrigating Lawns.
8. Can you provide examples of recent developments in the market?
April 2023: ADOB, a major provider of chelating micronutrients, foliar, and other specialty farming solutions based in Poland, was acquired by Nouryon. Through the acquisition, the company broadened its innovative crop nutrition portfolio.October 2022: The Andersons entered an agreement to acquire the assets of Mote Farm Service Inc. to expand its retail farm center network.March 2022: The Haifa Group entered a purchase agreement with HORTICOOP BV to acquire Horticoop Andina, the distributor of nutritional products for agriculture. Through this acquisition of the brand, Haifa intends to expand its market presence in the Latin market and strengthen its position as a global superbrand in advanced plant nutrition.
9. What pricing options are available for accessing the report?
Pricing options include single-user, multi-user, and enterprise licenses priced at USD 3800, USD 4500, and USD 5800 respectively.
10. Is the market size provided in terms of value or volume?
The market size is provided in terms of value, measured in Million.
11. Are there any specific market keywords associated with the report?
Yes, the market keyword associated with the report is "United States Micronutrient Fertilizer Market," which aids in identifying and referencing the specific market segment covered.
12. How do I determine which pricing option suits my needs best?
The pricing options vary based on user requirements and access needs. Individual users may opt for single-user licenses, while businesses requiring broader access may choose multi-user or enterprise licenses for cost-effective access to the report.
13. Are there any additional resources or data provided in the United States Micronutrient Fertilizer Market report?
While the report offers comprehensive insights, it's advisable to review the specific contents or supplementary materials provided to ascertain if additional resources or data are available.
14. How can I stay updated on further developments or reports in the United States Micronutrient Fertilizer Market?
To stay informed about further developments, trends, and reports in the United States Micronutrient Fertilizer Market, consider subscribing to industry newsletters, following relevant companies and organizations, or regularly checking reputable industry news sources and publications.
Methodology
Step 1 - Identification of Relevant Samples Size from Population Database


Step 2 - Approaches for Defining Global Market Size (Value, Volume* & Price*)

Note*: In applicable scenarios
Step 3 - Data Sources
Primary Research
- Web Analytics
- Survey Reports
- Research Institute
- Latest Research Reports
- Opinion Leaders
Secondary Research
- Annual Reports
- White Paper
- Latest Press Release
- Industry Association
- Paid Database
- Investor Presentations

Step 4 - Data Triangulation
Involves using different sources of information in order to increase the validity of a study
These sources are likely to be stakeholders in a program - participants, other researchers, program staff, other community members, and so on.
Then we put all data in single framework & apply various statistical tools to find out the dynamic on the market.
During the analysis stage, feedback from the stakeholder groups would be compared to determine areas of agreement as well as areas of divergence