

Key Insights
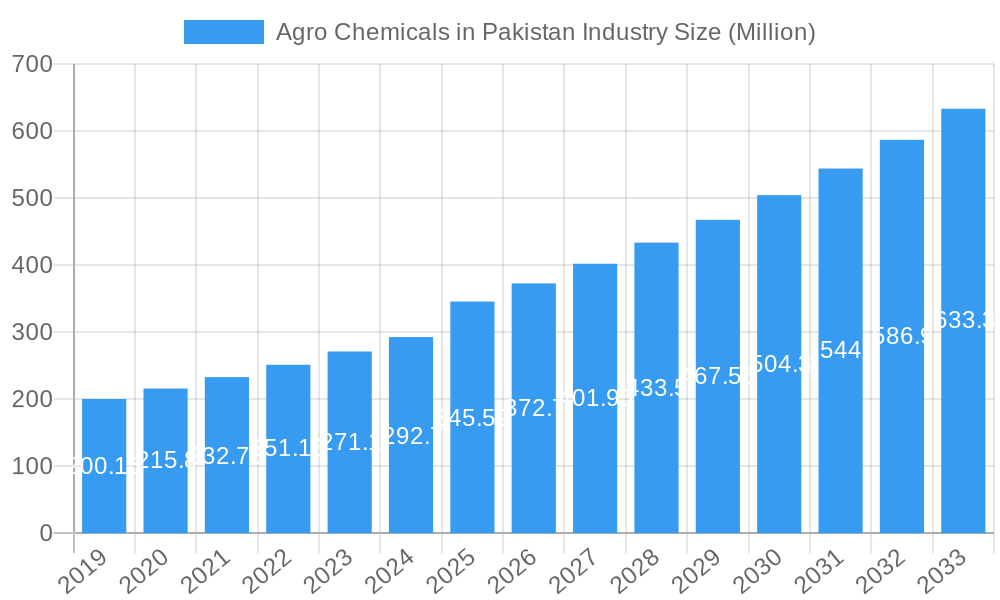
The Agro Chemicals market in Pakistan is poised for significant expansion, projected to reach an estimated USD 345.59 million by 2025. This growth is propelled by a robust Compound Annual Growth Rate (CAGR) of 7.99% throughout the forecast period of 2025-2033. Key drivers fueling this upward trajectory include the increasing demand for enhanced crop yields to meet the growing food requirements of a burgeoning population, coupled with a rising awareness among farmers regarding the benefits of advanced agricultural inputs for improved productivity and pest management. The Pakistani government's initiatives aimed at modernizing the agricultural sector, including subsidies and promotion of efficient farming practices, are also instrumental in this market's expansion. Furthermore, an increasing adoption of crop protection chemicals and fertilizers is observed as farmers seek to mitigate losses from pests and diseases, thereby safeguarding their investments and improving overall farm profitability.
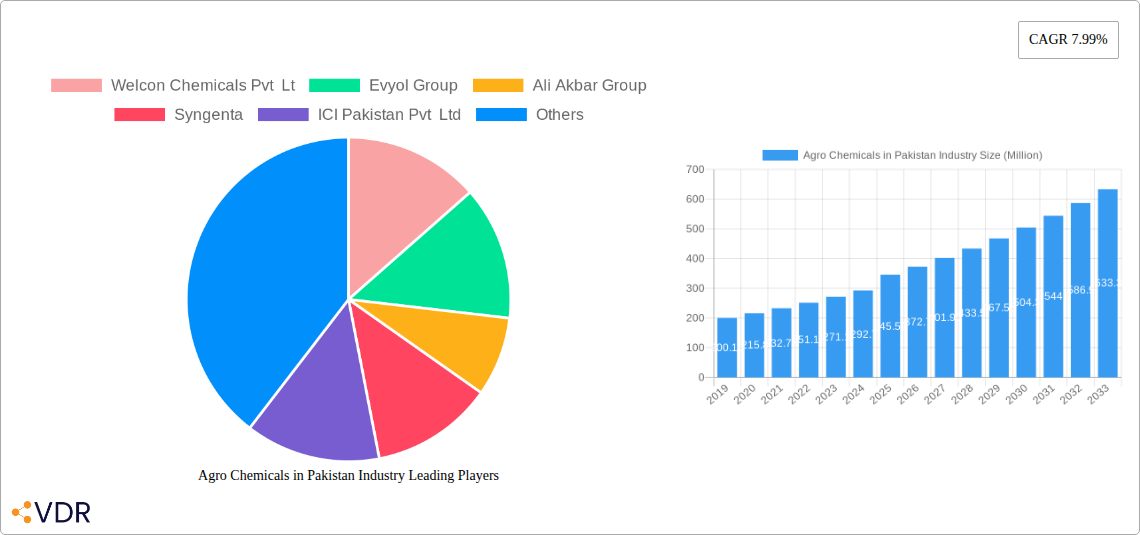
Agro Chemicals in Pakistan Industry Market Size (In Million)
The market's dynamics are further shaped by several prevailing trends, such as the growing preference for bio-based and eco-friendly agrochemicals, driven by environmental concerns and regulatory pressures. This shift presents opportunities for innovation and market differentiation. However, the market also faces certain restraints, including the rising cost of raw materials, which can impact the affordability of agrochemicals for smallholder farmers. Fluctuations in currency exchange rates and import duties also pose challenges to market stability. Despite these hurdles, the comprehensive analysis of production, consumption, import, export, and price trends, alongside the presence of major industry players like Syngenta, BASF SE, and Bayer AG, indicates a dynamic and evolving market landscape. The segmentation of the market across various analytical categories will provide deeper insights into specific growth areas and competitive strategies within the Pakistani agrochemical industry.
Agro Chemicals in Pakistan Industry Company Market Share
Unlock comprehensive insights into Pakistan's burgeoning agrochemicals sector. This in-depth report provides a detailed analysis of market dynamics, growth trends, regional dominance, product landscape, key drivers, challenges, emerging opportunities, and competitive strategies within the agro chemicals Pakistan market. Covering the period from 2019 to 2033, with a base and estimated year of 2025, this report offers a crucial roadmap for stakeholders, investors, and industry professionals seeking to capitalize on the immense potential of Pakistan agrochemicals. We meticulously examine both parent market and child market segments, delivering actionable intelligence in million units for production, consumption, imports, exports, and price trends.
Agro Chemicals in Pakistan Industry Market Dynamics & Structure
The agro chemicals market Pakistan is characterized by a dynamic interplay of factors shaping its structure and growth trajectory. Market concentration is moderate, with a few dominant international players and a growing number of local manufacturers vying for market share. Technological innovation is a key driver, with increasing adoption of advanced formulations, biopesticides, and precision agriculture solutions. Regulatory frameworks, while evolving, play a crucial role in ensuring product safety and environmental sustainability. Competitive product substitutes, such as organic farming practices and integrated pest management, are gaining traction, necessitating continuous innovation from chemical providers. End-user demographics, primarily consisting of smallholder farmers and large agricultural enterprises, influence product demand and adoption rates. Mergers and acquisitions (M&A) trends, though currently nascent, indicate a potential consolidation in the future as companies seek to expand their product portfolios and geographical reach.
- Market Concentration: Moderate, with a mix of multinational corporations and local entities.
- Technological Innovation Drivers: Demand for higher yields, pest resistance, and sustainable solutions.
- Regulatory Frameworks: Evolving standards for product registration, safety, and environmental impact.
- Competitive Product Substitutes: Rise of biopesticides, organic inputs, and IPM.
- End-User Demographics: Diverse, ranging from smallholder farmers to large agribusinesses.
- M&A Trends: Emerging, with potential for future consolidation.
Agro Chemicals in Pakistan Industry Growth Trends & Insights
The Pakistan agrochemicals industry is poised for significant growth, driven by a confluence of factors including increasing food demand, government support for agriculture, and advancements in crop protection and enhancement technologies. The market size evolution is projected to witness a healthy Compound Annual Growth Rate (CAGR) throughout the forecast period. Adoption rates of modern agrochemicals are steadily increasing as farmers recognize their role in improving crop yields and quality, thereby enhancing farm profitability. Technological disruptions, such as the introduction of novel active ingredients and digital farming solutions, are reshaping consumption patterns and fostering more efficient application methods. Consumer behavior shifts are also evident, with a growing preference for products that offer both efficacy and environmental responsibility. For instance, the market penetration of biostimulants and bio-pesticides is anticipated to rise significantly.
Dominant Regions, Countries, or Segments in Agro Chemicals in Pakistan Industry
The agro chemicals in Pakistan market's dominance is multifaceted, with distinct leaders emerging across various analytical segments. In Production Analysis, Punjab province typically leads due to its vast agricultural land and established manufacturing infrastructure for fertilizers and pesticides. Consumption Analysis also heavily favors Punjab, followed by Sindh, owing to their extensive cultivation of major crops like cotton, wheat, and rice, which require substantial agrochemical inputs. The Import Market Analysis (Value & Volume) is significantly driven by the demand for specialized pesticides, herbicides, and high-efficacy fertilizers. Major importing regions are those with intensive agricultural practices and limited domestic manufacturing capabilities for certain advanced chemicals. Conversely, the Export Market Analysis (Value & Volume) is currently less prominent but holds potential for growth in specific niche products or semi-finished goods. The Price Trend Analysis is largely influenced by global commodity prices, currency fluctuations, and domestic supply-demand dynamics, with key drivers including raw material costs and government subsidies.
- Production Dominance: Punjab province, owing to its agricultural significance and manufacturing base.
- Consumption Dominance: Punjab and Sindh provinces, driven by extensive cultivation of key crops.
- Import Drivers: Need for specialized pesticides, herbicides, and advanced fertilizers.
- Export Potential: Niche products and semi-finished goods, with room for expansion.
- Price Trend Influences: Global commodity prices, currency exchange rates, and government policies.
Agro Chemicals in Pakistan Industry Product Landscape
The product landscape within the agro chemicals Pakistan sector is characterized by a continuous influx of innovative solutions aimed at enhancing crop productivity and protection. Key product categories include insecticides, herbicides, fungicides, and fertilizers, alongside a growing segment of biopesticides and plant growth regulators. Recent product innovations focus on formulations offering enhanced efficacy, targeted action, and reduced environmental impact. For instance, new-generation insecticides are designed to combat resistant pest populations while minimizing harm to beneficial insects. The performance metrics of these products are evaluated based on their effectiveness in controlling pests and diseases, improving yield, and enhancing crop quality. Unique selling propositions often revolve around novel modes of action, longer residual activity, and improved application characteristics.
Key Drivers, Barriers & Challenges in Agro Chemicals in Pakistan Industry
Key Drivers:
The agro chemicals industry Pakistan is propelled by several key drivers, including the nation's ever-growing population demanding increased food production, supportive government policies aimed at boosting agricultural output, and the increasing adoption of modern farming techniques by progressive farmers. Technological advancements in crop protection and nutrient management are also significant catalysts for growth.
Barriers & Challenges:
However, the sector faces considerable barriers and challenges. Fluctuations in global raw material prices and currency depreciation can significantly impact import costs and domestic pricing. Stringent regulatory approval processes and the need for extensive field trials for new products can lead to delays. Furthermore, counterfeit agrochemical products pose a substantial threat to genuine manufacturers and farmer trust. Environmental concerns and the increasing demand for sustainable farming practices necessitate a shift towards greener alternatives, requiring R&D investment.
Emerging Opportunities in Agro Chemicals in Pakistan Industry
Emerging opportunities in the Pakistan agrochemicals market lie in the growing demand for biological and bio-stimulant products, catering to the increasing consumer and regulatory push for sustainable agriculture. The untapped potential in specific niche crop segments and regions within Pakistan presents avenues for targeted product development and market penetration. Furthermore, the adoption of digital agriculture platforms and precision farming technologies opens up opportunities for integrated agrochemical solutions and services.
Growth Accelerators in the Agro Chemicals in Pakistan Industry Industry
Long-term growth in the agro chemicals Pakistan industry will be significantly accelerated by continued technological breakthroughs in the development of novel, effective, and environmentally benign crop protection agents. Strategic partnerships between international and local players can foster knowledge transfer and market expansion. Furthermore, the government's commitment to modernizing the agricultural sector through infrastructure development and farmer education initiatives will act as a crucial market expansion strategy, driving wider adoption of advanced agrochemical solutions.
Key Players Shaping the Agro Chemicals in Pakistan Industry Market
- Welcon Chemicals Pvt Lt
- Evyol Group
- Ali Akbar Group
- Syngenta
- ICI Pakistan Pvt Ltd
- BASF SE
- FMC Corporation
- Pakistan Agro Chemicals Pvt Ltd
- Bayer Ag
Notable Milestones in Agro Chemicals in Pakistan Industry Sector
- February 2023: Bayer partnered with Kimitec to bring the next generation of biologicals to millions of growers worldwide, including crop protection and biostimulant products derived from natural sources.
- February 2021: Engro Fertilizers and BASF SE entered a strategic partnership to launch Sefina insecticide by BASF in Pakistan, offering a novel mode of action for controlling key piercing and sucking insect pests in cotton and vegetable crops.
- January 2021: 'HANARO,' the brand of Bistrifluron 10% EC from FarmHannong, was launched in Pakistan to manage whitefly, a major problematic insect in cotton cultivation, supplied by Ayan Crop Science.
In-Depth Agro Chemicals in Pakistan Industry Market Outlook
The agro chemicals in Pakistan industry is on an upward trajectory, fueled by a growing agricultural base and increasing adoption of innovative solutions. The outlook indicates sustained growth, driven by investments in R&D for more sustainable and effective crop protection products and the expansion of biopesticide and biostimulant segments. Strategic collaborations and government support for agricultural modernization will further enhance market penetration. The industry is well-positioned to meet the evolving needs of Pakistani agriculture, presenting significant future market potential and attractive strategic opportunities for stakeholders.
Agro Chemicals in Pakistan Industry Segmentation
- 1. Production Analysis
- 2. Consumption Analysis
- 3. Import Market Analysis (Value & Volume)
- 4. Export Market Analysis (Value & Volume)
- 5. Price Trend Analysis
Agro Chemicals in Pakistan Industry Segmentation By Geography
-
1. North America
- 1.1. United States
- 1.2. Canada
- 1.3. Mexico
-
2. South America
- 2.1. Brazil
- 2.2. Argentina
- 2.3. Rest of South America
-
3. Europe
- 3.1. United Kingdom
- 3.2. Germany
- 3.3. France
- 3.4. Italy
- 3.5. Spain
- 3.6. Russia
- 3.7. Benelux
- 3.8. Nordics
- 3.9. Rest of Europe
-
4. Middle East & Africa
- 4.1. Turkey
- 4.2. Israel
- 4.3. GCC
- 4.4. North Africa
- 4.5. South Africa
- 4.6. Rest of Middle East & Africa
-
5. Asia Pacific
- 5.1. China
- 5.2. India
- 5.3. Japan
- 5.4. South Korea
- 5.5. ASEAN
- 5.6. Oceania
- 5.7. Rest of Asia Pacific
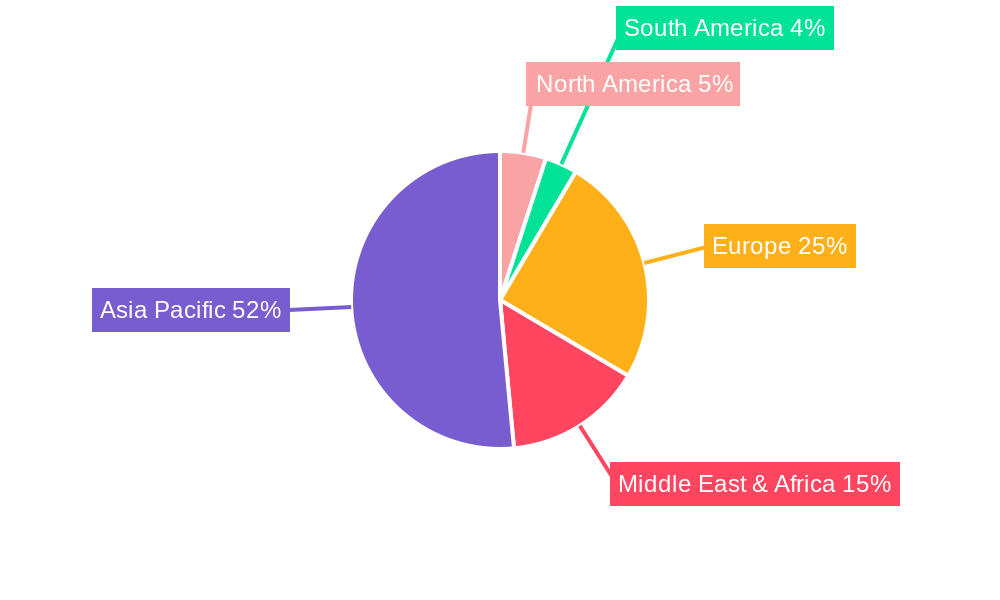
Agro Chemicals in Pakistan Industry Regional Market Share
Geographic Coverage of Agro Chemicals in Pakistan Industry
Agro Chemicals in Pakistan Industry REPORT HIGHLIGHTS
| Aspects | Details |
|---|---|
| Study Period | 2020-2034 |
| Base Year | 2025 |
| Estimated Year | 2026 |
| Forecast Period | 2026-2034 |
| Historical Period | 2020-2025 |
| Growth Rate | CAGR of 7.99% from 2020-2034 |
| Segmentation |
|
Table of Contents
- 1. Introduction
- 1.1. Research Scope
- 1.2. Market Segmentation
- 1.3. Research Objective
- 1.4. Definitions and Assumptions
- 2. Executive Summary
- 2.1. Market Snapshot
- 3. Market Dynamics
- 3.1. Market Drivers
- 3.2. Market Restrains
- 3.3. Market Trends
- 3.4. Market Opportunities
- 4. Market Factor Analysis
- 4.1. Porters Five Forces
- 4.1.1. Bargaining Power of Suppliers
- 4.1.2. Bargaining Power of Buyers
- 4.1.3. Threat of New Entrants
- 4.1.4. Threat of Substitutes
- 4.1.5. Competitive Rivalry
- 4.2. PESTEL analysis
- 4.3. BCG Analysis
- 4.3.1. Stars (High Growth, High Market Share)
- 4.3.2. Cash Cows (Low Growth, High Market Share)
- 4.3.3. Question Mark (High Growth, Low Market Share)
- 4.3.4. Dogs (Low Growth, Low Market Share)
- 4.4. Ansoff Matrix Analysis
- 4.5. Supply Chain Analysis
- 4.6. Regulatory Landscape
- 4.7. Current Market Potential and Opportunity Assessment (TAM–SAM–SOM Framework)
- 4.8. VDR Analyst Note
- 4.1. Porters Five Forces
- 5. Market Analysis, Insights and Forecast 2021-2033
- 5.1. Market Analysis, Insights and Forecast - by Production Analysis
- 5.2. Market Analysis, Insights and Forecast - by Consumption Analysis
- 5.3. Market Analysis, Insights and Forecast - by Import Market Analysis (Value & Volume)
- 5.4. Market Analysis, Insights and Forecast - by Export Market Analysis (Value & Volume)
- 5.5. Market Analysis, Insights and Forecast - by Price Trend Analysis
- 5.6. Market Analysis, Insights and Forecast - by Region
- 5.6.1. North America
- 5.6.2. South America
- 5.6.3. Europe
- 5.6.4. Middle East & Africa
- 5.6.5. Asia Pacific
- 6. Global Agro Chemicals in Pakistan Industry Analysis, Insights and Forecast, 2021-2033
- 6.1. Market Analysis, Insights and Forecast - by Production Analysis
- 6.2. Market Analysis, Insights and Forecast - by Consumption Analysis
- 6.3. Market Analysis, Insights and Forecast - by Import Market Analysis (Value & Volume)
- 6.4. Market Analysis, Insights and Forecast - by Export Market Analysis (Value & Volume)
- 6.5. Market Analysis, Insights and Forecast - by Price Trend Analysis
- 7. North America Agro Chemicals in Pakistan Industry Analysis, Insights and Forecast, 2021-2033
- 7.1. Market Analysis, Insights and Forecast - by Production Analysis
- 7.2. Market Analysis, Insights and Forecast - by Consumption Analysis
- 7.3. Market Analysis, Insights and Forecast - by Import Market Analysis (Value & Volume)
- 7.4. Market Analysis, Insights and Forecast - by Export Market Analysis (Value & Volume)
- 7.5. Market Analysis, Insights and Forecast - by Price Trend Analysis
- 8. South America Agro Chemicals in Pakistan Industry Analysis, Insights and Forecast, 2021-2033
- 8.1. Market Analysis, Insights and Forecast - by Production Analysis
- 8.2. Market Analysis, Insights and Forecast - by Consumption Analysis
- 8.3. Market Analysis, Insights and Forecast - by Import Market Analysis (Value & Volume)
- 8.4. Market Analysis, Insights and Forecast - by Export Market Analysis (Value & Volume)
- 8.5. Market Analysis, Insights and Forecast - by Price Trend Analysis
- 9. Europe Agro Chemicals in Pakistan Industry Analysis, Insights and Forecast, 2021-2033
- 9.1. Market Analysis, Insights and Forecast - by Production Analysis
- 9.2. Market Analysis, Insights and Forecast - by Consumption Analysis
- 9.3. Market Analysis, Insights and Forecast - by Import Market Analysis (Value & Volume)
- 9.4. Market Analysis, Insights and Forecast - by Export Market Analysis (Value & Volume)
- 9.5. Market Analysis, Insights and Forecast - by Price Trend Analysis
- 10. Middle East & Africa Agro Chemicals in Pakistan Industry Analysis, Insights and Forecast, 2021-2033
- 10.1. Market Analysis, Insights and Forecast - by Production Analysis
- 10.2. Market Analysis, Insights and Forecast - by Consumption Analysis
- 10.3. Market Analysis, Insights and Forecast - by Import Market Analysis (Value & Volume)
- 10.4. Market Analysis, Insights and Forecast - by Export Market Analysis (Value & Volume)
- 10.5. Market Analysis, Insights and Forecast - by Price Trend Analysis
- 11. Asia Pacific Agro Chemicals in Pakistan Industry Analysis, Insights and Forecast, 2021-2033
- 11.1. Market Analysis, Insights and Forecast - by Production Analysis
- 11.2. Market Analysis, Insights and Forecast - by Consumption Analysis
- 11.3. Market Analysis, Insights and Forecast - by Import Market Analysis (Value & Volume)
- 11.4. Market Analysis, Insights and Forecast - by Export Market Analysis (Value & Volume)
- 11.5. Market Analysis, Insights and Forecast - by Price Trend Analysis
- 12. Competitive Analysis
- 12.1. Company Profiles
- 12.1.1 Welcon Chemicals Pvt Lt
- 12.1.1.1. Company Overview
- 12.1.1.2. Products
- 12.1.1.3. Company Financials
- 12.1.1.4. SWOT Analysis
- 12.1.2 Evyol Group
- 12.1.2.1. Company Overview
- 12.1.2.2. Products
- 12.1.2.3. Company Financials
- 12.1.2.4. SWOT Analysis
- 12.1.3 Ali Akbar Group
- 12.1.3.1. Company Overview
- 12.1.3.2. Products
- 12.1.3.3. Company Financials
- 12.1.3.4. SWOT Analysis
- 12.1.4 Syngenta
- 12.1.4.1. Company Overview
- 12.1.4.2. Products
- 12.1.4.3. Company Financials
- 12.1.4.4. SWOT Analysis
- 12.1.5 ICI Pakistan Pvt Ltd
- 12.1.5.1. Company Overview
- 12.1.5.2. Products
- 12.1.5.3. Company Financials
- 12.1.5.4. SWOT Analysis
- 12.1.6 BASF SE
- 12.1.6.1. Company Overview
- 12.1.6.2. Products
- 12.1.6.3. Company Financials
- 12.1.6.4. SWOT Analysis
- 12.1.7 FMC Corporation
- 12.1.7.1. Company Overview
- 12.1.7.2. Products
- 12.1.7.3. Company Financials
- 12.1.7.4. SWOT Analysis
- 12.1.8 Pakistan Agro Chemicals Pvt Ltd
- 12.1.8.1. Company Overview
- 12.1.8.2. Products
- 12.1.8.3. Company Financials
- 12.1.8.4. SWOT Analysis
- 12.1.9 Bayer Ag
- 12.1.9.1. Company Overview
- 12.1.9.2. Products
- 12.1.9.3. Company Financials
- 12.1.9.4. SWOT Analysis
- 12.1.1 Welcon Chemicals Pvt Lt
- 12.2. Market Entropy
- 12.2.1 Company's Key Areas Served
- 12.2.2 Recent Developments
- 12.3. Company Market Share Analysis 2025
- 12.3.1 Top 5 Companies Market Share Analysis
- 12.3.2 Top 3 Companies Market Share Analysis
- 12.4. List of Potential Customers
- 13. Research Methodology
List of Figures
- Figure 1: Global Agro Chemicals in Pakistan Industry Revenue Breakdown (Million, %) by Region 2025 & 2033
- Figure 2: North America Agro Chemicals in Pakistan Industry Revenue (Million), by Production Analysis 2025 & 2033
- Figure 3: North America Agro Chemicals in Pakistan Industry Revenue Share (%), by Production Analysis 2025 & 2033
- Figure 4: North America Agro Chemicals in Pakistan Industry Revenue (Million), by Consumption Analysis 2025 & 2033
- Figure 5: North America Agro Chemicals in Pakistan Industry Revenue Share (%), by Consumption Analysis 2025 & 2033
- Figure 6: North America Agro Chemicals in Pakistan Industry Revenue (Million), by Import Market Analysis (Value & Volume) 2025 & 2033
- Figure 7: North America Agro Chemicals in Pakistan Industry Revenue Share (%), by Import Market Analysis (Value & Volume) 2025 & 2033
- Figure 8: North America Agro Chemicals in Pakistan Industry Revenue (Million), by Export Market Analysis (Value & Volume) 2025 & 2033
- Figure 9: North America Agro Chemicals in Pakistan Industry Revenue Share (%), by Export Market Analysis (Value & Volume) 2025 & 2033
- Figure 10: North America Agro Chemicals in Pakistan Industry Revenue (Million), by Price Trend Analysis 2025 & 2033
- Figure 11: North America Agro Chemicals in Pakistan Industry Revenue Share (%), by Price Trend Analysis 2025 & 2033
- Figure 12: North America Agro Chemicals in Pakistan Industry Revenue (Million), by Country 2025 & 2033
- Figure 13: North America Agro Chemicals in Pakistan Industry Revenue Share (%), by Country 2025 & 2033
- Figure 14: South America Agro Chemicals in Pakistan Industry Revenue (Million), by Production Analysis 2025 & 2033
- Figure 15: South America Agro Chemicals in Pakistan Industry Revenue Share (%), by Production Analysis 2025 & 2033
- Figure 16: South America Agro Chemicals in Pakistan Industry Revenue (Million), by Consumption Analysis 2025 & 2033
- Figure 17: South America Agro Chemicals in Pakistan Industry Revenue Share (%), by Consumption Analysis 2025 & 2033
- Figure 18: South America Agro Chemicals in Pakistan Industry Revenue (Million), by Import Market Analysis (Value & Volume) 2025 & 2033
- Figure 19: South America Agro Chemicals in Pakistan Industry Revenue Share (%), by Import Market Analysis (Value & Volume) 2025 & 2033
- Figure 20: South America Agro Chemicals in Pakistan Industry Revenue (Million), by Export Market Analysis (Value & Volume) 2025 & 2033
- Figure 21: South America Agro Chemicals in Pakistan Industry Revenue Share (%), by Export Market Analysis (Value & Volume) 2025 & 2033
- Figure 22: South America Agro Chemicals in Pakistan Industry Revenue (Million), by Price Trend Analysis 2025 & 2033
- Figure 23: South America Agro Chemicals in Pakistan Industry Revenue Share (%), by Price Trend Analysis 2025 & 2033
- Figure 24: South America Agro Chemicals in Pakistan Industry Revenue (Million), by Country 2025 & 2033
- Figure 25: South America Agro Chemicals in Pakistan Industry Revenue Share (%), by Country 2025 & 2033
- Figure 26: Europe Agro Chemicals in Pakistan Industry Revenue (Million), by Production Analysis 2025 & 2033
- Figure 27: Europe Agro Chemicals in Pakistan Industry Revenue Share (%), by Production Analysis 2025 & 2033
- Figure 28: Europe Agro Chemicals in Pakistan Industry Revenue (Million), by Consumption Analysis 2025 & 2033
- Figure 29: Europe Agro Chemicals in Pakistan Industry Revenue Share (%), by Consumption Analysis 2025 & 2033
- Figure 30: Europe Agro Chemicals in Pakistan Industry Revenue (Million), by Import Market Analysis (Value & Volume) 2025 & 2033
- Figure 31: Europe Agro Chemicals in Pakistan Industry Revenue Share (%), by Import Market Analysis (Value & Volume) 2025 & 2033
- Figure 32: Europe Agro Chemicals in Pakistan Industry Revenue (Million), by Export Market Analysis (Value & Volume) 2025 & 2033
- Figure 33: Europe Agro Chemicals in Pakistan Industry Revenue Share (%), by Export Market Analysis (Value & Volume) 2025 & 2033
- Figure 34: Europe Agro Chemicals in Pakistan Industry Revenue (Million), by Price Trend Analysis 2025 & 2033
- Figure 35: Europe Agro Chemicals in Pakistan Industry Revenue Share (%), by Price Trend Analysis 2025 & 2033
- Figure 36: Europe Agro Chemicals in Pakistan Industry Revenue (Million), by Country 2025 & 2033
- Figure 37: Europe Agro Chemicals in Pakistan Industry Revenue Share (%), by Country 2025 & 2033
- Figure 38: Middle East & Africa Agro Chemicals in Pakistan Industry Revenue (Million), by Production Analysis 2025 & 2033
- Figure 39: Middle East & Africa Agro Chemicals in Pakistan Industry Revenue Share (%), by Production Analysis 2025 & 2033
- Figure 40: Middle East & Africa Agro Chemicals in Pakistan Industry Revenue (Million), by Consumption Analysis 2025 & 2033
- Figure 41: Middle East & Africa Agro Chemicals in Pakistan Industry Revenue Share (%), by Consumption Analysis 2025 & 2033
- Figure 42: Middle East & Africa Agro Chemicals in Pakistan Industry Revenue (Million), by Import Market Analysis (Value & Volume) 2025 & 2033
- Figure 43: Middle East & Africa Agro Chemicals in Pakistan Industry Revenue Share (%), by Import Market Analysis (Value & Volume) 2025 & 2033
- Figure 44: Middle East & Africa Agro Chemicals in Pakistan Industry Revenue (Million), by Export Market Analysis (Value & Volume) 2025 & 2033
- Figure 45: Middle East & Africa Agro Chemicals in Pakistan Industry Revenue Share (%), by Export Market Analysis (Value & Volume) 2025 & 2033
- Figure 46: Middle East & Africa Agro Chemicals in Pakistan Industry Revenue (Million), by Price Trend Analysis 2025 & 2033
- Figure 47: Middle East & Africa Agro Chemicals in Pakistan Industry Revenue Share (%), by Price Trend Analysis 2025 & 2033
- Figure 48: Middle East & Africa Agro Chemicals in Pakistan Industry Revenue (Million), by Country 2025 & 2033
- Figure 49: Middle East & Africa Agro Chemicals in Pakistan Industry Revenue Share (%), by Country 2025 & 2033
- Figure 50: Asia Pacific Agro Chemicals in Pakistan Industry Revenue (Million), by Production Analysis 2025 & 2033
- Figure 51: Asia Pacific Agro Chemicals in Pakistan Industry Revenue Share (%), by Production Analysis 2025 & 2033
- Figure 52: Asia Pacific Agro Chemicals in Pakistan Industry Revenue (Million), by Consumption Analysis 2025 & 2033
- Figure 53: Asia Pacific Agro Chemicals in Pakistan Industry Revenue Share (%), by Consumption Analysis 2025 & 2033
- Figure 54: Asia Pacific Agro Chemicals in Pakistan Industry Revenue (Million), by Import Market Analysis (Value & Volume) 2025 & 2033
- Figure 55: Asia Pacific Agro Chemicals in Pakistan Industry Revenue Share (%), by Import Market Analysis (Value & Volume) 2025 & 2033
- Figure 56: Asia Pacific Agro Chemicals in Pakistan Industry Revenue (Million), by Export Market Analysis (Value & Volume) 2025 & 2033
- Figure 57: Asia Pacific Agro Chemicals in Pakistan Industry Revenue Share (%), by Export Market Analysis (Value & Volume) 2025 & 2033
- Figure 58: Asia Pacific Agro Chemicals in Pakistan Industry Revenue (Million), by Price Trend Analysis 2025 & 2033
- Figure 59: Asia Pacific Agro Chemicals in Pakistan Industry Revenue Share (%), by Price Trend Analysis 2025 & 2033
- Figure 60: Asia Pacific Agro Chemicals in Pakistan Industry Revenue (Million), by Country 2025 & 2033
- Figure 61: Asia Pacific Agro Chemicals in Pakistan Industry Revenue Share (%), by Country 2025 & 2033
List of Tables
- Table 1: Global Agro Chemicals in Pakistan Industry Revenue Million Forecast, by Production Analysis 2020 & 2033
- Table 2: Global Agro Chemicals in Pakistan Industry Revenue Million Forecast, by Consumption Analysis 2020 & 2033
- Table 3: Global Agro Chemicals in Pakistan Industry Revenue Million Forecast, by Import Market Analysis (Value & Volume) 2020 & 2033
- Table 4: Global Agro Chemicals in Pakistan Industry Revenue Million Forecast, by Export Market Analysis (Value & Volume) 2020 & 2033
- Table 5: Global Agro Chemicals in Pakistan Industry Revenue Million Forecast, by Price Trend Analysis 2020 & 2033
- Table 6: Global Agro Chemicals in Pakistan Industry Revenue Million Forecast, by Region 2020 & 2033
- Table 7: Global Agro Chemicals in Pakistan Industry Revenue Million Forecast, by Production Analysis 2020 & 2033
- Table 8: Global Agro Chemicals in Pakistan Industry Revenue Million Forecast, by Consumption Analysis 2020 & 2033
- Table 9: Global Agro Chemicals in Pakistan Industry Revenue Million Forecast, by Import Market Analysis (Value & Volume) 2020 & 2033
- Table 10: Global Agro Chemicals in Pakistan Industry Revenue Million Forecast, by Export Market Analysis (Value & Volume) 2020 & 2033
- Table 11: Global Agro Chemicals in Pakistan Industry Revenue Million Forecast, by Price Trend Analysis 2020 & 2033
- Table 12: Global Agro Chemicals in Pakistan Industry Revenue Million Forecast, by Country 2020 & 2033
- Table 13: United States Agro Chemicals in Pakistan Industry Revenue (Million) Forecast, by Application 2020 & 2033
- Table 14: Canada Agro Chemicals in Pakistan Industry Revenue (Million) Forecast, by Application 2020 & 2033
- Table 15: Mexico Agro Chemicals in Pakistan Industry Revenue (Million) Forecast, by Application 2020 & 2033
- Table 16: Global Agro Chemicals in Pakistan Industry Revenue Million Forecast, by Production Analysis 2020 & 2033
- Table 17: Global Agro Chemicals in Pakistan Industry Revenue Million Forecast, by Consumption Analysis 2020 & 2033
- Table 18: Global Agro Chemicals in Pakistan Industry Revenue Million Forecast, by Import Market Analysis (Value & Volume) 2020 & 2033
- Table 19: Global Agro Chemicals in Pakistan Industry Revenue Million Forecast, by Export Market Analysis (Value & Volume) 2020 & 2033
- Table 20: Global Agro Chemicals in Pakistan Industry Revenue Million Forecast, by Price Trend Analysis 2020 & 2033
- Table 21: Global Agro Chemicals in Pakistan Industry Revenue Million Forecast, by Country 2020 & 2033
- Table 22: Brazil Agro Chemicals in Pakistan Industry Revenue (Million) Forecast, by Application 2020 & 2033
- Table 23: Argentina Agro Chemicals in Pakistan Industry Revenue (Million) Forecast, by Application 2020 & 2033
- Table 24: Rest of South America Agro Chemicals in Pakistan Industry Revenue (Million) Forecast, by Application 2020 & 2033
- Table 25: Global Agro Chemicals in Pakistan Industry Revenue Million Forecast, by Production Analysis 2020 & 2033
- Table 26: Global Agro Chemicals in Pakistan Industry Revenue Million Forecast, by Consumption Analysis 2020 & 2033
- Table 27: Global Agro Chemicals in Pakistan Industry Revenue Million Forecast, by Import Market Analysis (Value & Volume) 2020 & 2033
- Table 28: Global Agro Chemicals in Pakistan Industry Revenue Million Forecast, by Export Market Analysis (Value & Volume) 2020 & 2033
- Table 29: Global Agro Chemicals in Pakistan Industry Revenue Million Forecast, by Price Trend Analysis 2020 & 2033
- Table 30: Global Agro Chemicals in Pakistan Industry Revenue Million Forecast, by Country 2020 & 2033
- Table 31: United Kingdom Agro Chemicals in Pakistan Industry Revenue (Million) Forecast, by Application 2020 & 2033
- Table 32: Germany Agro Chemicals in Pakistan Industry Revenue (Million) Forecast, by Application 2020 & 2033
- Table 33: France Agro Chemicals in Pakistan Industry Revenue (Million) Forecast, by Application 2020 & 2033
- Table 34: Italy Agro Chemicals in Pakistan Industry Revenue (Million) Forecast, by Application 2020 & 2033
- Table 35: Spain Agro Chemicals in Pakistan Industry Revenue (Million) Forecast, by Application 2020 & 2033
- Table 36: Russia Agro Chemicals in Pakistan Industry Revenue (Million) Forecast, by Application 2020 & 2033
- Table 37: Benelux Agro Chemicals in Pakistan Industry Revenue (Million) Forecast, by Application 2020 & 2033
- Table 38: Nordics Agro Chemicals in Pakistan Industry Revenue (Million) Forecast, by Application 2020 & 2033
- Table 39: Rest of Europe Agro Chemicals in Pakistan Industry Revenue (Million) Forecast, by Application 2020 & 2033
- Table 40: Global Agro Chemicals in Pakistan Industry Revenue Million Forecast, by Production Analysis 2020 & 2033
- Table 41: Global Agro Chemicals in Pakistan Industry Revenue Million Forecast, by Consumption Analysis 2020 & 2033
- Table 42: Global Agro Chemicals in Pakistan Industry Revenue Million Forecast, by Import Market Analysis (Value & Volume) 2020 & 2033
- Table 43: Global Agro Chemicals in Pakistan Industry Revenue Million Forecast, by Export Market Analysis (Value & Volume) 2020 & 2033
- Table 44: Global Agro Chemicals in Pakistan Industry Revenue Million Forecast, by Price Trend Analysis 2020 & 2033
- Table 45: Global Agro Chemicals in Pakistan Industry Revenue Million Forecast, by Country 2020 & 2033
- Table 46: Turkey Agro Chemicals in Pakistan Industry Revenue (Million) Forecast, by Application 2020 & 2033
- Table 47: Israel Agro Chemicals in Pakistan Industry Revenue (Million) Forecast, by Application 2020 & 2033
- Table 48: GCC Agro Chemicals in Pakistan Industry Revenue (Million) Forecast, by Application 2020 & 2033
- Table 49: North Africa Agro Chemicals in Pakistan Industry Revenue (Million) Forecast, by Application 2020 & 2033
- Table 50: South Africa Agro Chemicals in Pakistan Industry Revenue (Million) Forecast, by Application 2020 & 2033
- Table 51: Rest of Middle East & Africa Agro Chemicals in Pakistan Industry Revenue (Million) Forecast, by Application 2020 & 2033
- Table 52: Global Agro Chemicals in Pakistan Industry Revenue Million Forecast, by Production Analysis 2020 & 2033
- Table 53: Global Agro Chemicals in Pakistan Industry Revenue Million Forecast, by Consumption Analysis 2020 & 2033
- Table 54: Global Agro Chemicals in Pakistan Industry Revenue Million Forecast, by Import Market Analysis (Value & Volume) 2020 & 2033
- Table 55: Global Agro Chemicals in Pakistan Industry Revenue Million Forecast, by Export Market Analysis (Value & Volume) 2020 & 2033
- Table 56: Global Agro Chemicals in Pakistan Industry Revenue Million Forecast, by Price Trend Analysis 2020 & 2033
- Table 57: Global Agro Chemicals in Pakistan Industry Revenue Million Forecast, by Country 2020 & 2033
- Table 58: China Agro Chemicals in Pakistan Industry Revenue (Million) Forecast, by Application 2020 & 2033
- Table 59: India Agro Chemicals in Pakistan Industry Revenue (Million) Forecast, by Application 2020 & 2033
- Table 60: Japan Agro Chemicals in Pakistan Industry Revenue (Million) Forecast, by Application 2020 & 2033
- Table 61: South Korea Agro Chemicals in Pakistan Industry Revenue (Million) Forecast, by Application 2020 & 2033
- Table 62: ASEAN Agro Chemicals in Pakistan Industry Revenue (Million) Forecast, by Application 2020 & 2033
- Table 63: Oceania Agro Chemicals in Pakistan Industry Revenue (Million) Forecast, by Application 2020 & 2033
- Table 64: Rest of Asia Pacific Agro Chemicals in Pakistan Industry Revenue (Million) Forecast, by Application 2020 & 2033
Frequently Asked Questions
1. What is the projected Compound Annual Growth Rate (CAGR) of the Agro Chemicals in Pakistan Industry?
The projected CAGR is approximately 7.99%.
2. Which companies are prominent players in the Agro Chemicals in Pakistan Industry?
Key companies in the market include Welcon Chemicals Pvt Lt, Evyol Group, Ali Akbar Group, Syngenta, ICI Pakistan Pvt Ltd, BASF SE, FMC Corporation, Pakistan Agro Chemicals Pvt Ltd, Bayer Ag.
3. What are the main segments of the Agro Chemicals in Pakistan Industry?
The market segments include Production Analysis, Consumption Analysis, Import Market Analysis (Value & Volume), Export Market Analysis (Value & Volume), Price Trend Analysis.
4. Can you provide details about the market size?
The market size is estimated to be USD 345.59 Million as of 2022.
5. What are some drivers contributing to market growth?
Increasing Berry Consumption for Health Benefits; Increasing Adoption of High-Technology Farm Practices; Growing Usage of Berries in the Food and Beverage Industries.
6. What are the notable trends driving market growth?
Need for Increased Land Productivity.
7. Are there any restraints impacting market growth?
High Production Cost Involved in Berry Production; Increasing Disease and Pest Infestations.
8. Can you provide examples of recent developments in the market?
February 2023: Bayer partnered with Kimitec to bring the next generation of biologicals to millions of growers worldwide. This includes crop protection and biostimulant products based on molecules derived from natural sources.
9. What pricing options are available for accessing the report?
Pricing options include single-user, multi-user, and enterprise licenses priced at USD 3800, USD 4500, and USD 5800 respectively.
10. Is the market size provided in terms of value or volume?
The market size is provided in terms of value, measured in Million.
11. Are there any specific market keywords associated with the report?
Yes, the market keyword associated with the report is "Agro Chemicals in Pakistan Industry," which aids in identifying and referencing the specific market segment covered.
12. How do I determine which pricing option suits my needs best?
The pricing options vary based on user requirements and access needs. Individual users may opt for single-user licenses, while businesses requiring broader access may choose multi-user or enterprise licenses for cost-effective access to the report.
13. Are there any additional resources or data provided in the Agro Chemicals in Pakistan Industry report?
While the report offers comprehensive insights, it's advisable to review the specific contents or supplementary materials provided to ascertain if additional resources or data are available.
14. How can I stay updated on further developments or reports in the Agro Chemicals in Pakistan Industry?
To stay informed about further developments, trends, and reports in the Agro Chemicals in Pakistan Industry, consider subscribing to industry newsletters, following relevant companies and organizations, or regularly checking reputable industry news sources and publications.
Methodology
Step 1 - Identification of Relevant Samples Size from Population Database


Step 2 - Approaches for Defining Global Market Size (Value, Volume* & Price*)

Note*: In applicable scenarios
Step 3 - Data Sources
Primary Research
- Web Analytics
- Survey Reports
- Research Institute
- Latest Research Reports
- Opinion Leaders
Secondary Research
- Annual Reports
- White Paper
- Latest Press Release
- Industry Association
- Paid Database
- Investor Presentations

Step 4 - Data Triangulation
Involves using different sources of information in order to increase the validity of a study
These sources are likely to be stakeholders in a program - participants, other researchers, program staff, other community members, and so on.
Then we put all data in single framework & apply various statistical tools to find out the dynamic on the market.
During the analysis stage, feedback from the stakeholder groups would be compared to determine areas of agreement as well as areas of divergence