

Key Insights
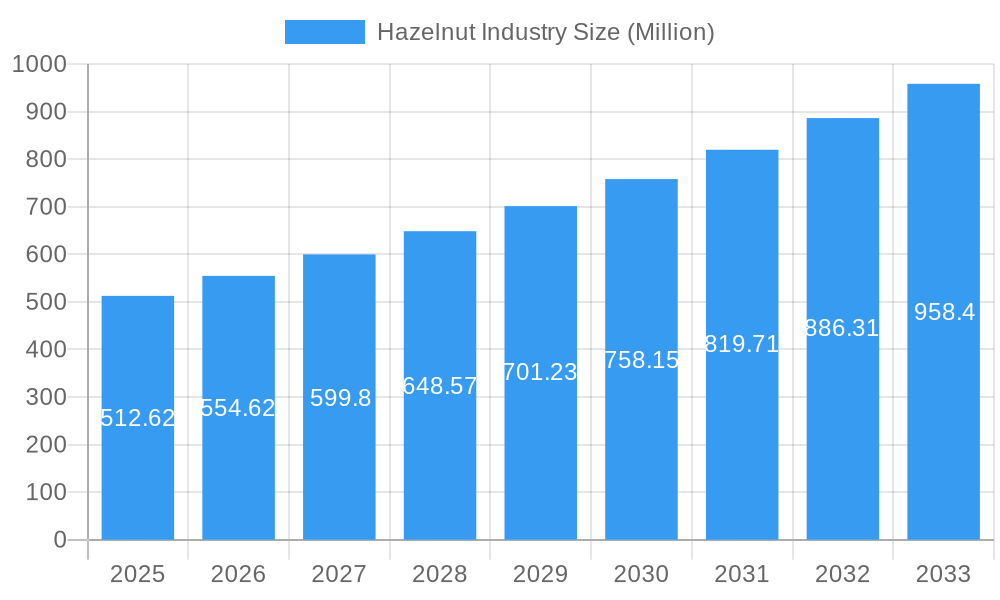
The global hazelnut market is poised for robust growth, projected to reach a significant valuation of $512.62 million by 2025, with an anticipated Compound Annual Growth Rate (CAGR) of 8.10% extending through 2033. This upward trajectory is primarily fueled by a confluence of escalating consumer demand for healthy and natural food ingredients, coupled with the expanding application of hazelnuts across diverse sectors including confectionery, bakery, dairy, and even nascent segments like plant-based milk alternatives and gourmet culinary uses. The increasing popularity of artisanal food products and the growing awareness of the nutritional benefits of hazelnuts, such as their rich content of healthy fats, vitamins, and minerals, are significant market drivers. Furthermore, advancements in cultivation techniques and the development of more resilient hazelnut varieties are contributing to stable supply chains, essential for meeting this surging demand.
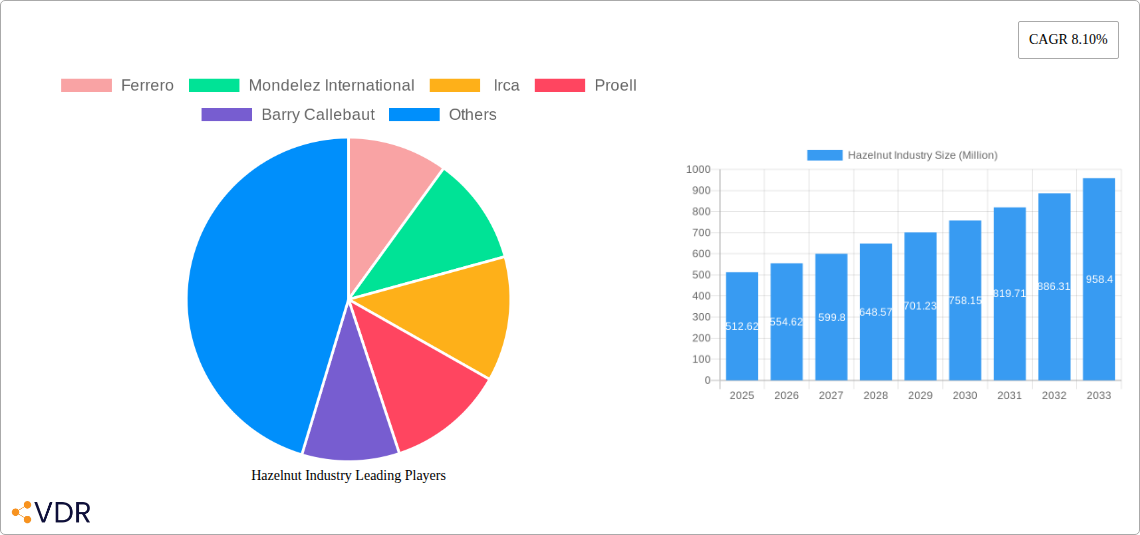
Hazelnut Industry Market Size (In Million)
Despite the optimistic outlook, the market faces certain restraints that warrant strategic consideration. Fluctuations in agricultural yields due to climatic conditions, potential pest infestations, and the inherently labor-intensive nature of hazelnut harvesting can introduce volatility into supply and pricing. Geopolitical factors impacting major producing regions and trade policies can also influence market dynamics. However, the industry is actively exploring innovative solutions to mitigate these challenges, including investments in precision agriculture, improved storage and processing technologies, and diversification of sourcing regions. Key players like Ferrero, Mondelez International, and Barry Callebaut are actively investing in R&D and supply chain optimization to capitalize on growth opportunities and navigate potential market headwinds, ensuring a steady flow of premium hazelnut products to meet global consumer preferences.
Hazelnut Industry Company Market Share
Hazelnut Industry Market Dynamics & Structure
The global hazelnut industry is characterized by a moderately concentrated market structure, with a few key players dominating a significant portion of the value chain. Technological innovation is primarily driven by advancements in cultivation techniques, such as precision agriculture and disease-resistant varietals, aimed at improving yields and reducing environmental impact. Regulatory frameworks, particularly concerning food safety standards and international trade agreements, play a crucial role in shaping market access and compliance. While direct competitive product substitutes are limited, alternatives like almonds and peanuts in certain confectionery and culinary applications pose indirect competition. End-user demographics are increasingly shifting towards health-conscious consumers and a growing demand for plant-based ingredients, influencing product development and marketing strategies. Mergers and acquisitions (M&A) are a significant trend, with larger companies acquiring smaller producers or processors to secure supply chains and expand market reach.
- Market Concentration: The top five companies collectively hold approximately 60% of the global hazelnut market share.
- Technological Innovation Drivers: Focus on sustainable farming practices, yield enhancement technologies, and automation in harvesting and processing.
- Regulatory Frameworks: Stringent quality control measures, organic certifications, and evolving import/export regulations.
- Competitive Product Substitutes: Indirect competition from almonds, peanuts, and other tree nuts in snack foods and baking.
- End-User Demographics: Growing demand from health and wellness sectors, vegan and vegetarian markets, and premium food manufacturers.
- M&A Trends: Strategic acquisitions by major food manufacturers and ingredient suppliers to control raw material sourcing.
Hazelnut Industry Growth Trends & Insights
The hazelnut industry is poised for robust growth, driven by a confluence of escalating consumer demand, evolving dietary preferences, and strategic industry advancements. The market size evolution is projected to witness a substantial expansion, with an anticipated Compound Annual Growth Rate (CAGR) of approximately 4.5% to 5.0% over the forecast period. This growth trajectory is underpinned by increasing adoption rates of hazelnuts across diverse applications, from confectionery and bakery to dairy and plant-based alternatives. Technological disruptions in cultivation, processing, and supply chain management are further bolstering efficiency and accessibility, thereby supporting market penetration. Consumer behavior shifts are a pivotal catalyst, with a discernible rise in the preference for nutrient-rich, plant-based, and ethically sourced food products. Hazelnuts, with their appealing nutritional profile, rich flavor, and versatility, are ideally positioned to capitalize on these trends. The demand for healthy snacking options, the burgeoning vegan and vegetarian market, and the premiumization of food products all contribute to the sustained uplift in hazelnut consumption. Furthermore, advancements in processing technologies are enabling the development of novel hazelnut-derived ingredients, such as hazelnut flour, milk, and oils, broadening their appeal and utility across various food categories. The industry is actively investing in research and development to enhance crop yields, improve sustainability, and explore new applications, ensuring a dynamic and expanding market landscape.
Dominant Regions, Countries, or Segments in Hazelnut Industry
The global hazelnut market's dominance is intricately linked to specific regions, countries, and production segments that dictate supply, consumption, and trade dynamics.
Production Analysis:
Turkey stands as the undisputed global leader in hazelnut production, consistently accounting for over 60% of the world's total output. This dominance is attributed to its favorable climate, established agricultural practices, and extensive cultivation area. The parent market for hazelnut production is intrinsically tied to the agricultural sector, with farmers as the primary stakeholders.
- Key Drivers of Turkish Dominance:
- Ideal climatic conditions for hazelnut cultivation.
- Decades of expertise and established farming communities.
- Significant government support and export-oriented policies.
- Vast land dedicated to hazelnut orchards.
Consumption Analysis:
Europe, particularly Germany, Italy, and France, represents the largest hazelnut consumption hub. This is driven by the strong presence of major confectionery manufacturers and a well-established culture of incorporating hazelnuts into baked goods, chocolates, and spreads. The child market for hazelnut consumption is evident in the increasing demand from emerging economies and the expanding plant-based food sector globally.
- Factors Driving European Consumption:
- High demand for chocolate and confectionery products.
- Popularity of hazelnut spreads and pastries.
- Growing trend towards healthy snacking and nut consumption.
- Innovation in food product development incorporating hazelnuts.
Import Market Analysis (Value & Volume):
The import market is heavily influenced by the demand from major consuming nations and the supply capabilities of producing countries. European countries are also the leading importers, seeking to supplement domestic production and meet the high demand from their food industries. The import value is significantly impacted by price fluctuations and the quality of traded hazelnuts.
- Key Importers:
- Germany (estimated import volume: 150,000 million units, value: $800 million)
- Italy (estimated import volume: 120,000 million units, value: $700 million)
- United States (estimated import volume: 50,000 million units, value: $300 million)
Export Market Analysis (Value & Volume):
Turkey is the primary driver of the global export market, supplying the majority of the world's traded hazelnuts. Its export volume and value are critical indicators of global hazelnut availability and pricing. The export value is subject to the global supply-demand balance and the quality grades of hazelnuts.
- Leading Exporter:
- Turkey (estimated export volume: 750,000 million units, value: $4,500 million)
Price Trend Analysis:
Hazelnut price trends are notoriously volatile, largely dictated by crop yields in Turkey, weather patterns, and global demand. Speculative trading and the influence of major buyers also contribute to price fluctuations. The price of in-shell hazelnuts and kernels varies significantly.
- Influencing Factors on Prices:
- Crop size and quality.
- Geopolitical stability in producing regions.
- Demand from major confectionery companies.
- Currency exchange rates.
Industry Developments:
The industry developments segment encompasses a wide range of activities, including new cultivation technologies, processing innovations, sustainability initiatives, and market expansion strategies. Investments in new orchards, research into disease prevention, and the development of value-added hazelnut products are key areas of focus.
- Key Developments:
- Increased investment in sustainable and organic hazelnut farming.
- Advancements in processing technologies for oil extraction and flour production.
- Focus on traceability and supply chain transparency.
Hazelnut Industry Product Landscape
The hazelnut product landscape is expanding rapidly, driven by innovation and consumer demand for versatile, healthy ingredients. Beyond raw and roasted hazelnuts, the market now features a diverse array of value-added products. This includes high-demand hazelnut butter and spreads, prized for their rich flavor and smooth texture in confectionery and breakfast applications. Hazelnut flour has emerged as a popular gluten-free alternative in baking, catering to the growing health-conscious and allergen-aware consumer base. Hazelnut oil, valued for its delicate aroma and high smoke point, is increasingly used in culinary applications and cosmetics. Emerging products include hazelnut-based dairy alternatives, offering plant-based options in the beverage and dairy-free dessert markets. These product innovations are crucial for expanding hazelnut's market reach and capturing new consumer segments.
Key Drivers, Barriers & Challenges in Hazelnut Industry
Key Drivers:
The hazelnut industry is propelled by several powerful drivers, ensuring sustained growth and market expansion. The increasing global demand for plant-based foods and the inherent health benefits associated with hazelnuts, including their rich content of healthy fats, vitamins, and minerals, are primary catalysts. Furthermore, the growing popularity of premium confectionery and bakery products, where hazelnuts are a key ingredient, significantly bolsters demand. Technological advancements in cultivation and processing are also crucial, enhancing yield efficiency and product quality. Economic growth in emerging markets, leading to increased disposable income and a greater appetite for premium food products, further fuels market expansion.
Barriers & Challenges:
Despite its promising growth, the hazelnut industry faces significant barriers and challenges. Climate change and extreme weather events pose a substantial threat to crop yields, leading to price volatility and supply disruptions. The highly concentrated production in specific regions, particularly Turkey, creates vulnerability to geopolitical instability and regional agricultural issues. Pests and diseases can decimate crops, requiring continuous research and investment in control measures. Intense price competition among producers and the fluctuating global commodity markets can impact profitability. Stringent import regulations and phytosanitary requirements in various countries can also create hurdles for market access. Supply chain inefficiencies and a lack of adequate infrastructure in some producing regions further complicate operations.
Emerging Opportunities in Hazelnut Industry
Emerging opportunities in the hazelnut industry are centered on diversification and innovation. The burgeoning market for plant-based dairy alternatives, such as hazelnut milk and yogurt, presents a significant growth avenue. Furthermore, the increasing demand for functional foods offers opportunities for developing hazelnut-infused products with added health benefits. Untapped markets in Asia and Africa, with growing middle classes and an increasing adoption of Western dietary trends, represent significant expansion potential. The development of sustainable and traceable hazelnut supply chains is also a key opportunity, appealing to environmentally conscious consumers and premium brands. Innovations in value-added processing, such as novel hazelnut extracts for the flavor and fragrance industry, offer further diversification.
Growth Accelerators in the Hazelnut Industry Industry
Several catalysts are accelerating the long-term growth of the hazelnut industry. Technological breakthroughs in precision agriculture, disease-resistant varietals, and automated harvesting are enhancing productivity and sustainability, thereby increasing the overall supply potential. Strategic partnerships and collaborations between farmers, processors, and major food manufacturers are crucial for stabilizing supply chains, ensuring quality, and driving product innovation. Market expansion strategies, including penetration into new geographical regions and the development of novel consumer applications, are vital growth accelerators. The increasing consumer focus on health and wellness, coupled with the growing popularity of plant-based diets, provides a sustained tailwind for hazelnut consumption. Investments in research and development for new product formulations and improved crop management techniques will further solidify the industry's growth trajectory.
Key Players Shaping the Hazelnut Industry Market
- Ferrero
- Mondelez International
- Irca
- Proell
- Barry Callebaut
Notable Milestones in Hazelnut Industry Sector
- 2019: Increased investment in organic hazelnut cultivation in Italy and the US, responding to growing consumer demand.
- 2020: Significant technological advancements in pest and disease management for hazelnut orchards, particularly in Turkey.
- 2021: Major confectionery companies announce increased commitments to sourcing sustainable and ethically produced hazelnuts.
- 2022: Launch of new hazelnut-based plant-based milk alternatives by several major food brands, expanding consumer options.
- 2023: Emergence of advanced processing techniques for extracting high-value compounds from hazelnut by-products.
- 2024: Continued focus on improving supply chain traceability and transparency through blockchain technology.
In-Depth Hazelnut Industry Market Outlook
The hazelnut industry is projected for sustained and robust growth, propelled by evolving consumer preferences towards healthier, plant-based food options and the enduring appeal of hazelnuts in confectionery and culinary applications. Growth accelerators, including technological innovations in cultivation and processing, strategic market expansions into emerging economies, and the increasing demand for value-added hazelnut products like flours and oils, will continue to shape the market landscape. The industry's ability to address challenges related to climate variability and supply chain resilience will be crucial for long-term success. Overall, the outlook for the hazelnut industry remains exceptionally positive, offering significant opportunities for stakeholders across the value chain.
Hazelnut Industry Segmentation
- 1. Production Analysis
- 2. Consumption Analysis
- 3. Import Market Analysis (Value & Volume)
- 4. Export Market Analysis (Value & Volume)
- 5. Price Trend Analysis
Hazelnut Industry Segmentation By Geography
-
1. North America
- 1.1. United States
- 1.2. Canada
- 1.3. Mexico
-
2. Europe
- 2.1. Germany
- 2.2. United Kingdom
- 2.3. France
- 2.4. Italy
- 2.5. Austria
- 2.6. Netherlands
- 2.7. Spain
-
3. Asia Pacific
- 3.1. China
- 3.2. Australia
- 3.3. India
- 3.4. Japan
-
4. South America
- 4.1. Brazil
- 4.2. Argentina
-
5. Middle East and Africa
- 5.1. Turkey
- 5.2. South Africa
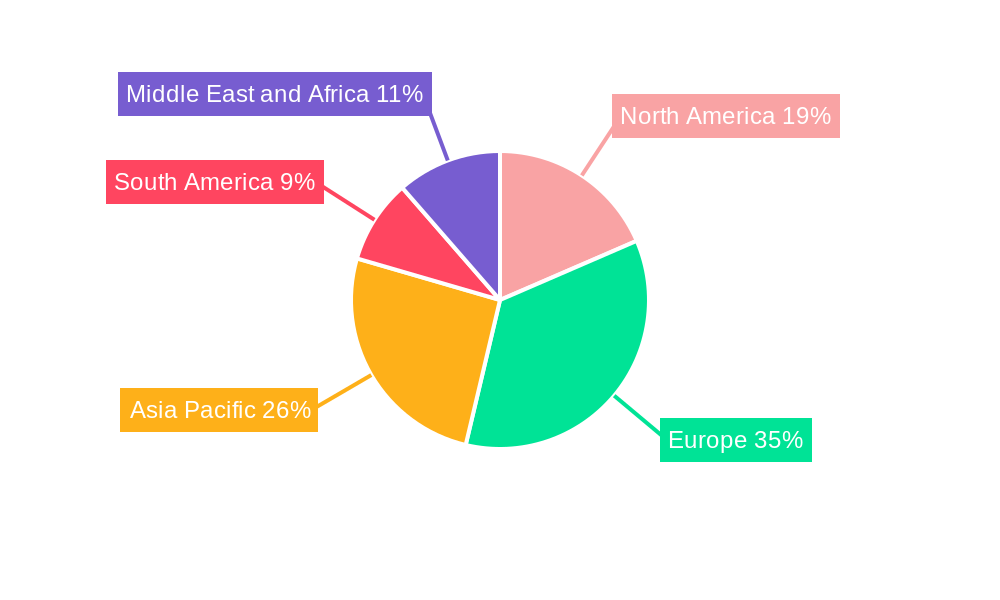
Hazelnut Industry Regional Market Share
Geographic Coverage of Hazelnut Industry
Hazelnut Industry REPORT HIGHLIGHTS
| Aspects | Details |
|---|---|
| Study Period | 2020-2034 |
| Base Year | 2025 |
| Estimated Year | 2026 |
| Forecast Period | 2026-2034 |
| Historical Period | 2020-2025 |
| Growth Rate | CAGR of 8.10% from 2020-2034 |
| Segmentation |
|
Table of Contents
- 1. Introduction
- 1.1. Research Scope
- 1.2. Market Segmentation
- 1.3. Research Objective
- 1.4. Definitions and Assumptions
- 2. Executive Summary
- 2.1. Market Snapshot
- 3. Market Dynamics
- 3.1. Market Drivers
- 3.2. Market Restrains
- 3.3. Market Trends
- 3.4. Market Opportunities
- 4. Market Factor Analysis
- 4.1. Porters Five Forces
- 4.1.1. Bargaining Power of Suppliers
- 4.1.2. Bargaining Power of Buyers
- 4.1.3. Threat of New Entrants
- 4.1.4. Threat of Substitutes
- 4.1.5. Competitive Rivalry
- 4.2. PESTEL analysis
- 4.3. BCG Analysis
- 4.3.1. Stars (High Growth, High Market Share)
- 4.3.2. Cash Cows (Low Growth, High Market Share)
- 4.3.3. Question Mark (High Growth, Low Market Share)
- 4.3.4. Dogs (Low Growth, Low Market Share)
- 4.4. Ansoff Matrix Analysis
- 4.5. Supply Chain Analysis
- 4.6. Regulatory Landscape
- 4.7. Current Market Potential and Opportunity Assessment (TAM–SAM–SOM Framework)
- 4.8. VDR Analyst Note
- 4.1. Porters Five Forces
- 5. Market Analysis, Insights and Forecast 2021-2033
- 5.1. Market Analysis, Insights and Forecast - by Production Analysis
- 5.2. Market Analysis, Insights and Forecast - by Consumption Analysis
- 5.3. Market Analysis, Insights and Forecast - by Import Market Analysis (Value & Volume)
- 5.4. Market Analysis, Insights and Forecast - by Export Market Analysis (Value & Volume)
- 5.5. Market Analysis, Insights and Forecast - by Price Trend Analysis
- 5.6. Market Analysis, Insights and Forecast - by Region
- 5.6.1. North America
- 5.6.2. Europe
- 5.6.3. Asia Pacific
- 5.6.4. South America
- 5.6.5. Middle East and Africa
- 6. Global Hazelnut Industry Analysis, Insights and Forecast, 2021-2033
- 6.1. Market Analysis, Insights and Forecast - by Production Analysis
- 6.2. Market Analysis, Insights and Forecast - by Consumption Analysis
- 6.3. Market Analysis, Insights and Forecast - by Import Market Analysis (Value & Volume)
- 6.4. Market Analysis, Insights and Forecast - by Export Market Analysis (Value & Volume)
- 6.5. Market Analysis, Insights and Forecast - by Price Trend Analysis
- 7. North America Hazelnut Industry Analysis, Insights and Forecast, 2021-2033
- 7.1. Market Analysis, Insights and Forecast - by Production Analysis
- 7.2. Market Analysis, Insights and Forecast - by Consumption Analysis
- 7.3. Market Analysis, Insights and Forecast - by Import Market Analysis (Value & Volume)
- 7.4. Market Analysis, Insights and Forecast - by Export Market Analysis (Value & Volume)
- 7.5. Market Analysis, Insights and Forecast - by Price Trend Analysis
- 8. Europe Hazelnut Industry Analysis, Insights and Forecast, 2021-2033
- 8.1. Market Analysis, Insights and Forecast - by Production Analysis
- 8.2. Market Analysis, Insights and Forecast - by Consumption Analysis
- 8.3. Market Analysis, Insights and Forecast - by Import Market Analysis (Value & Volume)
- 8.4. Market Analysis, Insights and Forecast - by Export Market Analysis (Value & Volume)
- 8.5. Market Analysis, Insights and Forecast - by Price Trend Analysis
- 9. Asia Pacific Hazelnut Industry Analysis, Insights and Forecast, 2021-2033
- 9.1. Market Analysis, Insights and Forecast - by Production Analysis
- 9.2. Market Analysis, Insights and Forecast - by Consumption Analysis
- 9.3. Market Analysis, Insights and Forecast - by Import Market Analysis (Value & Volume)
- 9.4. Market Analysis, Insights and Forecast - by Export Market Analysis (Value & Volume)
- 9.5. Market Analysis, Insights and Forecast - by Price Trend Analysis
- 10. South America Hazelnut Industry Analysis, Insights and Forecast, 2021-2033
- 10.1. Market Analysis, Insights and Forecast - by Production Analysis
- 10.2. Market Analysis, Insights and Forecast - by Consumption Analysis
- 10.3. Market Analysis, Insights and Forecast - by Import Market Analysis (Value & Volume)
- 10.4. Market Analysis, Insights and Forecast - by Export Market Analysis (Value & Volume)
- 10.5. Market Analysis, Insights and Forecast - by Price Trend Analysis
- 11. Middle East and Africa Hazelnut Industry Analysis, Insights and Forecast, 2021-2033
- 11.1. Market Analysis, Insights and Forecast - by Production Analysis
- 11.2. Market Analysis, Insights and Forecast - by Consumption Analysis
- 11.3. Market Analysis, Insights and Forecast - by Import Market Analysis (Value & Volume)
- 11.4. Market Analysis, Insights and Forecast - by Export Market Analysis (Value & Volume)
- 11.5. Market Analysis, Insights and Forecast - by Price Trend Analysis
- 12. Competitive Analysis
- 12.1. Company Profiles
- 12.1.1 Ferrero
- 12.1.1.1. Company Overview
- 12.1.1.2. Products
- 12.1.1.3. Company Financials
- 12.1.1.4. SWOT Analysis
- 12.1.2 Mondelez International
- 12.1.2.1. Company Overview
- 12.1.2.2. Products
- 12.1.2.3. Company Financials
- 12.1.2.4. SWOT Analysis
- 12.1.3 Irca
- 12.1.3.1. Company Overview
- 12.1.3.2. Products
- 12.1.3.3. Company Financials
- 12.1.3.4. SWOT Analysis
- 12.1.4 Proell
- 12.1.4.1. Company Overview
- 12.1.4.2. Products
- 12.1.4.3. Company Financials
- 12.1.4.4. SWOT Analysis
- 12.1.5 Barry Callebaut
- 12.1.5.1. Company Overview
- 12.1.5.2. Products
- 12.1.5.3. Company Financials
- 12.1.5.4. SWOT Analysis
- 12.1.1 Ferrero
- 12.2. Market Entropy
- 12.2.1 Company's Key Areas Served
- 12.2.2 Recent Developments
- 12.3. Company Market Share Analysis 2025
- 12.3.1 Top 5 Companies Market Share Analysis
- 12.3.2 Top 3 Companies Market Share Analysis
- 12.4. List of Potential Customers
- 13. Research Methodology
List of Figures
- Figure 1: Global Hazelnut Industry Revenue Breakdown (Million, %) by Region 2025 & 2033
- Figure 2: North America Hazelnut Industry Revenue (Million), by Production Analysis 2025 & 2033
- Figure 3: North America Hazelnut Industry Revenue Share (%), by Production Analysis 2025 & 2033
- Figure 4: North America Hazelnut Industry Revenue (Million), by Consumption Analysis 2025 & 2033
- Figure 5: North America Hazelnut Industry Revenue Share (%), by Consumption Analysis 2025 & 2033
- Figure 6: North America Hazelnut Industry Revenue (Million), by Import Market Analysis (Value & Volume) 2025 & 2033
- Figure 7: North America Hazelnut Industry Revenue Share (%), by Import Market Analysis (Value & Volume) 2025 & 2033
- Figure 8: North America Hazelnut Industry Revenue (Million), by Export Market Analysis (Value & Volume) 2025 & 2033
- Figure 9: North America Hazelnut Industry Revenue Share (%), by Export Market Analysis (Value & Volume) 2025 & 2033
- Figure 10: North America Hazelnut Industry Revenue (Million), by Price Trend Analysis 2025 & 2033
- Figure 11: North America Hazelnut Industry Revenue Share (%), by Price Trend Analysis 2025 & 2033
- Figure 12: North America Hazelnut Industry Revenue (Million), by Country 2025 & 2033
- Figure 13: North America Hazelnut Industry Revenue Share (%), by Country 2025 & 2033
- Figure 14: Europe Hazelnut Industry Revenue (Million), by Production Analysis 2025 & 2033
- Figure 15: Europe Hazelnut Industry Revenue Share (%), by Production Analysis 2025 & 2033
- Figure 16: Europe Hazelnut Industry Revenue (Million), by Consumption Analysis 2025 & 2033
- Figure 17: Europe Hazelnut Industry Revenue Share (%), by Consumption Analysis 2025 & 2033
- Figure 18: Europe Hazelnut Industry Revenue (Million), by Import Market Analysis (Value & Volume) 2025 & 2033
- Figure 19: Europe Hazelnut Industry Revenue Share (%), by Import Market Analysis (Value & Volume) 2025 & 2033
- Figure 20: Europe Hazelnut Industry Revenue (Million), by Export Market Analysis (Value & Volume) 2025 & 2033
- Figure 21: Europe Hazelnut Industry Revenue Share (%), by Export Market Analysis (Value & Volume) 2025 & 2033
- Figure 22: Europe Hazelnut Industry Revenue (Million), by Price Trend Analysis 2025 & 2033
- Figure 23: Europe Hazelnut Industry Revenue Share (%), by Price Trend Analysis 2025 & 2033
- Figure 24: Europe Hazelnut Industry Revenue (Million), by Country 2025 & 2033
- Figure 25: Europe Hazelnut Industry Revenue Share (%), by Country 2025 & 2033
- Figure 26: Asia Pacific Hazelnut Industry Revenue (Million), by Production Analysis 2025 & 2033
- Figure 27: Asia Pacific Hazelnut Industry Revenue Share (%), by Production Analysis 2025 & 2033
- Figure 28: Asia Pacific Hazelnut Industry Revenue (Million), by Consumption Analysis 2025 & 2033
- Figure 29: Asia Pacific Hazelnut Industry Revenue Share (%), by Consumption Analysis 2025 & 2033
- Figure 30: Asia Pacific Hazelnut Industry Revenue (Million), by Import Market Analysis (Value & Volume) 2025 & 2033
- Figure 31: Asia Pacific Hazelnut Industry Revenue Share (%), by Import Market Analysis (Value & Volume) 2025 & 2033
- Figure 32: Asia Pacific Hazelnut Industry Revenue (Million), by Export Market Analysis (Value & Volume) 2025 & 2033
- Figure 33: Asia Pacific Hazelnut Industry Revenue Share (%), by Export Market Analysis (Value & Volume) 2025 & 2033
- Figure 34: Asia Pacific Hazelnut Industry Revenue (Million), by Price Trend Analysis 2025 & 2033
- Figure 35: Asia Pacific Hazelnut Industry Revenue Share (%), by Price Trend Analysis 2025 & 2033
- Figure 36: Asia Pacific Hazelnut Industry Revenue (Million), by Country 2025 & 2033
- Figure 37: Asia Pacific Hazelnut Industry Revenue Share (%), by Country 2025 & 2033
- Figure 38: South America Hazelnut Industry Revenue (Million), by Production Analysis 2025 & 2033
- Figure 39: South America Hazelnut Industry Revenue Share (%), by Production Analysis 2025 & 2033
- Figure 40: South America Hazelnut Industry Revenue (Million), by Consumption Analysis 2025 & 2033
- Figure 41: South America Hazelnut Industry Revenue Share (%), by Consumption Analysis 2025 & 2033
- Figure 42: South America Hazelnut Industry Revenue (Million), by Import Market Analysis (Value & Volume) 2025 & 2033
- Figure 43: South America Hazelnut Industry Revenue Share (%), by Import Market Analysis (Value & Volume) 2025 & 2033
- Figure 44: South America Hazelnut Industry Revenue (Million), by Export Market Analysis (Value & Volume) 2025 & 2033
- Figure 45: South America Hazelnut Industry Revenue Share (%), by Export Market Analysis (Value & Volume) 2025 & 2033
- Figure 46: South America Hazelnut Industry Revenue (Million), by Price Trend Analysis 2025 & 2033
- Figure 47: South America Hazelnut Industry Revenue Share (%), by Price Trend Analysis 2025 & 2033
- Figure 48: South America Hazelnut Industry Revenue (Million), by Country 2025 & 2033
- Figure 49: South America Hazelnut Industry Revenue Share (%), by Country 2025 & 2033
- Figure 50: Middle East and Africa Hazelnut Industry Revenue (Million), by Production Analysis 2025 & 2033
- Figure 51: Middle East and Africa Hazelnut Industry Revenue Share (%), by Production Analysis 2025 & 2033
- Figure 52: Middle East and Africa Hazelnut Industry Revenue (Million), by Consumption Analysis 2025 & 2033
- Figure 53: Middle East and Africa Hazelnut Industry Revenue Share (%), by Consumption Analysis 2025 & 2033
- Figure 54: Middle East and Africa Hazelnut Industry Revenue (Million), by Import Market Analysis (Value & Volume) 2025 & 2033
- Figure 55: Middle East and Africa Hazelnut Industry Revenue Share (%), by Import Market Analysis (Value & Volume) 2025 & 2033
- Figure 56: Middle East and Africa Hazelnut Industry Revenue (Million), by Export Market Analysis (Value & Volume) 2025 & 2033
- Figure 57: Middle East and Africa Hazelnut Industry Revenue Share (%), by Export Market Analysis (Value & Volume) 2025 & 2033
- Figure 58: Middle East and Africa Hazelnut Industry Revenue (Million), by Price Trend Analysis 2025 & 2033
- Figure 59: Middle East and Africa Hazelnut Industry Revenue Share (%), by Price Trend Analysis 2025 & 2033
- Figure 60: Middle East and Africa Hazelnut Industry Revenue (Million), by Country 2025 & 2033
- Figure 61: Middle East and Africa Hazelnut Industry Revenue Share (%), by Country 2025 & 2033
List of Tables
- Table 1: Global Hazelnut Industry Revenue Million Forecast, by Production Analysis 2020 & 2033
- Table 2: Global Hazelnut Industry Revenue Million Forecast, by Consumption Analysis 2020 & 2033
- Table 3: Global Hazelnut Industry Revenue Million Forecast, by Import Market Analysis (Value & Volume) 2020 & 2033
- Table 4: Global Hazelnut Industry Revenue Million Forecast, by Export Market Analysis (Value & Volume) 2020 & 2033
- Table 5: Global Hazelnut Industry Revenue Million Forecast, by Price Trend Analysis 2020 & 2033
- Table 6: Global Hazelnut Industry Revenue Million Forecast, by Region 2020 & 2033
- Table 7: Global Hazelnut Industry Revenue Million Forecast, by Production Analysis 2020 & 2033
- Table 8: Global Hazelnut Industry Revenue Million Forecast, by Consumption Analysis 2020 & 2033
- Table 9: Global Hazelnut Industry Revenue Million Forecast, by Import Market Analysis (Value & Volume) 2020 & 2033
- Table 10: Global Hazelnut Industry Revenue Million Forecast, by Export Market Analysis (Value & Volume) 2020 & 2033
- Table 11: Global Hazelnut Industry Revenue Million Forecast, by Price Trend Analysis 2020 & 2033
- Table 12: Global Hazelnut Industry Revenue Million Forecast, by Country 2020 & 2033
- Table 13: United States Hazelnut Industry Revenue (Million) Forecast, by Application 2020 & 2033
- Table 14: Canada Hazelnut Industry Revenue (Million) Forecast, by Application 2020 & 2033
- Table 15: Mexico Hazelnut Industry Revenue (Million) Forecast, by Application 2020 & 2033
- Table 16: Global Hazelnut Industry Revenue Million Forecast, by Production Analysis 2020 & 2033
- Table 17: Global Hazelnut Industry Revenue Million Forecast, by Consumption Analysis 2020 & 2033
- Table 18: Global Hazelnut Industry Revenue Million Forecast, by Import Market Analysis (Value & Volume) 2020 & 2033
- Table 19: Global Hazelnut Industry Revenue Million Forecast, by Export Market Analysis (Value & Volume) 2020 & 2033
- Table 20: Global Hazelnut Industry Revenue Million Forecast, by Price Trend Analysis 2020 & 2033
- Table 21: Global Hazelnut Industry Revenue Million Forecast, by Country 2020 & 2033
- Table 22: Germany Hazelnut Industry Revenue (Million) Forecast, by Application 2020 & 2033
- Table 23: United Kingdom Hazelnut Industry Revenue (Million) Forecast, by Application 2020 & 2033
- Table 24: France Hazelnut Industry Revenue (Million) Forecast, by Application 2020 & 2033
- Table 25: Italy Hazelnut Industry Revenue (Million) Forecast, by Application 2020 & 2033
- Table 26: Austria Hazelnut Industry Revenue (Million) Forecast, by Application 2020 & 2033
- Table 27: Netherlands Hazelnut Industry Revenue (Million) Forecast, by Application 2020 & 2033
- Table 28: Spain Hazelnut Industry Revenue (Million) Forecast, by Application 2020 & 2033
- Table 29: Global Hazelnut Industry Revenue Million Forecast, by Production Analysis 2020 & 2033
- Table 30: Global Hazelnut Industry Revenue Million Forecast, by Consumption Analysis 2020 & 2033
- Table 31: Global Hazelnut Industry Revenue Million Forecast, by Import Market Analysis (Value & Volume) 2020 & 2033
- Table 32: Global Hazelnut Industry Revenue Million Forecast, by Export Market Analysis (Value & Volume) 2020 & 2033
- Table 33: Global Hazelnut Industry Revenue Million Forecast, by Price Trend Analysis 2020 & 2033
- Table 34: Global Hazelnut Industry Revenue Million Forecast, by Country 2020 & 2033
- Table 35: China Hazelnut Industry Revenue (Million) Forecast, by Application 2020 & 2033
- Table 36: Australia Hazelnut Industry Revenue (Million) Forecast, by Application 2020 & 2033
- Table 37: India Hazelnut Industry Revenue (Million) Forecast, by Application 2020 & 2033
- Table 38: Japan Hazelnut Industry Revenue (Million) Forecast, by Application 2020 & 2033
- Table 39: Global Hazelnut Industry Revenue Million Forecast, by Production Analysis 2020 & 2033
- Table 40: Global Hazelnut Industry Revenue Million Forecast, by Consumption Analysis 2020 & 2033
- Table 41: Global Hazelnut Industry Revenue Million Forecast, by Import Market Analysis (Value & Volume) 2020 & 2033
- Table 42: Global Hazelnut Industry Revenue Million Forecast, by Export Market Analysis (Value & Volume) 2020 & 2033
- Table 43: Global Hazelnut Industry Revenue Million Forecast, by Price Trend Analysis 2020 & 2033
- Table 44: Global Hazelnut Industry Revenue Million Forecast, by Country 2020 & 2033
- Table 45: Brazil Hazelnut Industry Revenue (Million) Forecast, by Application 2020 & 2033
- Table 46: Argentina Hazelnut Industry Revenue (Million) Forecast, by Application 2020 & 2033
- Table 47: Global Hazelnut Industry Revenue Million Forecast, by Production Analysis 2020 & 2033
- Table 48: Global Hazelnut Industry Revenue Million Forecast, by Consumption Analysis 2020 & 2033
- Table 49: Global Hazelnut Industry Revenue Million Forecast, by Import Market Analysis (Value & Volume) 2020 & 2033
- Table 50: Global Hazelnut Industry Revenue Million Forecast, by Export Market Analysis (Value & Volume) 2020 & 2033
- Table 51: Global Hazelnut Industry Revenue Million Forecast, by Price Trend Analysis 2020 & 2033
- Table 52: Global Hazelnut Industry Revenue Million Forecast, by Country 2020 & 2033
- Table 53: Turkey Hazelnut Industry Revenue (Million) Forecast, by Application 2020 & 2033
- Table 54: South Africa Hazelnut Industry Revenue (Million) Forecast, by Application 2020 & 2033
Frequently Asked Questions
1. What is the projected Compound Annual Growth Rate (CAGR) of the Hazelnut Industry?
The projected CAGR is approximately 8.10%.
2. Which companies are prominent players in the Hazelnut Industry?
Key companies in the market include Ferrero, Mondelez International, Irca, Proell, Barry Callebaut.
3. What are the main segments of the Hazelnut Industry?
The market segments include Production Analysis, Consumption Analysis, Import Market Analysis (Value & Volume), Export Market Analysis (Value & Volume), Price Trend Analysis.
4. Can you provide details about the market size?
The market size is estimated to be USD 512.62 Million as of 2022.
5. What are some drivers contributing to market growth?
Increasing Demand for Garlic Due to Various Uses in Industries; Rising Demad of Organic Garlic; Increasing Government Initiatives.
6. What are the notable trends driving market growth?
High Demand from the Chocolate Industry.
7. Are there any restraints impacting market growth?
Lack of Technical Knowledge of Farmers; Price Fluctuations.
8. Can you provide examples of recent developments in the market?
N/A
9. What pricing options are available for accessing the report?
Pricing options include single-user, multi-user, and enterprise licenses priced at USD 4750, USD 5250, and USD 8750 respectively.
10. Is the market size provided in terms of value or volume?
The market size is provided in terms of value, measured in Million.
11. Are there any specific market keywords associated with the report?
Yes, the market keyword associated with the report is "Hazelnut Industry," which aids in identifying and referencing the specific market segment covered.
12. How do I determine which pricing option suits my needs best?
The pricing options vary based on user requirements and access needs. Individual users may opt for single-user licenses, while businesses requiring broader access may choose multi-user or enterprise licenses for cost-effective access to the report.
13. Are there any additional resources or data provided in the Hazelnut Industry report?
While the report offers comprehensive insights, it's advisable to review the specific contents or supplementary materials provided to ascertain if additional resources or data are available.
14. How can I stay updated on further developments or reports in the Hazelnut Industry?
To stay informed about further developments, trends, and reports in the Hazelnut Industry, consider subscribing to industry newsletters, following relevant companies and organizations, or regularly checking reputable industry news sources and publications.
Methodology
Step 1 - Identification of Relevant Samples Size from Population Database


Step 2 - Approaches for Defining Global Market Size (Value, Volume* & Price*)

Note*: In applicable scenarios
Step 3 - Data Sources
Primary Research
- Web Analytics
- Survey Reports
- Research Institute
- Latest Research Reports
- Opinion Leaders
Secondary Research
- Annual Reports
- White Paper
- Latest Press Release
- Industry Association
- Paid Database
- Investor Presentations

Step 4 - Data Triangulation
Involves using different sources of information in order to increase the validity of a study
These sources are likely to be stakeholders in a program - participants, other researchers, program staff, other community members, and so on.
Then we put all data in single framework & apply various statistical tools to find out the dynamic on the market.
During the analysis stage, feedback from the stakeholder groups would be compared to determine areas of agreement as well as areas of divergence