
Key Insights
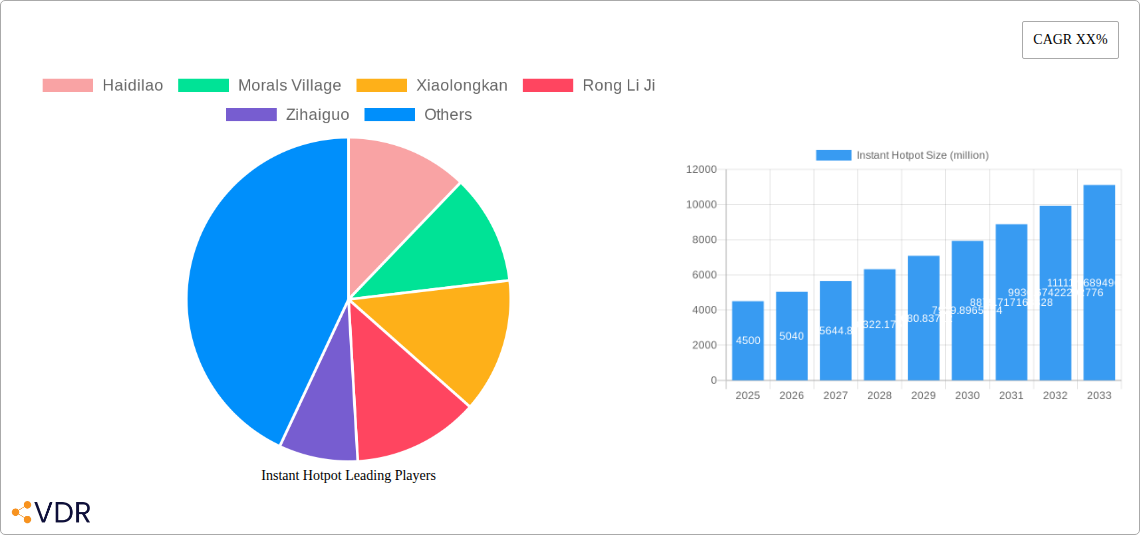
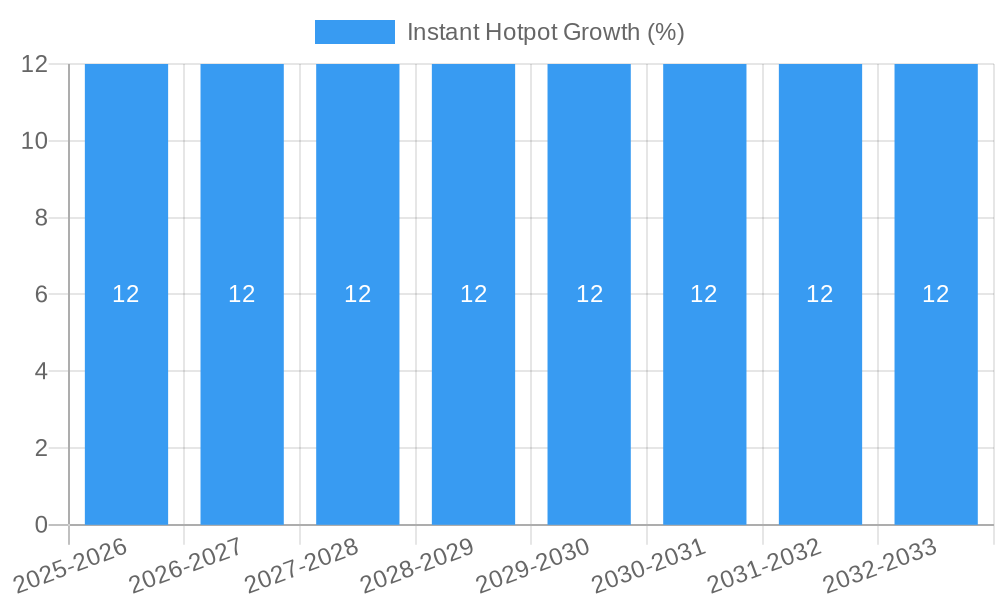
The global Instant Hotpot market is poised for substantial growth, projected to reach approximately $4,500 million by 2025, with a Compound Annual Growth Rate (CAGR) of around 12% between 2025 and 2033. This robust expansion is primarily fueled by evolving consumer lifestyles characterized by increased demand for convenience, time-saving food solutions, and a growing appetite for diverse culinary experiences. The market's dynamism is further propelled by innovative product development, including a wider array of flavors, healthier ingredient options, and more sophisticated cooking methods that enhance the authentic hotpot taste. The rise of online sales channels, facilitated by e-commerce platforms and rapid delivery services, plays a pivotal role in extending market reach and accessibility, catering to a younger demographic that embraces digital convenience. Furthermore, a growing interest in ethnic and fusion cuisines globally is contributing to the increased adoption of instant hotpot products.
Despite its promising trajectory, the market faces certain restraints. The perceived lower quality or less authentic taste compared to traditional hotpot experiences can be a barrier for some consumers. Additionally, fluctuating raw material prices, particularly for meat and specific spices, can impact profit margins for manufacturers and influence final product pricing. Regulatory hurdles related to food safety and labeling standards in different regions may also pose challenges. However, the market's segmentation, particularly the significant share held by Meat Instant Hotpot and the burgeoning Online Sales application, indicates clear areas of strength and opportunity. Key players like Haidilao, Morals Village, and Xiaolongkan are strategically investing in product innovation and market expansion to capitalize on these trends and overcome potential limitations, ensuring sustained market development.
Instant Hotpot Market Dynamics & Structure
The instant hotpot market is characterized by a moderately concentrated structure, with established players like Haidilao, Morals Village, Xiaolongkan, Rong Li Ji, Zihaiguo, and Ji Xiangju holding significant market shares. Technological innovation is primarily driven by advancements in food preservation, flavor encapsulation, and convenient packaging solutions, aiming to replicate the authentic hotpot experience with minimal preparation. Regulatory frameworks, particularly concerning food safety and labeling, are crucial for market entry and sustained growth, with strict adherence to regional food standards being paramount. Competitive product substitutes include ready-to-eat meals, frozen meals, and traditional fresh hotpot ingredients, all vying for consumer attention and disposable income. End-user demographics reveal a growing segment of young professionals and students seeking convenient yet satisfying meal solutions, alongside a traditional consumer base that appreciates the ritual of hotpot. Merger and acquisition trends are likely to focus on expanding distribution networks, acquiring innovative technologies, and consolidating market presence in key geographical regions.
- Market Concentration: Dominated by a few key players, but with room for niche and emerging brands.
- Technological Innovation Drivers: Enhanced shelf-life, improved flavor profiles, sustainable packaging.
- Regulatory Frameworks: Stringent food safety, clear labeling requirements, regional compliance.
- Competitive Product Substitutes: Ready-to-eat meals, frozen foods, fresh ingredient meal kits.
- End-User Demographics: Young urban professionals, students, convenience-seeking families.
- M&A Trends: Consolidation for scale, technology acquisition, distribution network expansion.
Instant Hotpot Growth Trends & Insights
The instant hotpot market is poised for substantial growth, driven by evolving consumer lifestyles, increasing disposable incomes, and a persistent demand for convenient and flavorful meal options. The global market size is projected to witness a robust Compound Annual Growth Rate (CAGR) over the forecast period, reflecting a significant uptick in adoption rates across both developed and emerging economies. This expansion is fueled by a confluence of factors including urbanization, smaller household sizes, and the growing acceptance of novel food products. Technological disruptions are playing a pivotal role, with innovations in retort pouch technology and aseptic packaging extending shelf life and preserving the quality of ingredients, making instant hotpots a more attractive and accessible option. Consumer behavior shifts are particularly noteworthy, with a growing preference for personalized eating experiences and a willingness to explore diverse cuisines from the comfort of their homes. The rise of e-commerce platforms has further democratized access to a wide array of instant hotpot products, contributing to increased market penetration. The base year, 2025, sets a strong benchmark for this upward trajectory, with significant market penetration already observed. The study period, spanning from 2019 to 2033, encapsulates the rapid evolution of this segment, from its nascent stages to its current dynamic growth phase and its projected future expansion. The estimated year of 2025 will show a market valued at approximately $12,000 million units, with the forecast period of 2025-2033 anticipating a CAGR of 8.5%, reaching an estimated market value of $25,000 million units by 2033. The historical period from 2019-2024 has seen a steady growth, with the market size growing from $7,500 million units in 2019 to an estimated $11,500 million units in 2024.
Dominant Regions, Countries, or Segments in Instant Hotpot
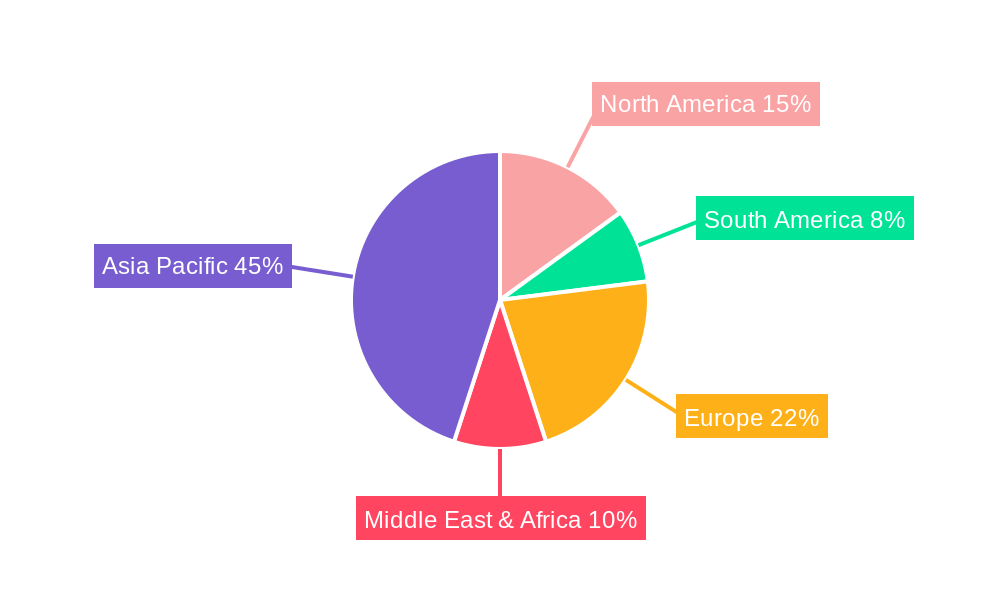
Asia Pacific stands out as the dominant region in the instant hotpot market, driven by the deeply ingrained culinary culture of hotpot consumption and the rapid economic development within its key economies. China, in particular, is the epicenter of this dominance, accounting for a substantial portion of global sales, influenced by the sheer volume of its population and the widespread availability and popularity of instant hotpot solutions. Online Sales have emerged as a critical growth engine within this region, facilitated by advanced e-commerce infrastructure and a digitally savvy consumer base that readily embraces online grocery shopping and food delivery services. This segment's growth is further bolstered by the convenience it offers, allowing consumers to procure their favorite hotpot ingredients and kits with just a few clicks. The Types segment, specifically Meat Instant Hotpot, commands a significant market share due to its traditional appeal and the widespread availability of various meat options. However, Vegetarian Instant Hotpot is experiencing a remarkable surge in demand, aligning with global health and dietary trends, and appealing to a growing segment of health-conscious consumers and vegetarians/vegans. The "Others" category, encompassing unique flavor profiles and innovative product formats, also contributes to market dynamism. Key drivers of this regional dominance include supportive government policies promoting food innovation and e-commerce, robust supply chain networks enabling efficient product distribution, and a deep understanding of local taste preferences by leading manufacturers. Market share within Asia Pacific is estimated at 65% for 2025, with China alone contributing 45% of the global market. The online sales segment is projected to grow at a CAGR of 10% from 2025 to 2033, reaching an estimated market value of $12,000 million units. Vegetarian Instant Hotpot's market share is expected to double by 2033 from its current 15% in 2025.
Instant Hotpot Product Landscape
The instant hotpot product landscape is characterized by an increasing array of innovative offerings designed for convenience and flavor. Manufacturers are focusing on enhancing the authenticity of taste and texture, utilizing advanced food processing techniques to preserve the essence of traditional hotpot broths and ingredients. Product innovations include self-heating technology for on-the-go consumption, a variety of spicy and non-spicy broth bases, and a diverse selection of protein and vegetable options. Applications range from individual meal kits for solo diners to larger family-sized packs. Performance metrics are largely centered around shelf-life, ease of preparation (typically under 15 minutes), and the quality of the final taste experience. Unique selling propositions often revolve around regional flavor specialties, the inclusion of premium ingredients, and plant-based or low-sodium options to cater to evolving consumer preferences. Technological advancements in ingredient sourcing and formulation are enabling the creation of more shelf-stable, yet fresh-tasting, instant hotpot products.
Key Drivers, Barriers & Challenges in Instant Hotpot
Key Drivers: The instant hotpot market is propelled by several key factors. Technological advancements in food preservation and packaging are crucial, enabling longer shelf lives and maintaining product quality. The rising demand for convenience food due to busy lifestyles is a major contributor. Growing disposable incomes and an increasing appreciation for diverse culinary experiences, particularly Asian cuisine, further fuel demand. E-commerce penetration and improved logistics have made these products more accessible. Health and wellness trends are also driving innovation, with a demand for healthier ingredients and options.
Barriers & Challenges: Despite the positive outlook, the market faces several hurdles. Maintaining the authenticity of flavor and texture compared to traditional hotpot remains a challenge. Stringent food safety regulations and quality control are critical, and non-compliance can lead to significant repercussions. Perishable ingredients and supply chain complexities, especially for fresh components, can impact profitability and product availability, with estimated supply chain disruptions costing the industry up to $800 million annually in lost sales. Intense competition from established brands and substitute products necessitates continuous innovation and competitive pricing. Consumer perception and a potential lack of awareness in certain markets can also act as barriers.
Emerging Opportunities in Instant Hotpot
Emerging opportunities in the instant hotpot industry are vast and varied, catering to a dynamic consumer base. Untapped markets in North America and Europe present significant potential for expansion, with a growing interest in global cuisines and convenient meal solutions. Innovative applications such as personalized flavor customization options, plant-based protein alternatives, and integrated meal kits that include complementary beverages or desserts are gaining traction. Evolving consumer preferences for sustainable packaging and ethically sourced ingredients offer a niche for brands that prioritize these aspects. Furthermore, the development of specialty instant hotpots catering to specific dietary needs, like gluten-free or low-carb options, is an area ripe for exploration. Partnerships with food bloggers and influencers can also be leveraged to build brand awareness and drive adoption in new demographics.
Growth Accelerators in the Instant Hotpot Industry
Several catalysts are accelerating the growth of the instant hotpot industry. Technological breakthroughs in flavor encapsulation and food preservation are continuously improving the quality and authenticity of the products, making them more appealing to consumers. Strategic partnerships between manufacturers and e-commerce platforms or delivery services are expanding reach and accessibility. Market expansion strategies, including targeted marketing campaigns and the introduction of localized flavor profiles in new geographies, are key growth drivers. The increasing focus on health and wellness is also a significant accelerator, pushing innovation towards healthier ingredients and cleaner labels. Investments in research and development to create novel product formats and cater to niche dietary requirements are further propelling the industry forward.
Key Players Shaping the Instant Hotpot Market
- Haidilao
- Morals Village
- Xiaolongkan
- Rong Li Ji
- Zihaiguo
- Ji Xiangju
Notable Milestones in Instant Hotpot Sector
- 2020: Haidilao launches a comprehensive range of instant hotpot products, significantly boosting market presence and brand recognition.
- 2021: Morals Village innovates with self-heating technology in their instant hotpot, enhancing convenience for consumers.
- 2022: Xiaolongkan expands its online sales channels, leveraging e-commerce for wider distribution and customer reach.
- 2023: Zihaiguo introduces plant-based meat alternatives in its instant hotpot line, catering to growing vegetarian and vegan demand.
- 2024: Rong Li Ji announces strategic partnerships with major convenience store chains, increasing offline accessibility.
- 2024: Ji Xiangju focuses on sustainable packaging solutions, aligning with growing environmental consciousness.
In-Depth Instant Hotpot Market Outlook
The future outlook for the instant hotpot market is exceptionally positive, driven by ongoing technological innovation that continues to refine product quality and convenience. Strategic partnerships between manufacturers, retailers, and logistics providers will further enhance market penetration and consumer accessibility. Market expansion strategies, particularly into underserved international markets and through the development of niche product lines, are poised to unlock significant growth. The increasing global appetite for convenient, flavorful, and diverse culinary experiences solidifies the long-term growth potential of this dynamic sector. The industry is well-positioned to capitalize on evolving consumer lifestyles and preferences, ensuring sustained expansion in the coming years.
Instant Hotpot Segmentation
-
1. Application
- 1.1. Online Sales
- 1.2. Offline Sales
-
2. Types
- 2.1. Vegetarian Instant Hotpot
- 2.2. Meat Instant Hotpot
- 2.3. Others
Instant Hotpot Segmentation By Geography
-
1. North America
- 1.1. United States
- 1.2. Canada
- 1.3. Mexico
-
2. South America
- 2.1. Brazil
- 2.2. Argentina
- 2.3. Rest of South America
-
3. Europe
- 3.1. United Kingdom
- 3.2. Germany
- 3.3. France
- 3.4. Italy
- 3.5. Spain
- 3.6. Russia
- 3.7. Benelux
- 3.8. Nordics
- 3.9. Rest of Europe
-
4. Middle East & Africa
- 4.1. Turkey
- 4.2. Israel
- 4.3. GCC
- 4.4. North Africa
- 4.5. South Africa
- 4.6. Rest of Middle East & Africa
-
5. Asia Pacific
- 5.1. China
- 5.2. India
- 5.3. Japan
- 5.4. South Korea
- 5.5. ASEAN
- 5.6. Oceania
- 5.7. Rest of Asia Pacific
Instant Hotpot REPORT HIGHLIGHTS
| Aspects | Details |
|---|---|
| Study Period | 2019-2033 |
| Base Year | 2024 |
| Estimated Year | 2025 |
| Forecast Period | 2025-2033 |
| Historical Period | 2019-2024 |
| Growth Rate | CAGR of XX% from 2019-2033 |
| Segmentation |
|
Table of Contents
- 1. Introduction
- 1.1. Research Scope
- 1.2. Market Segmentation
- 1.3. Research Methodology
- 1.4. Definitions and Assumptions
- 2. Executive Summary
- 2.1. Introduction
- 3. Market Dynamics
- 3.1. Introduction
- 3.2. Market Drivers
- 3.3. Market Restrains
- 3.4. Market Trends
- 4. Market Factor Analysis
- 4.1. Porters Five Forces
- 4.2. Supply/Value Chain
- 4.3. PESTEL analysis
- 4.4. Market Entropy
- 4.5. Patent/Trademark Analysis
- 5. Global Instant Hotpot Analysis, Insights and Forecast, 2019-2031
- 5.1. Market Analysis, Insights and Forecast - by Application
- 5.1.1. Online Sales
- 5.1.2. Offline Sales
- 5.2. Market Analysis, Insights and Forecast - by Types
- 5.2.1. Vegetarian Instant Hotpot
- 5.2.2. Meat Instant Hotpot
- 5.2.3. Others
- 5.3. Market Analysis, Insights and Forecast - by Region
- 5.3.1. North America
- 5.3.2. South America
- 5.3.3. Europe
- 5.3.4. Middle East & Africa
- 5.3.5. Asia Pacific
- 5.1. Market Analysis, Insights and Forecast - by Application
- 6. North America Instant Hotpot Analysis, Insights and Forecast, 2019-2031
- 6.1. Market Analysis, Insights and Forecast - by Application
- 6.1.1. Online Sales
- 6.1.2. Offline Sales
- 6.2. Market Analysis, Insights and Forecast - by Types
- 6.2.1. Vegetarian Instant Hotpot
- 6.2.2. Meat Instant Hotpot
- 6.2.3. Others
- 6.1. Market Analysis, Insights and Forecast - by Application
- 7. South America Instant Hotpot Analysis, Insights and Forecast, 2019-2031
- 7.1. Market Analysis, Insights and Forecast - by Application
- 7.1.1. Online Sales
- 7.1.2. Offline Sales
- 7.2. Market Analysis, Insights and Forecast - by Types
- 7.2.1. Vegetarian Instant Hotpot
- 7.2.2. Meat Instant Hotpot
- 7.2.3. Others
- 7.1. Market Analysis, Insights and Forecast - by Application
- 8. Europe Instant Hotpot Analysis, Insights and Forecast, 2019-2031
- 8.1. Market Analysis, Insights and Forecast - by Application
- 8.1.1. Online Sales
- 8.1.2. Offline Sales
- 8.2. Market Analysis, Insights and Forecast - by Types
- 8.2.1. Vegetarian Instant Hotpot
- 8.2.2. Meat Instant Hotpot
- 8.2.3. Others
- 8.1. Market Analysis, Insights and Forecast - by Application
- 9. Middle East & Africa Instant Hotpot Analysis, Insights and Forecast, 2019-2031
- 9.1. Market Analysis, Insights and Forecast - by Application
- 9.1.1. Online Sales
- 9.1.2. Offline Sales
- 9.2. Market Analysis, Insights and Forecast - by Types
- 9.2.1. Vegetarian Instant Hotpot
- 9.2.2. Meat Instant Hotpot
- 9.2.3. Others
- 9.1. Market Analysis, Insights and Forecast - by Application
- 10. Asia Pacific Instant Hotpot Analysis, Insights and Forecast, 2019-2031
- 10.1. Market Analysis, Insights and Forecast - by Application
- 10.1.1. Online Sales
- 10.1.2. Offline Sales
- 10.2. Market Analysis, Insights and Forecast - by Types
- 10.2.1. Vegetarian Instant Hotpot
- 10.2.2. Meat Instant Hotpot
- 10.2.3. Others
- 10.1. Market Analysis, Insights and Forecast - by Application
- 11. Competitive Analysis
- 11.1. Global Market Share Analysis 2024
- 11.2. Company Profiles
- 11.2.1 Haidilao
- 11.2.1.1. Overview
- 11.2.1.2. Products
- 11.2.1.3. SWOT Analysis
- 11.2.1.4. Recent Developments
- 11.2.1.5. Financials (Based on Availability)
- 11.2.2 Morals Village
- 11.2.2.1. Overview
- 11.2.2.2. Products
- 11.2.2.3. SWOT Analysis
- 11.2.2.4. Recent Developments
- 11.2.2.5. Financials (Based on Availability)
- 11.2.3 Xiaolongkan
- 11.2.3.1. Overview
- 11.2.3.2. Products
- 11.2.3.3. SWOT Analysis
- 11.2.3.4. Recent Developments
- 11.2.3.5. Financials (Based on Availability)
- 11.2.4 Rong Li Ji
- 11.2.4.1. Overview
- 11.2.4.2. Products
- 11.2.4.3. SWOT Analysis
- 11.2.4.4. Recent Developments
- 11.2.4.5. Financials (Based on Availability)
- 11.2.5 Zihaiguo
- 11.2.5.1. Overview
- 11.2.5.2. Products
- 11.2.5.3. SWOT Analysis
- 11.2.5.4. Recent Developments
- 11.2.5.5. Financials (Based on Availability)
- 11.2.6 Ji Xiangju
- 11.2.6.1. Overview
- 11.2.6.2. Products
- 11.2.6.3. SWOT Analysis
- 11.2.6.4. Recent Developments
- 11.2.6.5. Financials (Based on Availability)
- 11.2.1 Haidilao
List of Figures
- Figure 1: Global Instant Hotpot Revenue Breakdown (million, %) by Region 2024 & 2032
- Figure 2: Global Instant Hotpot Volume Breakdown (K, %) by Region 2024 & 2032
- Figure 3: North America Instant Hotpot Revenue (million), by Application 2024 & 2032
- Figure 4: North America Instant Hotpot Volume (K), by Application 2024 & 2032
- Figure 5: North America Instant Hotpot Revenue Share (%), by Application 2024 & 2032
- Figure 6: North America Instant Hotpot Volume Share (%), by Application 2024 & 2032
- Figure 7: North America Instant Hotpot Revenue (million), by Types 2024 & 2032
- Figure 8: North America Instant Hotpot Volume (K), by Types 2024 & 2032
- Figure 9: North America Instant Hotpot Revenue Share (%), by Types 2024 & 2032
- Figure 10: North America Instant Hotpot Volume Share (%), by Types 2024 & 2032
- Figure 11: North America Instant Hotpot Revenue (million), by Country 2024 & 2032
- Figure 12: North America Instant Hotpot Volume (K), by Country 2024 & 2032
- Figure 13: North America Instant Hotpot Revenue Share (%), by Country 2024 & 2032
- Figure 14: North America Instant Hotpot Volume Share (%), by Country 2024 & 2032
- Figure 15: South America Instant Hotpot Revenue (million), by Application 2024 & 2032
- Figure 16: South America Instant Hotpot Volume (K), by Application 2024 & 2032
- Figure 17: South America Instant Hotpot Revenue Share (%), by Application 2024 & 2032
- Figure 18: South America Instant Hotpot Volume Share (%), by Application 2024 & 2032
- Figure 19: South America Instant Hotpot Revenue (million), by Types 2024 & 2032
- Figure 20: South America Instant Hotpot Volume (K), by Types 2024 & 2032
- Figure 21: South America Instant Hotpot Revenue Share (%), by Types 2024 & 2032
- Figure 22: South America Instant Hotpot Volume Share (%), by Types 2024 & 2032
- Figure 23: South America Instant Hotpot Revenue (million), by Country 2024 & 2032
- Figure 24: South America Instant Hotpot Volume (K), by Country 2024 & 2032
- Figure 25: South America Instant Hotpot Revenue Share (%), by Country 2024 & 2032
- Figure 26: South America Instant Hotpot Volume Share (%), by Country 2024 & 2032
- Figure 27: Europe Instant Hotpot Revenue (million), by Application 2024 & 2032
- Figure 28: Europe Instant Hotpot Volume (K), by Application 2024 & 2032
- Figure 29: Europe Instant Hotpot Revenue Share (%), by Application 2024 & 2032
- Figure 30: Europe Instant Hotpot Volume Share (%), by Application 2024 & 2032
- Figure 31: Europe Instant Hotpot Revenue (million), by Types 2024 & 2032
- Figure 32: Europe Instant Hotpot Volume (K), by Types 2024 & 2032
- Figure 33: Europe Instant Hotpot Revenue Share (%), by Types 2024 & 2032
- Figure 34: Europe Instant Hotpot Volume Share (%), by Types 2024 & 2032
- Figure 35: Europe Instant Hotpot Revenue (million), by Country 2024 & 2032
- Figure 36: Europe Instant Hotpot Volume (K), by Country 2024 & 2032
- Figure 37: Europe Instant Hotpot Revenue Share (%), by Country 2024 & 2032
- Figure 38: Europe Instant Hotpot Volume Share (%), by Country 2024 & 2032
- Figure 39: Middle East & Africa Instant Hotpot Revenue (million), by Application 2024 & 2032
- Figure 40: Middle East & Africa Instant Hotpot Volume (K), by Application 2024 & 2032
- Figure 41: Middle East & Africa Instant Hotpot Revenue Share (%), by Application 2024 & 2032
- Figure 42: Middle East & Africa Instant Hotpot Volume Share (%), by Application 2024 & 2032
- Figure 43: Middle East & Africa Instant Hotpot Revenue (million), by Types 2024 & 2032
- Figure 44: Middle East & Africa Instant Hotpot Volume (K), by Types 2024 & 2032
- Figure 45: Middle East & Africa Instant Hotpot Revenue Share (%), by Types 2024 & 2032
- Figure 46: Middle East & Africa Instant Hotpot Volume Share (%), by Types 2024 & 2032
- Figure 47: Middle East & Africa Instant Hotpot Revenue (million), by Country 2024 & 2032
- Figure 48: Middle East & Africa Instant Hotpot Volume (K), by Country 2024 & 2032
- Figure 49: Middle East & Africa Instant Hotpot Revenue Share (%), by Country 2024 & 2032
- Figure 50: Middle East & Africa Instant Hotpot Volume Share (%), by Country 2024 & 2032
- Figure 51: Asia Pacific Instant Hotpot Revenue (million), by Application 2024 & 2032
- Figure 52: Asia Pacific Instant Hotpot Volume (K), by Application 2024 & 2032
- Figure 53: Asia Pacific Instant Hotpot Revenue Share (%), by Application 2024 & 2032
- Figure 54: Asia Pacific Instant Hotpot Volume Share (%), by Application 2024 & 2032
- Figure 55: Asia Pacific Instant Hotpot Revenue (million), by Types 2024 & 2032
- Figure 56: Asia Pacific Instant Hotpot Volume (K), by Types 2024 & 2032
- Figure 57: Asia Pacific Instant Hotpot Revenue Share (%), by Types 2024 & 2032
- Figure 58: Asia Pacific Instant Hotpot Volume Share (%), by Types 2024 & 2032
- Figure 59: Asia Pacific Instant Hotpot Revenue (million), by Country 2024 & 2032
- Figure 60: Asia Pacific Instant Hotpot Volume (K), by Country 2024 & 2032
- Figure 61: Asia Pacific Instant Hotpot Revenue Share (%), by Country 2024 & 2032
- Figure 62: Asia Pacific Instant Hotpot Volume Share (%), by Country 2024 & 2032
List of Tables
- Table 1: Global Instant Hotpot Revenue million Forecast, by Region 2019 & 2032
- Table 2: Global Instant Hotpot Volume K Forecast, by Region 2019 & 2032
- Table 3: Global Instant Hotpot Revenue million Forecast, by Application 2019 & 2032
- Table 4: Global Instant Hotpot Volume K Forecast, by Application 2019 & 2032
- Table 5: Global Instant Hotpot Revenue million Forecast, by Types 2019 & 2032
- Table 6: Global Instant Hotpot Volume K Forecast, by Types 2019 & 2032
- Table 7: Global Instant Hotpot Revenue million Forecast, by Region 2019 & 2032
- Table 8: Global Instant Hotpot Volume K Forecast, by Region 2019 & 2032
- Table 9: Global Instant Hotpot Revenue million Forecast, by Application 2019 & 2032
- Table 10: Global Instant Hotpot Volume K Forecast, by Application 2019 & 2032
- Table 11: Global Instant Hotpot Revenue million Forecast, by Types 2019 & 2032
- Table 12: Global Instant Hotpot Volume K Forecast, by Types 2019 & 2032
- Table 13: Global Instant Hotpot Revenue million Forecast, by Country 2019 & 2032
- Table 14: Global Instant Hotpot Volume K Forecast, by Country 2019 & 2032
- Table 15: United States Instant Hotpot Revenue (million) Forecast, by Application 2019 & 2032
- Table 16: United States Instant Hotpot Volume (K) Forecast, by Application 2019 & 2032
- Table 17: Canada Instant Hotpot Revenue (million) Forecast, by Application 2019 & 2032
- Table 18: Canada Instant Hotpot Volume (K) Forecast, by Application 2019 & 2032
- Table 19: Mexico Instant Hotpot Revenue (million) Forecast, by Application 2019 & 2032
- Table 20: Mexico Instant Hotpot Volume (K) Forecast, by Application 2019 & 2032
- Table 21: Global Instant Hotpot Revenue million Forecast, by Application 2019 & 2032
- Table 22: Global Instant Hotpot Volume K Forecast, by Application 2019 & 2032
- Table 23: Global Instant Hotpot Revenue million Forecast, by Types 2019 & 2032
- Table 24: Global Instant Hotpot Volume K Forecast, by Types 2019 & 2032
- Table 25: Global Instant Hotpot Revenue million Forecast, by Country 2019 & 2032
- Table 26: Global Instant Hotpot Volume K Forecast, by Country 2019 & 2032
- Table 27: Brazil Instant Hotpot Revenue (million) Forecast, by Application 2019 & 2032
- Table 28: Brazil Instant Hotpot Volume (K) Forecast, by Application 2019 & 2032
- Table 29: Argentina Instant Hotpot Revenue (million) Forecast, by Application 2019 & 2032
- Table 30: Argentina Instant Hotpot Volume (K) Forecast, by Application 2019 & 2032
- Table 31: Rest of South America Instant Hotpot Revenue (million) Forecast, by Application 2019 & 2032
- Table 32: Rest of South America Instant Hotpot Volume (K) Forecast, by Application 2019 & 2032
- Table 33: Global Instant Hotpot Revenue million Forecast, by Application 2019 & 2032
- Table 34: Global Instant Hotpot Volume K Forecast, by Application 2019 & 2032
- Table 35: Global Instant Hotpot Revenue million Forecast, by Types 2019 & 2032
- Table 36: Global Instant Hotpot Volume K Forecast, by Types 2019 & 2032
- Table 37: Global Instant Hotpot Revenue million Forecast, by Country 2019 & 2032
- Table 38: Global Instant Hotpot Volume K Forecast, by Country 2019 & 2032
- Table 39: United Kingdom Instant Hotpot Revenue (million) Forecast, by Application 2019 & 2032
- Table 40: United Kingdom Instant Hotpot Volume (K) Forecast, by Application 2019 & 2032
- Table 41: Germany Instant Hotpot Revenue (million) Forecast, by Application 2019 & 2032
- Table 42: Germany Instant Hotpot Volume (K) Forecast, by Application 2019 & 2032
- Table 43: France Instant Hotpot Revenue (million) Forecast, by Application 2019 & 2032
- Table 44: France Instant Hotpot Volume (K) Forecast, by Application 2019 & 2032
- Table 45: Italy Instant Hotpot Revenue (million) Forecast, by Application 2019 & 2032
- Table 46: Italy Instant Hotpot Volume (K) Forecast, by Application 2019 & 2032
- Table 47: Spain Instant Hotpot Revenue (million) Forecast, by Application 2019 & 2032
- Table 48: Spain Instant Hotpot Volume (K) Forecast, by Application 2019 & 2032
- Table 49: Russia Instant Hotpot Revenue (million) Forecast, by Application 2019 & 2032
- Table 50: Russia Instant Hotpot Volume (K) Forecast, by Application 2019 & 2032
- Table 51: Benelux Instant Hotpot Revenue (million) Forecast, by Application 2019 & 2032
- Table 52: Benelux Instant Hotpot Volume (K) Forecast, by Application 2019 & 2032
- Table 53: Nordics Instant Hotpot Revenue (million) Forecast, by Application 2019 & 2032
- Table 54: Nordics Instant Hotpot Volume (K) Forecast, by Application 2019 & 2032
- Table 55: Rest of Europe Instant Hotpot Revenue (million) Forecast, by Application 2019 & 2032
- Table 56: Rest of Europe Instant Hotpot Volume (K) Forecast, by Application 2019 & 2032
- Table 57: Global Instant Hotpot Revenue million Forecast, by Application 2019 & 2032
- Table 58: Global Instant Hotpot Volume K Forecast, by Application 2019 & 2032
- Table 59: Global Instant Hotpot Revenue million Forecast, by Types 2019 & 2032
- Table 60: Global Instant Hotpot Volume K Forecast, by Types 2019 & 2032
- Table 61: Global Instant Hotpot Revenue million Forecast, by Country 2019 & 2032
- Table 62: Global Instant Hotpot Volume K Forecast, by Country 2019 & 2032
- Table 63: Turkey Instant Hotpot Revenue (million) Forecast, by Application 2019 & 2032
- Table 64: Turkey Instant Hotpot Volume (K) Forecast, by Application 2019 & 2032
- Table 65: Israel Instant Hotpot Revenue (million) Forecast, by Application 2019 & 2032
- Table 66: Israel Instant Hotpot Volume (K) Forecast, by Application 2019 & 2032
- Table 67: GCC Instant Hotpot Revenue (million) Forecast, by Application 2019 & 2032
- Table 68: GCC Instant Hotpot Volume (K) Forecast, by Application 2019 & 2032
- Table 69: North Africa Instant Hotpot Revenue (million) Forecast, by Application 2019 & 2032
- Table 70: North Africa Instant Hotpot Volume (K) Forecast, by Application 2019 & 2032
- Table 71: South Africa Instant Hotpot Revenue (million) Forecast, by Application 2019 & 2032
- Table 72: South Africa Instant Hotpot Volume (K) Forecast, by Application 2019 & 2032
- Table 73: Rest of Middle East & Africa Instant Hotpot Revenue (million) Forecast, by Application 2019 & 2032
- Table 74: Rest of Middle East & Africa Instant Hotpot Volume (K) Forecast, by Application 2019 & 2032
- Table 75: Global Instant Hotpot Revenue million Forecast, by Application 2019 & 2032
- Table 76: Global Instant Hotpot Volume K Forecast, by Application 2019 & 2032
- Table 77: Global Instant Hotpot Revenue million Forecast, by Types 2019 & 2032
- Table 78: Global Instant Hotpot Volume K Forecast, by Types 2019 & 2032
- Table 79: Global Instant Hotpot Revenue million Forecast, by Country 2019 & 2032
- Table 80: Global Instant Hotpot Volume K Forecast, by Country 2019 & 2032
- Table 81: China Instant Hotpot Revenue (million) Forecast, by Application 2019 & 2032
- Table 82: China Instant Hotpot Volume (K) Forecast, by Application 2019 & 2032
- Table 83: India Instant Hotpot Revenue (million) Forecast, by Application 2019 & 2032
- Table 84: India Instant Hotpot Volume (K) Forecast, by Application 2019 & 2032
- Table 85: Japan Instant Hotpot Revenue (million) Forecast, by Application 2019 & 2032
- Table 86: Japan Instant Hotpot Volume (K) Forecast, by Application 2019 & 2032
- Table 87: South Korea Instant Hotpot Revenue (million) Forecast, by Application 2019 & 2032
- Table 88: South Korea Instant Hotpot Volume (K) Forecast, by Application 2019 & 2032
- Table 89: ASEAN Instant Hotpot Revenue (million) Forecast, by Application 2019 & 2032
- Table 90: ASEAN Instant Hotpot Volume (K) Forecast, by Application 2019 & 2032
- Table 91: Oceania Instant Hotpot Revenue (million) Forecast, by Application 2019 & 2032
- Table 92: Oceania Instant Hotpot Volume (K) Forecast, by Application 2019 & 2032
- Table 93: Rest of Asia Pacific Instant Hotpot Revenue (million) Forecast, by Application 2019 & 2032
- Table 94: Rest of Asia Pacific Instant Hotpot Volume (K) Forecast, by Application 2019 & 2032
Frequently Asked Questions
1. What is the projected Compound Annual Growth Rate (CAGR) of the Instant Hotpot?
The projected CAGR is approximately XX%.
2. Which companies are prominent players in the Instant Hotpot?
Key companies in the market include Haidilao, Morals Village, Xiaolongkan, Rong Li Ji, Zihaiguo, Ji Xiangju.
3. What are the main segments of the Instant Hotpot?
The market segments include Application, Types.
4. Can you provide details about the market size?
The market size is estimated to be USD XXX million as of 2022.
5. What are some drivers contributing to market growth?
N/A
6. What are the notable trends driving market growth?
N/A
7. Are there any restraints impacting market growth?
N/A
8. Can you provide examples of recent developments in the market?
N/A
9. What pricing options are available for accessing the report?
Pricing options include single-user, multi-user, and enterprise licenses priced at USD 3350.00, USD 5025.00, and USD 6700.00 respectively.
10. Is the market size provided in terms of value or volume?
The market size is provided in terms of value, measured in million and volume, measured in K.
11. Are there any specific market keywords associated with the report?
Yes, the market keyword associated with the report is "Instant Hotpot," which aids in identifying and referencing the specific market segment covered.
12. How do I determine which pricing option suits my needs best?
The pricing options vary based on user requirements and access needs. Individual users may opt for single-user licenses, while businesses requiring broader access may choose multi-user or enterprise licenses for cost-effective access to the report.
13. Are there any additional resources or data provided in the Instant Hotpot report?
While the report offers comprehensive insights, it's advisable to review the specific contents or supplementary materials provided to ascertain if additional resources or data are available.
14. How can I stay updated on further developments or reports in the Instant Hotpot?
To stay informed about further developments, trends, and reports in the Instant Hotpot, consider subscribing to industry newsletters, following relevant companies and organizations, or regularly checking reputable industry news sources and publications.
Methodology
Step 1 - Identification of Relevant Samples Size from Population Database


Step 2 - Approaches for Defining Global Market Size (Value, Volume* & Price*)

Note*: In applicable scenarios
Step 3 - Data Sources
Primary Research
- Web Analytics
- Survey Reports
- Research Institute
- Latest Research Reports
- Opinion Leaders
Secondary Research
- Annual Reports
- White Paper
- Latest Press Release
- Industry Association
- Paid Database
- Investor Presentations

Step 4 - Data Triangulation
Involves using different sources of information in order to increase the validity of a study
These sources are likely to be stakeholders in a program - participants, other researchers, program staff, other community members, and so on.
Then we put all data in single framework & apply various statistical tools to find out the dynamic on the market.
During the analysis stage, feedback from the stakeholder groups would be compared to determine areas of agreement as well as areas of divergence


