
Key Insights
The US anti-caking agents market is poised for robust growth, projected to reach a substantial market size. Driven by an increasing demand for processed and convenience foods, the market is witnessing a Compound Annual Growth Rate (CAGR) of 5.23%. Key growth drivers include the expanding food and beverage industry, particularly in segments like bakery products, dairy, and ready-to-eat meals, where anti-caking agents are crucial for maintaining product quality and shelf-life. The cosmetic and personal care sector also presents a significant avenue for growth, with these additives ensuring the free-flowing nature of powders and other formulations. Furthermore, the animal feed industry's need for improved feed pellet integrity and reduced clumping contributes to market expansion. Technological advancements in the production of natural and synthetic anti-caking agents, coupled with a growing consumer preference for cleaner labels, are shaping product innovation and market strategies.
Despite the positive outlook, certain restraints could impact market dynamics. Stringent regulatory frameworks regarding the use and labeling of food additives may pose challenges for manufacturers. Additionally, fluctuating raw material costs for key compounds like calcium, sodium, and magnesium can influence profit margins. However, the inherent need for anti-caking agents across diverse applications, coupled with ongoing research into novel, sustainable, and effective solutions, is expected to outweigh these challenges. Key players like Cargill Incorporated, The Archer Daniels Midland Company, DuPont de Nemours Inc., and BASF SE are actively investing in research and development, and expanding their product portfolios to cater to evolving consumer and industry demands. The market's segmentation by type (Calcium Compounds, Sodium Compounds, Magnesium Compounds, Others) and application (Food and Beverage, Cosmetic and Personal Care, Feed) highlights the broad utility and diverse opportunities within the US anti-caking agents landscape.
US Anti-Caking Agents Industry Report: Market Size, Trends, and Forecast (2019–2033)
Unlock critical insights into the US Anti-Caking Agents Market with this comprehensive report. Covering the period from 2019 to 2033, with a base and estimated year of 2025, this analysis delivers an in-depth examination of market dynamics, growth trends, regional dominance, product landscape, key drivers, challenges, emerging opportunities, growth accelerators, and the competitive landscape. Gain a competitive edge through detailed quantitative and qualitative analysis, essential for stakeholders in the food additives, industrial minerals, and specialty chemicals sectors. This report is your definitive guide to understanding the forces shaping the anti-caking solutions market in the United States.
US Anti-Caking Agents Industry Market Dynamics & Structure
The US Anti-Caking Agents market exhibits a moderate to high level of concentration, with a few key players dominating a significant portion of the market share. Technological innovation plays a pivotal role, driven by the demand for improved product quality, extended shelf life, and enhanced processing efficiency in various end-user industries. Regulatory frameworks, primarily governed by the FDA, establish stringent guidelines for the use and safety of anti-caking agents, influencing product development and market entry. Competitive product substitutes, such as improved processing techniques and alternative ingredient formulations, pose a constant challenge, necessitating continuous innovation from anti-caking agent manufacturers. End-user demographics are diverse, spanning the food and beverage, cosmetic and personal care, and animal feed industries, each with unique requirements and consumption patterns. Mergers and acquisitions (M&A) trends are active, indicating a consolidation phase where larger players acquire innovative smaller companies or expand their geographical reach.
- Market Concentration: Dominated by key players, but with room for niche specialization.
- Technological Innovation Drivers: Enhanced particle flow, moisture control, and natural ingredient demand.
- Regulatory Frameworks: Strict FDA oversight ensuring safety and efficacy.
- Competitive Product Substitutes: Process optimization, alternative formulations, and natural alternatives.
- End-User Demographics: Diverse across food, cosmetics, and feed sectors.
- M&A Trends: Strategic acquisitions for portfolio expansion and market penetration.
US Anti-Caking Agents Industry Growth Trends & Insights
The US Anti-Caking Agents market is poised for steady growth, fueled by an escalating demand for processed and packaged foods, coupled with the rising awareness of product quality and shelf-life preservation. The market size is projected to witness a Compound Annual Growth Rate (CAGR) of approximately 3.5% during the forecast period of 2025–2033, reaching an estimated $XXX million in 2025 and expanding to $YYY million by 2033. Adoption rates are high across major food and beverage applications, with a growing penetration in specialized segments like dairy and baked goods. Technological disruptions are primarily focused on developing more efficient and sustainable anti-caking solutions. For instance, advancements in silica-based compounds and natural alternatives are gaining traction. Consumer behavior shifts towards convenience foods and visually appealing products directly correlate with the need for effective anti-caking agents that maintain product integrity. The expanding e-commerce landscape for food products also indirectly boosts the demand for robust packaging solutions, which often rely on anti-caking agents to prevent clumping during transit and storage. Furthermore, the growing interest in clean-label products is prompting manufacturers to explore naturally derived anti-caking agents, a trend that is expected to significantly influence market dynamics in the coming years. The increasing sophistication of food processing machinery also necessitates precise ingredient handling, where anti-caking agents play a crucial role in ensuring smooth operations and consistent product output. This synergistic relationship between technological advancements in processing and ingredient formulation underscores the sustained growth trajectory of the anti-caking agents market.
Dominant Regions, Countries, or Segments in US Anti-Caking Agents Industry
Within the US Anti-Caking Agents industry, the Food and Beverage segment unequivocally dominates market growth, driven by its expansive applications and robust consumer demand. This dominance is further amplified by key sub-segments like Bakery Products and Dairy Products, which collectively account for a substantial market share. The inherent properties of these products, such as their susceptibility to moisture absorption and particle aggregation, necessitate the consistent use of anti-caking agents to maintain texture, flowability, and overall product quality. For instance, in bakery products, anti-caking agents ensure that flour and powdered mixes remain free-flowing, preventing caking during storage and facilitating easier processing. In dairy products, they are crucial for powdered milk, cheese powders, and other dry formulations to prevent clumping, ensuring solubility and a smooth consumer experience.
The Calcium Compounds segment, under the broader Type classification, also exhibits significant strength within the US market. Calcium silicates and phosphates are widely utilized due to their cost-effectiveness, excellent anti-caking properties, and GRAS (Generally Recognized As Safe) status by regulatory bodies like the FDA. Their versatility in applications ranging from processed foods to pharmaceuticals contributes to their market leadership.
The economic landscape of the United States, characterized by a high disposable income and a preference for convenience, further fuels the demand for processed food products, thus bolstering the anti-caking agents market. Infrastructure development supporting efficient supply chains for both raw materials and finished goods also plays a crucial role in ensuring the consistent availability and delivery of anti-caking agents across the nation. Government policies promoting food safety and quality standards indirectly encourage the adoption of these essential additives. The sheer volume of production and consumption within the food and beverage sector, coupled with the inherent need for anti-caking functionalities in a wide array of products, solidifies its position as the dominant segment driving the growth and evolution of the US Anti-Caking Agents industry. The consistent innovation within the Food and Beverage sector, with new product formulations and processing techniques, ensures a perpetual demand for advanced and effective anti-caking solutions.
US Anti-Caking Agents Industry Product Landscape
The US Anti-Caking Agents product landscape is characterized by a diverse range of chemical compounds engineered to prevent particle agglomeration and enhance flowability. Key product innovations focus on improving efficacy at lower dosages, offering natural and organic alternatives, and developing specialized formulations for niche applications. Performance metrics revolve around moisture absorption capacity, particle size distribution, inertness, and regulatory compliance. Calcium silicates and phosphates remain prevalent due to their efficacy and cost-effectiveness, while amorphous silica and magnesium carbonate offer alternatives with distinct properties. The unique selling propositions of many products lie in their ability to maintain product integrity during storage, processing, and transportation, ensuring a consistent consumer experience. Technological advancements are also directed towards creating biodegradable and sustainable anti-caking solutions.
Key Drivers, Barriers & Challenges in US Anti-Caking Agents Industry
Key Drivers:
- Growing Demand for Processed Foods: The increasing consumption of ready-to-eat meals, convenience foods, and snack products directly drives the need for anti-caking agents to maintain product quality and shelf-life.
- Advancements in Food Processing Technology: Modern food processing techniques often involve fine powders and hygroscopic ingredients, necessitating effective anti-caking solutions for smooth operations and consistent product output.
- Consumer Preference for Free-Flowing Products: Consumers expect powdered products like spices, sugar, and dairy powders to be free from clumps, ensuring ease of use and optimal performance.
- Strict Quality Control Standards: The food and pharmaceutical industries adhere to stringent quality control measures, where anti-caking agents play a vital role in maintaining product consistency and preventing spoilage.
Barriers & Challenges:
- Regulatory Hurdles and Compliance Costs: Navigating evolving food additive regulations and ensuring compliance with safety standards can be complex and costly for manufacturers.
- Price Volatility of Raw Materials: Fluctuations in the cost of key raw materials like silica, calcium carbonate, and magnesium compounds can impact profit margins.
- Competition from Alternative Solutions: Innovations in processing techniques and the development of alternative ingredients can pose a threat to the traditional anti-caking agents market.
- Consumer Perception of Additives: Growing consumer interest in "clean label" products and a potential apprehension towards chemical additives can create market resistance for certain anti-caking agents.
- Supply Chain Disruptions: Geopolitical events, natural disasters, and logistical challenges can disrupt the supply chain for both raw materials and finished products, impacting availability and pricing.
Emerging Opportunities in US Anti-Caking Agents Industry
Emerging opportunities in the US Anti-Caking Agents industry lie in the development of natural and organic anti-caking agents derived from plant-based sources or mineral derivatives, catering to the growing consumer demand for clean-label products. The expanding pharmaceutical and nutraceutical sectors present a significant untapped market, where precise powder flow is critical for tablet manufacturing and supplement formulation. Innovations in specialty anti-caking agents tailored for specific applications, such as instant beverages or confectionery, also offer promising avenues. Furthermore, the increasing focus on sustainable and eco-friendly solutions presents an opportunity for manufacturers to develop biodegradable or recyclable anti-caking agents, aligning with environmental consciousness. The growth of the pet food industry, particularly premium and specialized formulations, also represents a fertile ground for the application of advanced anti-caking technologies to ensure palatability and ease of use.
Growth Accelerators in the US Anti-Caking Agents Industry Industry
The long-term growth of the US Anti-Caking Agents industry is being significantly accelerated by advancements in nanotechnology, leading to the development of more efficient and highly dispersed anti-caking agents with superior performance characteristics at lower concentrations. Strategic partnerships and collaborations between anti-caking agent manufacturers and food/pharmaceutical companies are also driving innovation and market penetration by tailoring solutions to specific product needs. The increasing adoption of automation and digitalization in manufacturing processes is further streamlining production and supply chains, reducing costs and improving efficiency. Moreover, the growing emphasis on health and wellness trends, which often translate to a demand for powdered dietary supplements and functional foods, serves as a substantial growth catalyst, requiring reliable anti-caking solutions to ensure product integrity and consumer satisfaction.
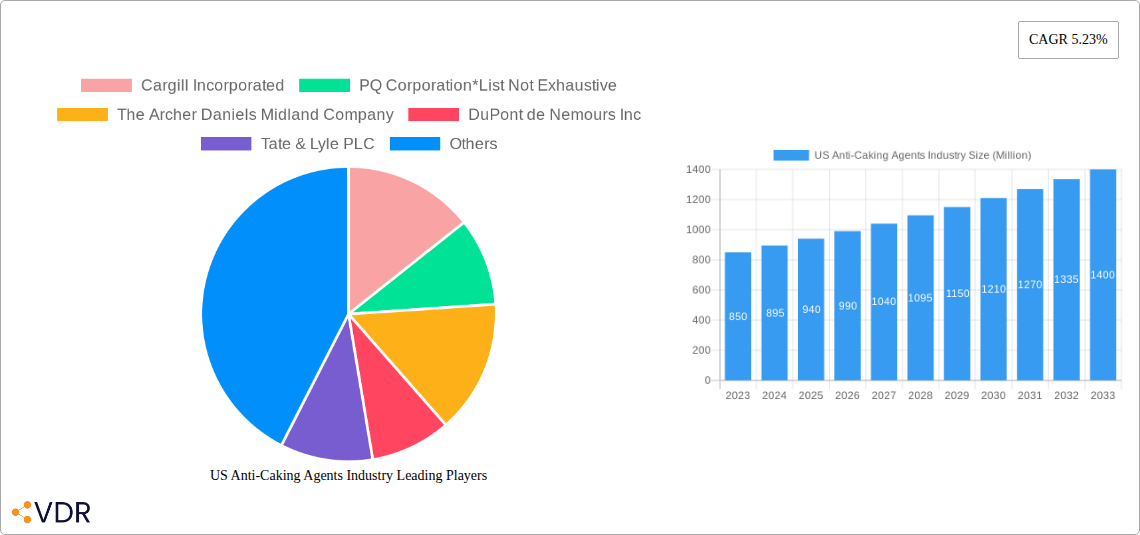
Key Players Shaping the US Anti-Caking Agents Industry Market
- Cargill Incorporated
- PQ Corporation
- The Archer Daniels Midland Company
- DuPont de Nemours Inc
- Tate & Lyle PLC
- BASF SE
- Imac Inc
- Agropur Ingredients
Notable Milestones in US Anti-Caking Agents Industry Sector
- 2021: Cargill acquired Penford Products, a leading provider of anti-caking agents for the food industry, significantly expanding its portfolio and market reach.
- 2022: BASF launched a new line of organic anti-caking agents for the food and beverage industry, responding to the growing demand for natural and clean-label ingredients.
- 2023: PQ Corporation announced a joint venture with a Chinese company to expand its production of anti-caking agents in Asia, indicating a strategic move towards global market expansion and diversified manufacturing capabilities.
In-Depth US Anti-Caking Agents Industry Market Outlook
The future outlook for the US Anti-Caking Agents industry is exceptionally positive, characterized by sustained demand and significant innovation. Growth accelerators such as the relentless pursuit of enhanced product quality and consumer experience in the food and beverage sector will continue to be primary drivers. The industry's capacity to adapt to evolving consumer preferences, particularly towards natural and sustainable ingredients, will be critical for future success. Strategic opportunities lie in expanding applications into emerging markets like specialized pharmaceuticals and advanced nutraceuticals, where precision and reliability are paramount. Further advancements in material science and eco-friendly production methods will solidify the market's trajectory, ensuring its vital role in supporting a diverse range of industries.
US Anti-Caking Agents Industry Segmentation
-
1. Type
- 1.1. Calcium Compounds
- 1.2. Sodium Compounds
- 1.3. Magnesium Compounds
- 1.4. Others
-
2. Application
-
2.1. Food and Beverage
- 2.1.1. Bakery Products
- 2.1.2. Dairy Products
- 2.1.3. Soups & Sauces
- 2.1.4. Beverages
- 2.1.5. Others
- 2.2. Cosmetic and Personal Care
- 2.3. Feed
-
2.1. Food and Beverage
US Anti-Caking Agents Industry Segmentation By Geography
-
1. North America
- 1.1. United States
- 1.2. Canada
- 1.3. Mexico
-
2. South America
- 2.1. Brazil
- 2.2. Argentina
- 2.3. Rest of South America
-
3. Europe
- 3.1. United Kingdom
- 3.2. Germany
- 3.3. France
- 3.4. Italy
- 3.5. Spain
- 3.6. Russia
- 3.7. Benelux
- 3.8. Nordics
- 3.9. Rest of Europe
-
4. Middle East & Africa
- 4.1. Turkey
- 4.2. Israel
- 4.3. GCC
- 4.4. North Africa
- 4.5. South Africa
- 4.6. Rest of Middle East & Africa
-
5. Asia Pacific
- 5.1. China
- 5.2. India
- 5.3. Japan
- 5.4. South Korea
- 5.5. ASEAN
- 5.6. Oceania
- 5.7. Rest of Asia Pacific
US Anti-Caking Agents Industry REPORT HIGHLIGHTS
| Aspects | Details |
|---|---|
| Study Period | 2019-2033 |
| Base Year | 2024 |
| Estimated Year | 2025 |
| Forecast Period | 2025-2033 |
| Historical Period | 2019-2024 |
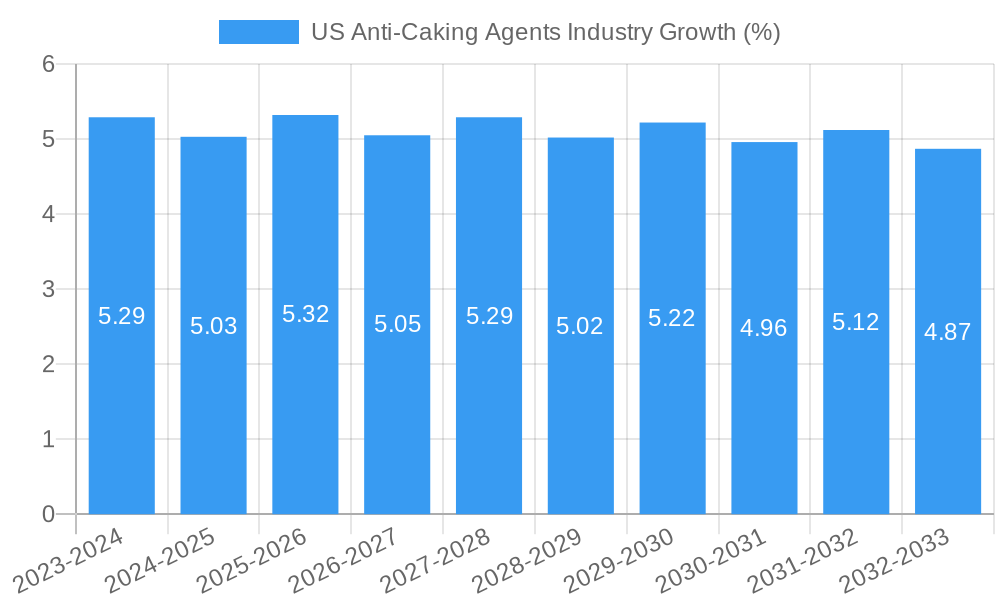
| Growth Rate | CAGR of 5.23% from 2019-2033 |
| Segmentation |
|
Table of Contents
- 1. Introduction
- 1.1. Research Scope
- 1.2. Market Segmentation
- 1.3. Research Methodology
- 1.4. Definitions and Assumptions
- 2. Executive Summary
- 2.1. Introduction
- 3. Market Dynamics
- 3.1. Introduction
- 3.2. Market Drivers
- 3.2.1. Wide Applications and Functionality; Demand For Gluten-Free Products
- 3.3. Market Restrains
- 3.3.1. Easy Availability of Economically Feasible Alternatives
- 3.4. Market Trends
- 3.4.1. Calcium Compounds Holds a Significant Share
- 4. Market Factor Analysis
- 4.1. Porters Five Forces
- 4.2. Supply/Value Chain
- 4.3. PESTEL analysis
- 4.4. Market Entropy
- 4.5. Patent/Trademark Analysis
- 5. Global US Anti-Caking Agents Industry Analysis, Insights and Forecast, 2019-2031
- 5.1. Market Analysis, Insights and Forecast - by Type
- 5.1.1. Calcium Compounds
- 5.1.2. Sodium Compounds
- 5.1.3. Magnesium Compounds
- 5.1.4. Others
- 5.2. Market Analysis, Insights and Forecast - by Application
- 5.2.1. Food and Beverage
- 5.2.1.1. Bakery Products
- 5.2.1.2. Dairy Products
- 5.2.1.3. Soups & Sauces
- 5.2.1.4. Beverages
- 5.2.1.5. Others
- 5.2.2. Cosmetic and Personal Care
- 5.2.3. Feed
- 5.2.1. Food and Beverage
- 5.3. Market Analysis, Insights and Forecast - by Region
- 5.3.1. North America
- 5.3.2. South America
- 5.3.3. Europe
- 5.3.4. Middle East & Africa
- 5.3.5. Asia Pacific
- 5.1. Market Analysis, Insights and Forecast - by Type
- 6. North America US Anti-Caking Agents Industry Analysis, Insights and Forecast, 2019-2031
- 6.1. Market Analysis, Insights and Forecast - by Type
- 6.1.1. Calcium Compounds
- 6.1.2. Sodium Compounds
- 6.1.3. Magnesium Compounds
- 6.1.4. Others
- 6.2. Market Analysis, Insights and Forecast - by Application
- 6.2.1. Food and Beverage
- 6.2.1.1. Bakery Products
- 6.2.1.2. Dairy Products
- 6.2.1.3. Soups & Sauces
- 6.2.1.4. Beverages
- 6.2.1.5. Others
- 6.2.2. Cosmetic and Personal Care
- 6.2.3. Feed
- 6.2.1. Food and Beverage
- 6.1. Market Analysis, Insights and Forecast - by Type
- 7. South America US Anti-Caking Agents Industry Analysis, Insights and Forecast, 2019-2031
- 7.1. Market Analysis, Insights and Forecast - by Type
- 7.1.1. Calcium Compounds
- 7.1.2. Sodium Compounds
- 7.1.3. Magnesium Compounds
- 7.1.4. Others
- 7.2. Market Analysis, Insights and Forecast - by Application
- 7.2.1. Food and Beverage
- 7.2.1.1. Bakery Products
- 7.2.1.2. Dairy Products
- 7.2.1.3. Soups & Sauces
- 7.2.1.4. Beverages
- 7.2.1.5. Others
- 7.2.2. Cosmetic and Personal Care
- 7.2.3. Feed
- 7.2.1. Food and Beverage
- 7.1. Market Analysis, Insights and Forecast - by Type
- 8. Europe US Anti-Caking Agents Industry Analysis, Insights and Forecast, 2019-2031
- 8.1. Market Analysis, Insights and Forecast - by Type
- 8.1.1. Calcium Compounds
- 8.1.2. Sodium Compounds
- 8.1.3. Magnesium Compounds
- 8.1.4. Others
- 8.2. Market Analysis, Insights and Forecast - by Application
- 8.2.1. Food and Beverage
- 8.2.1.1. Bakery Products
- 8.2.1.2. Dairy Products
- 8.2.1.3. Soups & Sauces
- 8.2.1.4. Beverages
- 8.2.1.5. Others
- 8.2.2. Cosmetic and Personal Care
- 8.2.3. Feed
- 8.2.1. Food and Beverage
- 8.1. Market Analysis, Insights and Forecast - by Type
- 9. Middle East & Africa US Anti-Caking Agents Industry Analysis, Insights and Forecast, 2019-2031
- 9.1. Market Analysis, Insights and Forecast - by Type
- 9.1.1. Calcium Compounds
- 9.1.2. Sodium Compounds
- 9.1.3. Magnesium Compounds
- 9.1.4. Others
- 9.2. Market Analysis, Insights and Forecast - by Application
- 9.2.1. Food and Beverage
- 9.2.1.1. Bakery Products
- 9.2.1.2. Dairy Products
- 9.2.1.3. Soups & Sauces
- 9.2.1.4. Beverages
- 9.2.1.5. Others
- 9.2.2. Cosmetic and Personal Care
- 9.2.3. Feed
- 9.2.1. Food and Beverage
- 9.1. Market Analysis, Insights and Forecast - by Type
- 10. Asia Pacific US Anti-Caking Agents Industry Analysis, Insights and Forecast, 2019-2031
- 10.1. Market Analysis, Insights and Forecast - by Type
- 10.1.1. Calcium Compounds
- 10.1.2. Sodium Compounds
- 10.1.3. Magnesium Compounds
- 10.1.4. Others
- 10.2. Market Analysis, Insights and Forecast - by Application
- 10.2.1. Food and Beverage
- 10.2.1.1. Bakery Products
- 10.2.1.2. Dairy Products
- 10.2.1.3. Soups & Sauces
- 10.2.1.4. Beverages
- 10.2.1.5. Others
- 10.2.2. Cosmetic and Personal Care
- 10.2.3. Feed
- 10.2.1. Food and Beverage
- 10.1. Market Analysis, Insights and Forecast - by Type
- 11. Northeast US Anti-Caking Agents Industry Analysis, Insights and Forecast, 2019-2031
- 12. Southeast US Anti-Caking Agents Industry Analysis, Insights and Forecast, 2019-2031
- 13. Midwest US Anti-Caking Agents Industry Analysis, Insights and Forecast, 2019-2031
- 14. Southwest US Anti-Caking Agents Industry Analysis, Insights and Forecast, 2019-2031
- 15. West US Anti-Caking Agents Industry Analysis, Insights and Forecast, 2019-2031
- 16. Competitive Analysis
- 16.1. Global Market Share Analysis 2024
- 16.2. Company Profiles
- 16.2.1 Cargill Incorporated
- 16.2.1.1. Overview
- 16.2.1.2. Products
- 16.2.1.3. SWOT Analysis
- 16.2.1.4. Recent Developments
- 16.2.1.5. Financials (Based on Availability)
- 16.2.2 PQ Corporation*List Not Exhaustive
- 16.2.2.1. Overview
- 16.2.2.2. Products
- 16.2.2.3. SWOT Analysis
- 16.2.2.4. Recent Developments
- 16.2.2.5. Financials (Based on Availability)
- 16.2.3 The Archer Daniels Midland Company
- 16.2.3.1. Overview
- 16.2.3.2. Products
- 16.2.3.3. SWOT Analysis
- 16.2.3.4. Recent Developments
- 16.2.3.5. Financials (Based on Availability)
- 16.2.4 DuPont de Nemours Inc
- 16.2.4.1. Overview
- 16.2.4.2. Products
- 16.2.4.3. SWOT Analysis
- 16.2.4.4. Recent Developments
- 16.2.4.5. Financials (Based on Availability)
- 16.2.5 Tate & Lyle PLC
- 16.2.5.1. Overview
- 16.2.5.2. Products
- 16.2.5.3. SWOT Analysis
- 16.2.5.4. Recent Developments
- 16.2.5.5. Financials (Based on Availability)
- 16.2.6 BASF SE
- 16.2.6.1. Overview
- 16.2.6.2. Products
- 16.2.6.3. SWOT Analysis
- 16.2.6.4. Recent Developments
- 16.2.6.5. Financials (Based on Availability)
- 16.2.7 Imac Inc
- 16.2.7.1. Overview
- 16.2.7.2. Products
- 16.2.7.3. SWOT Analysis
- 16.2.7.4. Recent Developments
- 16.2.7.5. Financials (Based on Availability)
- 16.2.8 Agropur Ingredients
- 16.2.8.1. Overview
- 16.2.8.2. Products
- 16.2.8.3. SWOT Analysis
- 16.2.8.4. Recent Developments
- 16.2.8.5. Financials (Based on Availability)
- 16.2.1 Cargill Incorporated
List of Figures
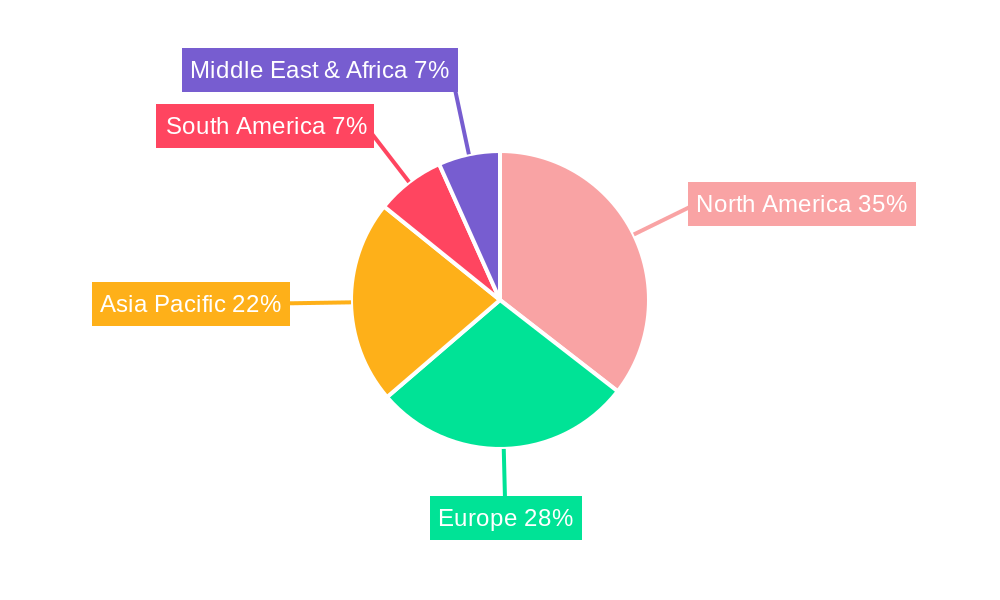
- Figure 1: Global US Anti-Caking Agents Industry Revenue Breakdown (Million, %) by Region 2024 & 2032
- Figure 2: United states US Anti-Caking Agents Industry Revenue (Million), by Country 2024 & 2032
- Figure 3: United states US Anti-Caking Agents Industry Revenue Share (%), by Country 2024 & 2032
- Figure 4: North America US Anti-Caking Agents Industry Revenue (Million), by Type 2024 & 2032
- Figure 5: North America US Anti-Caking Agents Industry Revenue Share (%), by Type 2024 & 2032
- Figure 6: North America US Anti-Caking Agents Industry Revenue (Million), by Application 2024 & 2032
- Figure 7: North America US Anti-Caking Agents Industry Revenue Share (%), by Application 2024 & 2032
- Figure 8: North America US Anti-Caking Agents Industry Revenue (Million), by Country 2024 & 2032
- Figure 9: North America US Anti-Caking Agents Industry Revenue Share (%), by Country 2024 & 2032
- Figure 10: South America US Anti-Caking Agents Industry Revenue (Million), by Type 2024 & 2032
- Figure 11: South America US Anti-Caking Agents Industry Revenue Share (%), by Type 2024 & 2032
- Figure 12: South America US Anti-Caking Agents Industry Revenue (Million), by Application 2024 & 2032
- Figure 13: South America US Anti-Caking Agents Industry Revenue Share (%), by Application 2024 & 2032
- Figure 14: South America US Anti-Caking Agents Industry Revenue (Million), by Country 2024 & 2032
- Figure 15: South America US Anti-Caking Agents Industry Revenue Share (%), by Country 2024 & 2032
- Figure 16: Europe US Anti-Caking Agents Industry Revenue (Million), by Type 2024 & 2032
- Figure 17: Europe US Anti-Caking Agents Industry Revenue Share (%), by Type 2024 & 2032
- Figure 18: Europe US Anti-Caking Agents Industry Revenue (Million), by Application 2024 & 2032
- Figure 19: Europe US Anti-Caking Agents Industry Revenue Share (%), by Application 2024 & 2032
- Figure 20: Europe US Anti-Caking Agents Industry Revenue (Million), by Country 2024 & 2032
- Figure 21: Europe US Anti-Caking Agents Industry Revenue Share (%), by Country 2024 & 2032
- Figure 22: Middle East & Africa US Anti-Caking Agents Industry Revenue (Million), by Type 2024 & 2032
- Figure 23: Middle East & Africa US Anti-Caking Agents Industry Revenue Share (%), by Type 2024 & 2032
- Figure 24: Middle East & Africa US Anti-Caking Agents Industry Revenue (Million), by Application 2024 & 2032
- Figure 25: Middle East & Africa US Anti-Caking Agents Industry Revenue Share (%), by Application 2024 & 2032
- Figure 26: Middle East & Africa US Anti-Caking Agents Industry Revenue (Million), by Country 2024 & 2032
- Figure 27: Middle East & Africa US Anti-Caking Agents Industry Revenue Share (%), by Country 2024 & 2032
- Figure 28: Asia Pacific US Anti-Caking Agents Industry Revenue (Million), by Type 2024 & 2032
- Figure 29: Asia Pacific US Anti-Caking Agents Industry Revenue Share (%), by Type 2024 & 2032
- Figure 30: Asia Pacific US Anti-Caking Agents Industry Revenue (Million), by Application 2024 & 2032
- Figure 31: Asia Pacific US Anti-Caking Agents Industry Revenue Share (%), by Application 2024 & 2032
- Figure 32: Asia Pacific US Anti-Caking Agents Industry Revenue (Million), by Country 2024 & 2032
- Figure 33: Asia Pacific US Anti-Caking Agents Industry Revenue Share (%), by Country 2024 & 2032
List of Tables
- Table 1: Global US Anti-Caking Agents Industry Revenue Million Forecast, by Region 2019 & 2032
- Table 2: Global US Anti-Caking Agents Industry Revenue Million Forecast, by Type 2019 & 2032
- Table 3: Global US Anti-Caking Agents Industry Revenue Million Forecast, by Application 2019 & 2032
- Table 4: Global US Anti-Caking Agents Industry Revenue Million Forecast, by Region 2019 & 2032
- Table 5: Global US Anti-Caking Agents Industry Revenue Million Forecast, by Country 2019 & 2032
- Table 6: Northeast US Anti-Caking Agents Industry Revenue (Million) Forecast, by Application 2019 & 2032
- Table 7: Southeast US Anti-Caking Agents Industry Revenue (Million) Forecast, by Application 2019 & 2032
- Table 8: Midwest US Anti-Caking Agents Industry Revenue (Million) Forecast, by Application 2019 & 2032
- Table 9: Southwest US Anti-Caking Agents Industry Revenue (Million) Forecast, by Application 2019 & 2032
- Table 10: West US Anti-Caking Agents Industry Revenue (Million) Forecast, by Application 2019 & 2032
- Table 11: Global US Anti-Caking Agents Industry Revenue Million Forecast, by Type 2019 & 2032
- Table 12: Global US Anti-Caking Agents Industry Revenue Million Forecast, by Application 2019 & 2032
- Table 13: Global US Anti-Caking Agents Industry Revenue Million Forecast, by Country 2019 & 2032
- Table 14: United States US Anti-Caking Agents Industry Revenue (Million) Forecast, by Application 2019 & 2032
- Table 15: Canada US Anti-Caking Agents Industry Revenue (Million) Forecast, by Application 2019 & 2032
- Table 16: Mexico US Anti-Caking Agents Industry Revenue (Million) Forecast, by Application 2019 & 2032
- Table 17: Global US Anti-Caking Agents Industry Revenue Million Forecast, by Type 2019 & 2032
- Table 18: Global US Anti-Caking Agents Industry Revenue Million Forecast, by Application 2019 & 2032
- Table 19: Global US Anti-Caking Agents Industry Revenue Million Forecast, by Country 2019 & 2032
- Table 20: Brazil US Anti-Caking Agents Industry Revenue (Million) Forecast, by Application 2019 & 2032
- Table 21: Argentina US Anti-Caking Agents Industry Revenue (Million) Forecast, by Application 2019 & 2032
- Table 22: Rest of South America US Anti-Caking Agents Industry Revenue (Million) Forecast, by Application 2019 & 2032
- Table 23: Global US Anti-Caking Agents Industry Revenue Million Forecast, by Type 2019 & 2032
- Table 24: Global US Anti-Caking Agents Industry Revenue Million Forecast, by Application 2019 & 2032
- Table 25: Global US Anti-Caking Agents Industry Revenue Million Forecast, by Country 2019 & 2032
- Table 26: United Kingdom US Anti-Caking Agents Industry Revenue (Million) Forecast, by Application 2019 & 2032
- Table 27: Germany US Anti-Caking Agents Industry Revenue (Million) Forecast, by Application 2019 & 2032
- Table 28: France US Anti-Caking Agents Industry Revenue (Million) Forecast, by Application 2019 & 2032
- Table 29: Italy US Anti-Caking Agents Industry Revenue (Million) Forecast, by Application 2019 & 2032
- Table 30: Spain US Anti-Caking Agents Industry Revenue (Million) Forecast, by Application 2019 & 2032
- Table 31: Russia US Anti-Caking Agents Industry Revenue (Million) Forecast, by Application 2019 & 2032
- Table 32: Benelux US Anti-Caking Agents Industry Revenue (Million) Forecast, by Application 2019 & 2032
- Table 33: Nordics US Anti-Caking Agents Industry Revenue (Million) Forecast, by Application 2019 & 2032
- Table 34: Rest of Europe US Anti-Caking Agents Industry Revenue (Million) Forecast, by Application 2019 & 2032
- Table 35: Global US Anti-Caking Agents Industry Revenue Million Forecast, by Type 2019 & 2032
- Table 36: Global US Anti-Caking Agents Industry Revenue Million Forecast, by Application 2019 & 2032
- Table 37: Global US Anti-Caking Agents Industry Revenue Million Forecast, by Country 2019 & 2032
- Table 38: Turkey US Anti-Caking Agents Industry Revenue (Million) Forecast, by Application 2019 & 2032
- Table 39: Israel US Anti-Caking Agents Industry Revenue (Million) Forecast, by Application 2019 & 2032
- Table 40: GCC US Anti-Caking Agents Industry Revenue (Million) Forecast, by Application 2019 & 2032
- Table 41: North Africa US Anti-Caking Agents Industry Revenue (Million) Forecast, by Application 2019 & 2032
- Table 42: South Africa US Anti-Caking Agents Industry Revenue (Million) Forecast, by Application 2019 & 2032
- Table 43: Rest of Middle East & Africa US Anti-Caking Agents Industry Revenue (Million) Forecast, by Application 2019 & 2032
- Table 44: Global US Anti-Caking Agents Industry Revenue Million Forecast, by Type 2019 & 2032
- Table 45: Global US Anti-Caking Agents Industry Revenue Million Forecast, by Application 2019 & 2032
- Table 46: Global US Anti-Caking Agents Industry Revenue Million Forecast, by Country 2019 & 2032
- Table 47: China US Anti-Caking Agents Industry Revenue (Million) Forecast, by Application 2019 & 2032
- Table 48: India US Anti-Caking Agents Industry Revenue (Million) Forecast, by Application 2019 & 2032
- Table 49: Japan US Anti-Caking Agents Industry Revenue (Million) Forecast, by Application 2019 & 2032
- Table 50: South Korea US Anti-Caking Agents Industry Revenue (Million) Forecast, by Application 2019 & 2032
- Table 51: ASEAN US Anti-Caking Agents Industry Revenue (Million) Forecast, by Application 2019 & 2032
- Table 52: Oceania US Anti-Caking Agents Industry Revenue (Million) Forecast, by Application 2019 & 2032
- Table 53: Rest of Asia Pacific US Anti-Caking Agents Industry Revenue (Million) Forecast, by Application 2019 & 2032
Frequently Asked Questions
1. What is the projected Compound Annual Growth Rate (CAGR) of the US Anti-Caking Agents Industry?
The projected CAGR is approximately 5.23%.
2. Which companies are prominent players in the US Anti-Caking Agents Industry?
Key companies in the market include Cargill Incorporated, PQ Corporation*List Not Exhaustive, The Archer Daniels Midland Company, DuPont de Nemours Inc, Tate & Lyle PLC, BASF SE, Imac Inc, Agropur Ingredients.
3. What are the main segments of the US Anti-Caking Agents Industry?
The market segments include Type, Application.
4. Can you provide details about the market size?
The market size is estimated to be USD XX Million as of 2022.
5. What are some drivers contributing to market growth?
Wide Applications and Functionality; Demand For Gluten-Free Products.
6. What are the notable trends driving market growth?
Calcium Compounds Holds a Significant Share.
7. Are there any restraints impacting market growth?
Easy Availability of Economically Feasible Alternatives.
8. Can you provide examples of recent developments in the market?
1. In 2021, Cargill acquired Penford Products, a leading provider of anti-caking agents for the food industry. 2. In 2022, BASF launched a new line of organic anti-caking agents for the food and beverage industry. 3. In 2023, PQ Corporation announced a joint venture with a Chinese company to expand its production of anti-caking agents in Asia.
9. What pricing options are available for accessing the report?
Pricing options include single-user, multi-user, and enterprise licenses priced at USD 3800, USD 4500, and USD 5800 respectively.
10. Is the market size provided in terms of value or volume?
The market size is provided in terms of value, measured in Million.
11. Are there any specific market keywords associated with the report?
Yes, the market keyword associated with the report is "US Anti-Caking Agents Industry," which aids in identifying and referencing the specific market segment covered.
12. How do I determine which pricing option suits my needs best?
The pricing options vary based on user requirements and access needs. Individual users may opt for single-user licenses, while businesses requiring broader access may choose multi-user or enterprise licenses for cost-effective access to the report.
13. Are there any additional resources or data provided in the US Anti-Caking Agents Industry report?
While the report offers comprehensive insights, it's advisable to review the specific contents or supplementary materials provided to ascertain if additional resources or data are available.
14. How can I stay updated on further developments or reports in the US Anti-Caking Agents Industry?
To stay informed about further developments, trends, and reports in the US Anti-Caking Agents Industry, consider subscribing to industry newsletters, following relevant companies and organizations, or regularly checking reputable industry news sources and publications.
Methodology
Step 1 - Identification of Relevant Samples Size from Population Database


Step 2 - Approaches for Defining Global Market Size (Value, Volume* & Price*)

Note*: In applicable scenarios
Step 3 - Data Sources
Primary Research
- Web Analytics
- Survey Reports
- Research Institute
- Latest Research Reports
- Opinion Leaders
Secondary Research
- Annual Reports
- White Paper
- Latest Press Release
- Industry Association
- Paid Database
- Investor Presentations

Step 4 - Data Triangulation
Involves using different sources of information in order to increase the validity of a study
These sources are likely to be stakeholders in a program - participants, other researchers, program staff, other community members, and so on.
Then we put all data in single framework & apply various statistical tools to find out the dynamic on the market.
During the analysis stage, feedback from the stakeholder groups would be compared to determine areas of agreement as well as areas of divergence


