
Key Insights
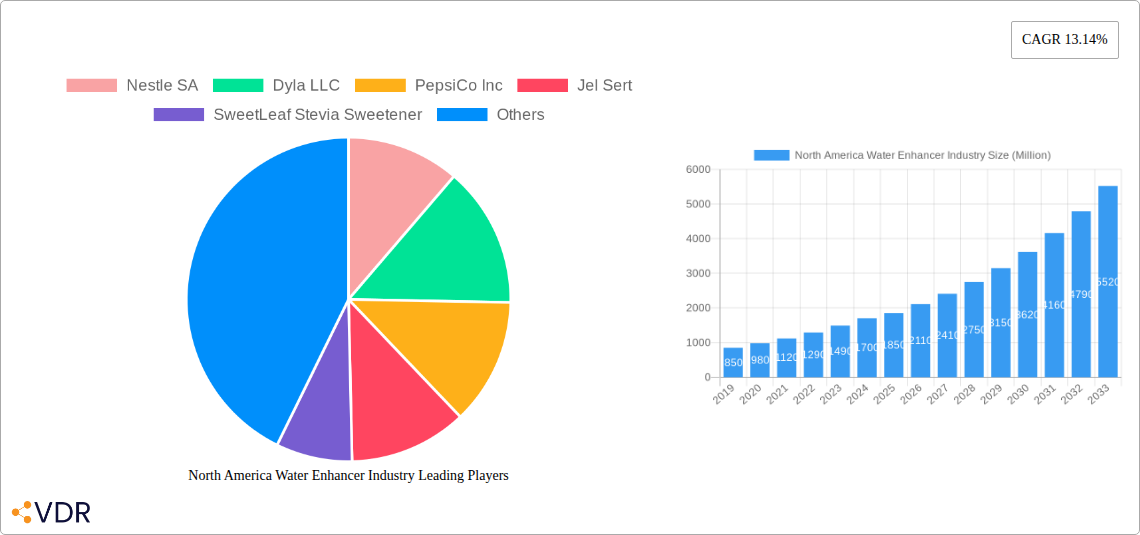
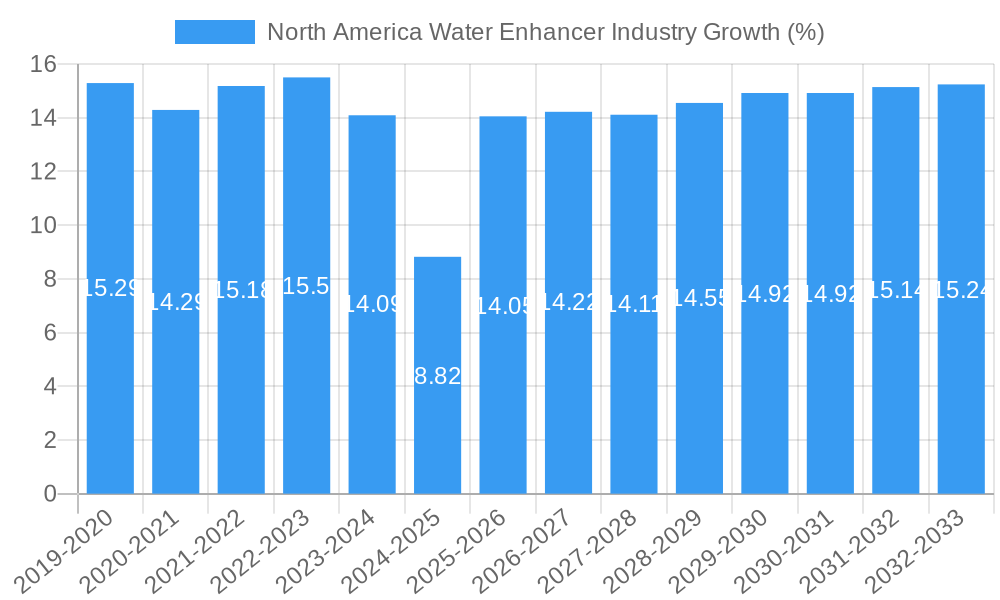
The North American water enhancer market is poised for substantial growth, projected to reach approximately USD 1,850 million by 2025, driven by a robust CAGR of 13.14%. This surge is primarily fueled by increasing consumer demand for healthier beverage alternatives to sugary drinks, a growing awareness of hydration's importance, and the convenience offered by portable, concentrated flavor drops and powders. The market's expansion is further bolstered by continuous product innovation, with manufacturers introducing a wider variety of natural flavors, functional ingredients like vitamins and electrolytes, and zero-calorie options. Key players like Nestle SA, PepsiCo Inc., and The Coca-Cola Company are actively investing in product development and marketing strategies to capture a larger share of this dynamic market. The trend towards personalized nutrition and on-the-go lifestyles also strongly supports the adoption of water enhancers, making them a convenient solution for individuals looking to improve their daily fluid intake.
Several factors contribute to this optimistic outlook. The rising prevalence of health-conscious consumers, particularly millennials and Gen Z, actively seeking to reduce sugar and artificial ingredient consumption, directly benefits the water enhancer segment. Moreover, the increasing disposable income across North America, especially in countries like the United States and Canada, empowers consumers to opt for premium and functional beverage additives. While the market presents immense opportunities, certain restraints, such as intense competition from established beverage brands and the emergence of private label alternatives, could moderate growth. Additionally, fluctuating raw material costs and evolving regulatory landscapes surrounding food additives might pose challenges. Despite these hurdles, the overall trajectory for the North American water enhancer market remains strongly positive, with significant expansion anticipated in online retail channels and specialized health stores, catering to niche consumer demands.
North America Water Enhancer Industry Market Dynamics & Structure
The North America water enhancer market is characterized by a moderately concentrated competitive landscape, with key players leveraging product innovation and strategic marketing to capture market share. Technological innovation is a significant driver, with advancements in natural sweeteners, flavor encapsulation, and convenient packaging formats continually shaping consumer offerings. Regulatory frameworks, primarily concerning food safety and ingredient labeling, influence product development and market entry strategies. Competitive product substitutes, such as flavored waters and other beverage alternatives, pose a constant challenge, necessitating continuous differentiation and value proposition enhancement for water enhancers. End-user demographics are increasingly health-conscious, seeking low-calorie, sugar-free, and natural options. Mergers and acquisitions (M&A) are observed as companies seek to expand their product portfolios, gain access to new technologies, and consolidate market presence.
- Market Concentration: Dominated by a few large multinational corporations, but with a growing presence of niche and specialized brands.
- Technological Innovation Drivers: Development of novel flavor profiles, extended shelf-life formulations, and eco-friendly packaging solutions.
- Regulatory Frameworks: Strict adherence to FDA and Health Canada guidelines for food additives and health claims.
- Competitive Product Substitutes: Impact of ready-to-drink (RTD) flavored waters, sparkling waters, and traditional juice alternatives.
- End-User Demographics: Growth driven by millennials and Gen Z consumers prioritizing health and wellness.
- M&A Trends: Strategic acquisitions focused on acquiring innovative technologies and expanding distribution networks.
North America Water Enhancer Industry Growth Trends & Insights
The North America water enhancer market has witnessed robust growth, fueled by a paradigm shift in consumer preferences towards healthier hydration alternatives. The market size is projected to expand significantly, driven by increasing consumer awareness of the benefits associated with reduced sugar intake and the desire for convenient, on-the-go solutions. Adoption rates for water enhancers are steadily rising as consumers seek to make their water consumption more appealing and less monotonous. Technological disruptions, particularly in the realm of natural and artificial sweeteners, have played a pivotal role in enhancing the appeal and perceived health benefits of these products. Innovations in flavor encapsulation and the development of diverse flavor profiles cater to a wider range of palates, further accelerating adoption. Consumer behavior is increasingly influenced by factors such as convenience, perceived health benefits, and the desire for personalized beverage experiences. This has led to a surge in demand for portable and easy-to-use water enhancer formats. The market penetration of water enhancers is expected to deepen as more consumers integrate them into their daily routines as a healthier alternative to sugary drinks. The market is projected to grow at a Compound Annual Growth Rate (CAGR) of approximately 7.5% from 2025 to 2033, reaching an estimated market value of $1,850 million units by 2033.
Dominant Regions, Countries, or Segments in North America Water Enhancer Industry
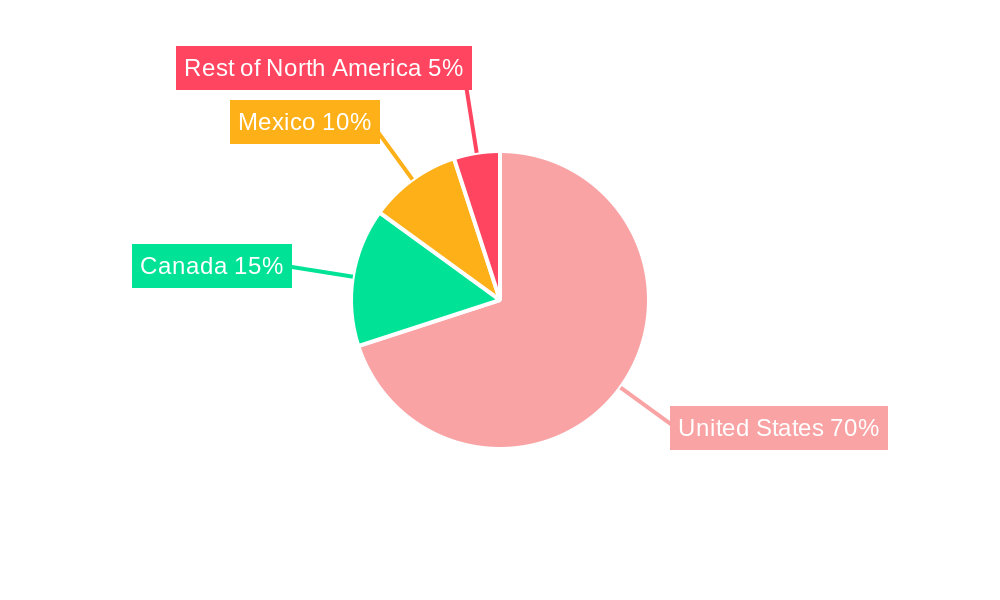
The United States stands as the undisputed leader in the North America water enhancer industry, driven by a confluence of factors including a large and health-conscious population, a well-developed retail infrastructure, and a high disposable income. This dominance is further amplified by robust consumer demand for low-calorie and sugar-free beverage options, a trend that water enhancers perfectly address. The distribution channel landscape within the United States is diverse, with Supermarkets/Hypermarkets and Online Retail Stores emerging as the dominant avenues for consumer access. Supermarkets/Hypermarkets offer extensive product visibility and impulse purchase opportunities, while Online Retail Stores provide unparalleled convenience and a broader selection, catering to the growing e-commerce penetration in the region. Pharmacy and Health Stores also play a significant role, appealing to a health-focused demographic actively seeking functional and beneficial beverage additions.
The growth within the United States is underpinned by significant economic policies that encourage healthier lifestyles and product innovation within the food and beverage sector. Infrastructure for product distribution is highly developed, ensuring widespread availability. Furthermore, substantial marketing investments by major players like PepsiCo Inc. and The Coca-Cola Company have significantly raised consumer awareness and product trial. The sheer volume of the US population, coupled with a high propensity to adopt new consumer trends, solidifies its position as the growth engine for the North America water enhancer market. While Canada and Mexico represent important and growing markets, their overall market size and growth trajectory are currently outpaced by the United States. The "Rest of North America," encompassing smaller markets, contributes a smaller but cumulatively significant portion to the overall regional market.
- Dominant Country: United States, accounting for an estimated 75% of the North America market share.
- Key Distribution Channels:
- Supermarkets/Hypermarkets: Facilitating mass market penetration and impulse purchases.
- Online Retail Stores: Driving convenience and product accessibility, estimated to capture 30% of sales by 2030.
- Dominance Factors in the US:
- Health and Wellness Trends: Growing consumer preference for sugar-free and low-calorie options.
- Retail Infrastructure: Extensive network of supermarkets, convenience stores, and online platforms.
- Consumer Spending Power: High disposable income supporting premium and innovative product purchases.
- Marketing and Awareness: Significant investment in advertising and promotional activities by leading brands.
- Growth Potential in Other Regions: Canada and Mexico are showing promising growth due to increasing health consciousness and expanding distribution networks.
North America Water Enhancer Industry Product Landscape
The product landscape of the North America water enhancer industry is characterized by a dynamic evolution of flavors, formulations, and functional benefits. Innovations are centered around natural sweeteners like stevia and monk fruit, addressing consumer demand for healthier, sugar-free alternatives. Companies are also focusing on creating unique and exotic flavor combinations, catering to adventurous palates and offering personalized hydration experiences. Performance metrics are increasingly gauged by taste profile, solubility, and the absence of artificial ingredients.
Key Drivers, Barriers & Challenges in North America Water Enhancer Industry
Key Drivers:
The North America water enhancer market is propelled by the surging consumer demand for healthier beverage options, driven by a growing awareness of the detrimental effects of excessive sugar consumption. The convenience and portability of water enhancers make them an attractive choice for on-the-go lifestyles, aligning perfectly with busy schedules. Technological advancements in natural sweeteners and flavor encapsulation are key drivers, enabling the creation of appealing and sugar-free products. Furthermore, increasing disposable incomes across the region support the adoption of premium and innovative beverage solutions.
Barriers & Challenges:
Despite its growth, the market faces several challenges. Intense competition from established beverage giants offering flavored waters and other convenient drink options presents a significant hurdle. Regulatory scrutiny regarding ingredient claims and labeling can impact product development and marketing strategies. Supply chain disruptions, particularly for specialized natural ingredients, can affect production and availability. Consumer perception regarding the "naturalness" and perceived health benefits of artificial sweeteners also remains a barrier for some segments of the population, leading to a preference for minimally processed options.
Emerging Opportunities in North America Water Enhancer Industry
Emerging opportunities in the North America water enhancer industry lie in the continued development of functional enhancers, incorporating vitamins, electrolytes, and other health-boosting ingredients. Untapped markets exist within specific demographic segments, such as children's formulations with fun flavors and educational benefits. Evolving consumer preferences for sustainable packaging and ethically sourced ingredients also present a significant opportunity for brands to differentiate themselves and capture environmentally conscious consumers. The expansion of online retail and direct-to-consumer models further opens avenues for targeted marketing and personalized product offerings.
Growth Accelerators in the North America Water Enhancer Industry Industry
Several catalysts are accelerating the long-term growth of the North America water enhancer industry. Technological breakthroughs in creating more natural and sophisticated flavor profiles are continuously expanding consumer appeal. Strategic partnerships between water enhancer brands and fitness influencers or health and wellness platforms are amplifying reach and credibility. Market expansion strategies, including broader distribution into convenience stores, travel hubs, and workplace cafeterias, are increasing accessibility. Furthermore, the growing trend of at-home water filtration systems is creating a larger base of consumers actively seeking ways to enhance their daily water intake.
Key Players Shaping the North America Water Enhancer Industry Market
- Nestle SA
- Dyla LLC
- PepsiCo Inc
- Jel Sert
- SweetLeaf Stevia Sweetener
- Nuun
- The Kraft Heinz Company
- The Coca-Cola Company
Notable Milestones in North America Water Enhancer Industry Sector
- 2019: Launch of new sugar-free flavor variants by major players, responding to growing health trends.
- 2020: Increased investment in online marketing and e-commerce platforms by water enhancer brands.
- 2021: Introduction of plant-based and natural ingredient focused water enhancers by emerging brands.
- 2022: Significant expansion of distribution channels into convenience stores and pharmacies.
- 2023: Growing consumer interest in functional water enhancers with added vitamins and electrolytes.
- 2024: Increased M&A activity as larger companies seek to acquire innovative water enhancer brands.
In-Depth North America Water Enhancer Industry Market Outlook
The North America water enhancer industry is poised for sustained and significant growth, driven by persistent consumer demand for healthier and more convenient hydration solutions. Future market potential is amplified by ongoing innovation in natural sweeteners and diverse flavor profiles, catering to an ever-evolving consumer palate. Strategic opportunities lie in expanding into untapped market segments, such as specialized formulations for children and active lifestyle enthusiasts, and further leveraging the power of online retail for direct-to-consumer engagement. The industry's ability to adapt to evolving health and wellness trends, coupled with a commitment to sustainable practices, will be crucial in solidifying its long-term success.
North America Water Enhancer Industry Segmentation
-
1. Distribution Channel
- 1.1. Supermarkets/Hypermarkets
- 1.2. Convenience Stores
- 1.3. Pharmacy and Health Stores
- 1.4. Online Retail Stores
- 1.5. Other Distribution Channels
-
2. Geography
- 2.1. United States
- 2.2. Canada
- 2.3. Mexico
- 2.4. Rest of North America
North America Water Enhancer Industry Segmentation By Geography
- 1. United States
- 2. Canada
- 3. Mexico
- 4. Rest of North America
North America Water Enhancer Industry REPORT HIGHLIGHTS
| Aspects | Details |
|---|---|
| Study Period | 2019-2033 |
| Base Year | 2024 |
| Estimated Year | 2025 |
| Forecast Period | 2025-2033 |
| Historical Period | 2019-2024 |
| Growth Rate | CAGR of 13.14% from 2019-2033 |
| Segmentation |
|
Table of Contents
- 1. Introduction
- 1.1. Research Scope
- 1.2. Market Segmentation
- 1.3. Research Methodology
- 1.4. Definitions and Assumptions
- 2. Executive Summary
- 2.1. Introduction
- 3. Market Dynamics
- 3.1. Introduction
- 3.2. Market Drivers
- 3.2.1. Consumer shift towards health based beverages; Demand for plant based and vegan products
- 3.3. Market Restrains
- 3.3.1. Lack of awareness of the product
- 3.4. Market Trends
- 3.4.1. Rising Innovations with Tempting Marketing Approaches by Manufacturers
- 4. Market Factor Analysis
- 4.1. Porters Five Forces
- 4.2. Supply/Value Chain
- 4.3. PESTEL analysis
- 4.4. Market Entropy
- 4.5. Patent/Trademark Analysis
- 5. North America Water Enhancer Industry Analysis, Insights and Forecast, 2019-2031
- 5.1. Market Analysis, Insights and Forecast - by Distribution Channel
- 5.1.1. Supermarkets/Hypermarkets
- 5.1.2. Convenience Stores
- 5.1.3. Pharmacy and Health Stores
- 5.1.4. Online Retail Stores
- 5.1.5. Other Distribution Channels
- 5.2. Market Analysis, Insights and Forecast - by Geography
- 5.2.1. United States
- 5.2.2. Canada
- 5.2.3. Mexico
- 5.2.4. Rest of North America
- 5.3. Market Analysis, Insights and Forecast - by Region
- 5.3.1. United States
- 5.3.2. Canada
- 5.3.3. Mexico
- 5.3.4. Rest of North America
- 5.1. Market Analysis, Insights and Forecast - by Distribution Channel
- 6. United States North America Water Enhancer Industry Analysis, Insights and Forecast, 2019-2031
- 6.1. Market Analysis, Insights and Forecast - by Distribution Channel
- 6.1.1. Supermarkets/Hypermarkets
- 6.1.2. Convenience Stores
- 6.1.3. Pharmacy and Health Stores
- 6.1.4. Online Retail Stores
- 6.1.5. Other Distribution Channels
- 6.2. Market Analysis, Insights and Forecast - by Geography
- 6.2.1. United States
- 6.2.2. Canada
- 6.2.3. Mexico
- 6.2.4. Rest of North America
- 6.1. Market Analysis, Insights and Forecast - by Distribution Channel
- 7. Canada North America Water Enhancer Industry Analysis, Insights and Forecast, 2019-2031
- 7.1. Market Analysis, Insights and Forecast - by Distribution Channel
- 7.1.1. Supermarkets/Hypermarkets
- 7.1.2. Convenience Stores
- 7.1.3. Pharmacy and Health Stores
- 7.1.4. Online Retail Stores
- 7.1.5. Other Distribution Channels
- 7.2. Market Analysis, Insights and Forecast - by Geography
- 7.2.1. United States
- 7.2.2. Canada
- 7.2.3. Mexico
- 7.2.4. Rest of North America
- 7.1. Market Analysis, Insights and Forecast - by Distribution Channel
- 8. Mexico North America Water Enhancer Industry Analysis, Insights and Forecast, 2019-2031
- 8.1. Market Analysis, Insights and Forecast - by Distribution Channel
- 8.1.1. Supermarkets/Hypermarkets
- 8.1.2. Convenience Stores
- 8.1.3. Pharmacy and Health Stores
- 8.1.4. Online Retail Stores
- 8.1.5. Other Distribution Channels
- 8.2. Market Analysis, Insights and Forecast - by Geography
- 8.2.1. United States
- 8.2.2. Canada
- 8.2.3. Mexico
- 8.2.4. Rest of North America
- 8.1. Market Analysis, Insights and Forecast - by Distribution Channel
- 9. Rest of North America North America Water Enhancer Industry Analysis, Insights and Forecast, 2019-2031
- 9.1. Market Analysis, Insights and Forecast - by Distribution Channel
- 9.1.1. Supermarkets/Hypermarkets
- 9.1.2. Convenience Stores
- 9.1.3. Pharmacy and Health Stores
- 9.1.4. Online Retail Stores
- 9.1.5. Other Distribution Channels
- 9.2. Market Analysis, Insights and Forecast - by Geography
- 9.2.1. United States
- 9.2.2. Canada
- 9.2.3. Mexico
- 9.2.4. Rest of North America
- 9.1. Market Analysis, Insights and Forecast - by Distribution Channel
- 10. United States North America Water Enhancer Industry Analysis, Insights and Forecast, 2019-2031
- 11. Canada North America Water Enhancer Industry Analysis, Insights and Forecast, 2019-2031
- 12. Mexico North America Water Enhancer Industry Analysis, Insights and Forecast, 2019-2031
- 13. Rest of North America North America Water Enhancer Industry Analysis, Insights and Forecast, 2019-2031
- 14. Competitive Analysis
- 14.1. Market Share Analysis 2024
- 14.2. Company Profiles
- 14.2.1 Nestle SA
- 14.2.1.1. Overview
- 14.2.1.2. Products
- 14.2.1.3. SWOT Analysis
- 14.2.1.4. Recent Developments
- 14.2.1.5. Financials (Based on Availability)
- 14.2.2 Dyla LLC
- 14.2.2.1. Overview
- 14.2.2.2. Products
- 14.2.2.3. SWOT Analysis
- 14.2.2.4. Recent Developments
- 14.2.2.5. Financials (Based on Availability)
- 14.2.3 PepsiCo Inc
- 14.2.3.1. Overview
- 14.2.3.2. Products
- 14.2.3.3. SWOT Analysis
- 14.2.3.4. Recent Developments
- 14.2.3.5. Financials (Based on Availability)
- 14.2.4 Jel Sert
- 14.2.4.1. Overview
- 14.2.4.2. Products
- 14.2.4.3. SWOT Analysis
- 14.2.4.4. Recent Developments
- 14.2.4.5. Financials (Based on Availability)
- 14.2.5 SweetLeaf Stevia Sweetener
- 14.2.5.1. Overview
- 14.2.5.2. Products
- 14.2.5.3. SWOT Analysis
- 14.2.5.4. Recent Developments
- 14.2.5.5. Financials (Based on Availability)
- 14.2.6 Nuun*List Not Exhaustive
- 14.2.6.1. Overview
- 14.2.6.2. Products
- 14.2.6.3. SWOT Analysis
- 14.2.6.4. Recent Developments
- 14.2.6.5. Financials (Based on Availability)
- 14.2.7 The Kraft Heinz Company
- 14.2.7.1. Overview
- 14.2.7.2. Products
- 14.2.7.3. SWOT Analysis
- 14.2.7.4. Recent Developments
- 14.2.7.5. Financials (Based on Availability)
- 14.2.8 The Coca-Cola Company
- 14.2.8.1. Overview
- 14.2.8.2. Products
- 14.2.8.3. SWOT Analysis
- 14.2.8.4. Recent Developments
- 14.2.8.5. Financials (Based on Availability)
- 14.2.1 Nestle SA
List of Figures
- Figure 1: North America Water Enhancer Industry Revenue Breakdown (Million, %) by Product 2024 & 2032
- Figure 2: North America Water Enhancer Industry Share (%) by Company 2024
List of Tables
- Table 1: North America Water Enhancer Industry Revenue Million Forecast, by Region 2019 & 2032
- Table 2: North America Water Enhancer Industry Revenue Million Forecast, by Distribution Channel 2019 & 2032
- Table 3: North America Water Enhancer Industry Revenue Million Forecast, by Geography 2019 & 2032
- Table 4: North America Water Enhancer Industry Revenue Million Forecast, by Region 2019 & 2032
- Table 5: North America Water Enhancer Industry Revenue Million Forecast, by Country 2019 & 2032
- Table 6: United States North America Water Enhancer Industry Revenue (Million) Forecast, by Application 2019 & 2032
- Table 7: Canada North America Water Enhancer Industry Revenue (Million) Forecast, by Application 2019 & 2032
- Table 8: Mexico North America Water Enhancer Industry Revenue (Million) Forecast, by Application 2019 & 2032
- Table 9: Rest of North America North America Water Enhancer Industry Revenue (Million) Forecast, by Application 2019 & 2032
- Table 10: North America Water Enhancer Industry Revenue Million Forecast, by Distribution Channel 2019 & 2032
- Table 11: North America Water Enhancer Industry Revenue Million Forecast, by Geography 2019 & 2032
- Table 12: North America Water Enhancer Industry Revenue Million Forecast, by Country 2019 & 2032
- Table 13: North America Water Enhancer Industry Revenue Million Forecast, by Distribution Channel 2019 & 2032
- Table 14: North America Water Enhancer Industry Revenue Million Forecast, by Geography 2019 & 2032
- Table 15: North America Water Enhancer Industry Revenue Million Forecast, by Country 2019 & 2032
- Table 16: North America Water Enhancer Industry Revenue Million Forecast, by Distribution Channel 2019 & 2032
- Table 17: North America Water Enhancer Industry Revenue Million Forecast, by Geography 2019 & 2032
- Table 18: North America Water Enhancer Industry Revenue Million Forecast, by Country 2019 & 2032
- Table 19: North America Water Enhancer Industry Revenue Million Forecast, by Distribution Channel 2019 & 2032
- Table 20: North America Water Enhancer Industry Revenue Million Forecast, by Geography 2019 & 2032
- Table 21: North America Water Enhancer Industry Revenue Million Forecast, by Country 2019 & 2032
Frequently Asked Questions
1. What is the projected Compound Annual Growth Rate (CAGR) of the North America Water Enhancer Industry?
The projected CAGR is approximately 13.14%.
2. Which companies are prominent players in the North America Water Enhancer Industry?
Key companies in the market include Nestle SA, Dyla LLC, PepsiCo Inc, Jel Sert, SweetLeaf Stevia Sweetener, Nuun*List Not Exhaustive, The Kraft Heinz Company, The Coca-Cola Company.
3. What are the main segments of the North America Water Enhancer Industry?
The market segments include Distribution Channel, Geography.
4. Can you provide details about the market size?
The market size is estimated to be USD XX Million as of 2022.
5. What are some drivers contributing to market growth?
Consumer shift towards health based beverages; Demand for plant based and vegan products.
6. What are the notable trends driving market growth?
Rising Innovations with Tempting Marketing Approaches by Manufacturers.
7. Are there any restraints impacting market growth?
Lack of awareness of the product.
8. Can you provide examples of recent developments in the market?
N/A
9. What pricing options are available for accessing the report?
Pricing options include single-user, multi-user, and enterprise licenses priced at USD 4750, USD 5250, and USD 8750 respectively.
10. Is the market size provided in terms of value or volume?
The market size is provided in terms of value, measured in Million.
11. Are there any specific market keywords associated with the report?
Yes, the market keyword associated with the report is "North America Water Enhancer Industry," which aids in identifying and referencing the specific market segment covered.
12. How do I determine which pricing option suits my needs best?
The pricing options vary based on user requirements and access needs. Individual users may opt for single-user licenses, while businesses requiring broader access may choose multi-user or enterprise licenses for cost-effective access to the report.
13. Are there any additional resources or data provided in the North America Water Enhancer Industry report?
While the report offers comprehensive insights, it's advisable to review the specific contents or supplementary materials provided to ascertain if additional resources or data are available.
14. How can I stay updated on further developments or reports in the North America Water Enhancer Industry?
To stay informed about further developments, trends, and reports in the North America Water Enhancer Industry, consider subscribing to industry newsletters, following relevant companies and organizations, or regularly checking reputable industry news sources and publications.
Methodology
Step 1 - Identification of Relevant Samples Size from Population Database


Step 2 - Approaches for Defining Global Market Size (Value, Volume* & Price*)

Note*: In applicable scenarios
Step 3 - Data Sources
Primary Research
- Web Analytics
- Survey Reports
- Research Institute
- Latest Research Reports
- Opinion Leaders
Secondary Research
- Annual Reports
- White Paper
- Latest Press Release
- Industry Association
- Paid Database
- Investor Presentations

Step 4 - Data Triangulation
Involves using different sources of information in order to increase the validity of a study
These sources are likely to be stakeholders in a program - participants, other researchers, program staff, other community members, and so on.
Then we put all data in single framework & apply various statistical tools to find out the dynamic on the market.
During the analysis stage, feedback from the stakeholder groups would be compared to determine areas of agreement as well as areas of divergence


