

Key Insights
The global sparkling water market is poised for robust expansion, with a current market size of approximately USD 32,740 million in 2025, projected to grow at a Compound Annual Growth Rate (CAGR) of 8.15% through 2033. This impressive growth trajectory is fueled by a confluence of evolving consumer preferences and strategic industry developments. A primary driver is the escalating health consciousness among consumers worldwide, who are increasingly seeking healthier alternatives to sugary beverages. Sparkling water, with its zero-calorie and refreshing profile, directly addresses this demand. Furthermore, the increasing availability and diversification of flavored and functional sparkling water variants are broadening its appeal, catering to a wider consumer base seeking both taste and perceived health benefits, such as added vitamins or minerals. The expansion of distribution channels, particularly online retail and the growing presence in supermarkets and hypermarkets, ensures greater accessibility, further propelling market penetration.
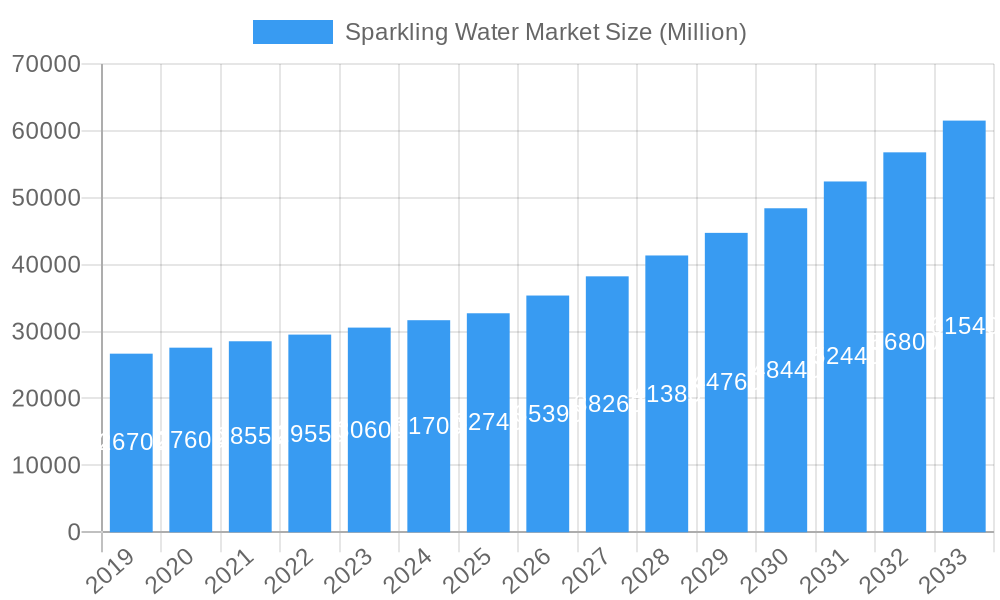
Sparkling Water Market Market Size (In Billion)
The market's dynamism is further shaped by several key trends and strategic initiatives by leading players. Innovations in packaging, with a focus on sustainability and convenience, are enhancing consumer appeal. The rise of "better-for-you" beverage categories and the premiumization of non-alcoholic drinks also contribute significantly to the market's upward momentum. While the market exhibits strong growth, potential restraints include fluctuating raw material costs, particularly for carbonation and packaging, and intense competition from both established beverage giants and emerging niche brands. However, the inherent appeal of sparkling water as a versatile and health-oriented beverage is expected to outweigh these challenges, positioning the market for sustained and significant growth across all its segments, including still water, sparkling water, and the rapidly expanding functional water category.
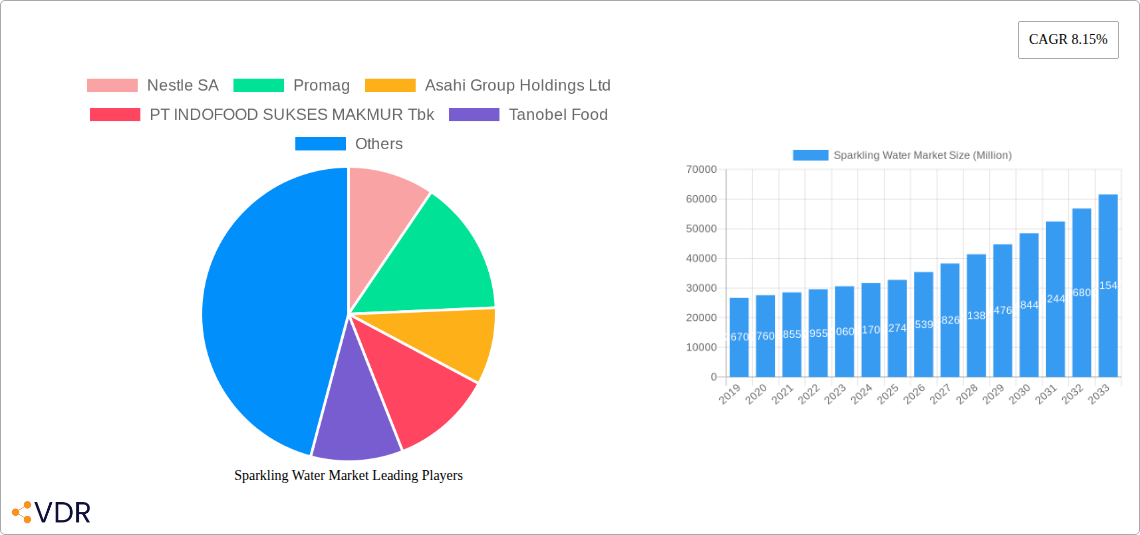
Sparkling Water Market Company Market Share
Sparkling Water Market: Trends, Dynamics, and Growth Outlook 2019-2033
This comprehensive report offers an in-depth analysis of the global sparkling water market, a rapidly expanding segment within the broader beverage industry. Exploring market dynamics, growth trends, regional dominance, product innovation, and key player strategies, this report is an essential resource for stakeholders seeking to understand and capitalize on opportunities in this vibrant sector. Covering the historical period from 2019 to 2024, the base and estimated year of 2025, and a detailed forecast period from 2025 to 2033, this analysis provides a robust outlook on the future trajectory of the sparkling water market and its parent and child markets. All values are presented in Million units.
Sparkling Water Market Market Dynamics & Structure
The sparkling water market is characterized by a moderate to high level of market concentration, with key players like Nestle SA, The Coca-Cola Company, and Danone S.A. holding significant shares. Technological innovation is a primary driver, with advancements in carbonation techniques, flavor infusions, and sustainable packaging shaping product offerings. Regulatory frameworks, particularly concerning food safety, labeling, and environmental sustainability, play a crucial role in market entry and product development. Competitive product substitutes include traditional carbonated soft drinks, other flavored beverages, and still water. End-user demographics are shifting towards health-conscious consumers, millennials, and Gen Z, who are increasingly seeking healthier alternatives to sugary drinks. Mergers and acquisitions (M&A) trends are evident as companies seek to expand their product portfolios and market reach. For instance, between 2019 and 2024, there have been approximately 20-30 significant M&A deals within the broader beverage sector, impacting the sparkling water landscape. Innovation barriers include the cost of research and development for novel flavors and functional ingredients, as well as the capital investment required for advanced production facilities.
- Market Concentration: Moderate to High, dominated by major beverage corporations.
- Technological Innovation Drivers: Advanced carbonation, novel flavorings, functional ingredients, sustainable packaging.
- Regulatory Frameworks: Food safety standards, ingredient disclosure, environmental compliance.
- Competitive Product Substitutes: Carbonated soft drinks, flavored teas, juices, still water.
- End-User Demographics: Health-conscious individuals, younger demographics, those seeking low-calorie options.
- M&A Trends: Strategic acquisitions for portfolio expansion and market penetration.
- Innovation Barriers: R&D costs, capital investment, intellectual property protection.
Sparkling Water Market Growth Trends & Insights
The global sparkling water market is experiencing robust growth, fueled by a confluence of evolving consumer preferences and industry innovation. The market size is projected to grow from approximately 120,000 million units in 2019 to an estimated 190,000 million units by 2025, and is expected to reach over 280,000 million units by 2033, exhibiting a compound annual growth rate (CAGR) of approximately 6.5% during the forecast period. Adoption rates for sparkling water have surged as consumers actively seek healthier alternatives to sugary beverages. This shift is driven by growing awareness of the negative health impacts associated with high sugar intake, making sparkling water a preferred choice for hydration and refreshment. Technological disruptions, such as the development of advanced water filtration systems and natural flavoring technologies, have enabled manufacturers to produce a wider variety of appealing and diverse product offerings. Consumer behavior is undergoing a significant transformation, with a marked preference for low-calorie, zero-sugar, and natural products. The "wellness" trend continues to empower consumers to make conscious choices that align with their health goals, directly benefiting the sparkling water segment. Market penetration is steadily increasing across developed and developing economies, as distribution networks expand and consumer education around the benefits of sparkling water rises. The rise of online retail channels has also played a pivotal role in enhancing accessibility and driving sales, allowing for a broader reach to diverse consumer segments. The parent market, the broader bottled water industry, provides a stable foundation, while the child markets, such as functional sparkling waters and premium artisanal varieties, are exhibiting even more dynamic growth.
Dominant Regions, Countries, or Segments in Sparkling Water Market
The North America region currently stands as a dominant force in the global sparkling water market, driven by a mature consumer base with a strong inclination towards health and wellness trends. Within North America, the United States represents the largest single country market, accounting for an estimated 35% of regional consumption. The dominance of this region is further amplified by robust economic policies supporting the beverage industry and well-established distribution infrastructure that ensures widespread availability.
The Sparkling Water segment within the 'Type' classification is the primary growth engine, significantly outpacing Still Water and even the rapidly developing Functional Water segment. Its market share within the overall bottled water category is estimated to be around 45% and is projected to grow consistently. This segment’s success is attributed to its versatility, appealing to a wide demographic seeking a healthier alternative to traditional carbonated beverages.
In terms of Distribution Channels, Supermarkets/Hypermarkets remain the leading channel, capturing approximately 40% of sales due to their extensive reach and product variety. However, Online Retailers are exhibiting the fastest growth, with an estimated CAGR of 12% over the forecast period, driven by convenience and the increasing digital adoption by consumers. This channel is expected to capture a significant market share by 2033.
Key drivers for this dominance include:
- Health Consciousness: Widespread consumer awareness of the benefits of low-calorie, sugar-free beverages.
- Product Innovation: Continuous introduction of new flavors, functional ingredients, and packaging formats.
- Marketing and Branding: Aggressive marketing campaigns by major players highlighting health and lifestyle aspects.
- Availability: Extensive retail presence and expanding online distribution networks.
The growth potential in North America is substantial, with further penetration expected in underserved demographics and an increasing demand for premium and niche sparkling water products. The United States' market share is projected to grow from an estimated 40,000 million units in 2025 to over 70,000 million units by 2033.
Sparkling Water Market Product Landscape
The product landscape of the sparkling water market is increasingly diverse and innovative. Key developments include the introduction of premium, naturally sourced sparkling waters infused with exotic fruits, herbs, and botanicals, offering unique taste profiles. Functional sparkling waters, fortified with vitamins, minerals, and adaptogens, are gaining traction, catering to specific health needs like stress relief or improved immunity. Performance metrics focus on purity, pH levels (e.g., Kosme Group's Jiwater with a pH between 7.5 and 8), and natural mineral content. The emphasis is on clean labels, with minimal artificial ingredients and sustainable packaging solutions, such as recycled PET bottles pioneered by companies like Danone-AQUA. Unique selling propositions often revolve around source of water, natural flavorings, and added health benefits, driving consumer preference for these advanced offerings.
Key Drivers, Barriers & Challenges in Sparkling Water Market
Key Drivers:
- Growing Health and Wellness Trend: Consumers actively seeking sugar-free, low-calorie, and natural beverage options.
- Product Diversification: Introduction of a wide array of flavors, functional ingredients, and premium offerings.
- Increased Disposable Income: Enabling consumers to opt for premium and healthier beverage choices.
- Effective Marketing and Branding: Highlighting health benefits, lifestyle appeal, and taste experiences.
- Expansion of Distribution Channels: Enhanced availability through online retail, convenience stores, and traditional outlets.
Barriers & Challenges:
- Intense Competition: Presence of established beverage giants and emerging niche players.
- Price Sensitivity: While premiumization is occurring, a segment of consumers remains price-sensitive.
- Supply Chain Disruptions: Potential for shortages of key ingredients or packaging materials.
- Regulatory Scrutiny: Evolving regulations regarding labeling, health claims, and environmental impact.
- Consumer Perception: Overcoming the perception of sparkling water as a plain or unexciting beverage for some.
- Cost of Innovation: High R&D costs for developing new flavors and functional benefits.
Emerging Opportunities in Sparkling Water Market
Emerging opportunities in the sparkling water market are abundant, driven by evolving consumer preferences and untapped market potential. The growth of the functional water segment presents a significant opportunity, with consumers seeking beverages that offer more than just hydration, such as added vitamins, electrolytes, or adaptogens for stress relief. Untapped markets in developing economies, particularly in Asia and Latin America, offer substantial growth prospects as disposable incomes rise and health consciousness spreads. Innovative applications, such as sparkling water as a mixer for mocktails or as an ingredient in culinary applications, are also emerging. Furthermore, the demand for sustainable and ethically sourced products creates opportunities for brands focusing on eco-friendly packaging and responsible water management practices.
Growth Accelerators in the Sparkling Water Market Industry
Several catalysts are accelerating the growth trajectory of the sparkling water market. Technological breakthroughs in natural flavoring extraction and advanced carbonation techniques are enabling manufacturers to create more sophisticated and appealing products. Strategic partnerships between beverage companies and health and wellness influencers are amplifying brand reach and consumer engagement. Market expansion strategies, including entry into new geographical territories and targeting specific demographic segments with tailored product lines, are further propelling growth. The increasing focus on premiumization, with consumers willing to pay more for high-quality, natural, and functional sparkling waters, is a significant growth accelerator. Investments in sustainable packaging solutions are not only meeting consumer demand but also driving innovation and potentially reducing long-term operational costs.
Key Players Shaping the Sparkling Water Market Market
- Nestle SA
- Promag
- Asahi Group Holdings Ltd
- PT INDOFOOD SUKSES MAKMUR Tbk
- Tanobel Food
- Fraser and Neave Limited
- Danone S A
- Blue Band
- The Coca-Cola Company
- Indo Food
- Kosme Group
Notable Milestones in Sparkling Water Market Sector
- August 2022: Kosme Group launched Jiwater in Indonesia, a natural artesian water processed with Japanese technology, featuring a pH range of 7.5 to 8.
- January 2022: Danone-AQUA introduced AQUA LIFE in Indonesia, producing PET bottles from 100% recycled material, emphasizing environmental conservation.
- June 2021: Nestlé Waters announced expanded efforts in responsible water management and collaboration for regional solutions, aiming for positive water cycle revitalization through over 100 projects by 2025.
In-Depth Sparkling Water Market Market Outlook
The in-depth sparkling water market outlook indicates sustained and robust growth. Key factors contributing to this positive trajectory include the ongoing consumer shift towards healthier beverage choices, driven by an increased awareness of the detriments of sugary drinks. The continuous innovation in product offerings, from unique flavor combinations to functional enhancements, will cater to a widening consumer base and create new market niches. Furthermore, the expansion of distribution networks, particularly the rapid growth of online retail, will enhance accessibility and drive sales volume. Strategic investments by key players in sustainable practices and advanced production technologies will not only meet evolving consumer demands for eco-friendly products but also foster operational efficiencies. The emerging markets, with their growing middle class and increasing health consciousness, represent significant untapped potential for future market expansion.
Sparkling Water Market Segmentation
-
1. Type
- 1.1. Still Water
- 1.2. Sparkling Water
- 1.3. Functional Water
-
2. Distribution Channel
- 2.1. Supermarkets/Hypermarkets
- 2.2. Convenience Stores
- 2.3. Online Retailers
- 2.4. On-trade
- 2.5. Other Distribution Channels
Sparkling Water Market Segmentation By Geography
-
1. North America
- 1.1. United States
- 1.2. Canada
- 1.3. Mexico
-
2. South America
- 2.1. Brazil
- 2.2. Argentina
- 2.3. Rest of South America
-
3. Europe
- 3.1. United Kingdom
- 3.2. Germany
- 3.3. France
- 3.4. Italy
- 3.5. Spain
- 3.6. Russia
- 3.7. Benelux
- 3.8. Nordics
- 3.9. Rest of Europe
-
4. Middle East & Africa
- 4.1. Turkey
- 4.2. Israel
- 4.3. GCC
- 4.4. North Africa
- 4.5. South Africa
- 4.6. Rest of Middle East & Africa
-
5. Asia Pacific
- 5.1. China
- 5.2. India
- 5.3. Japan
- 5.4. South Korea
- 5.5. ASEAN
- 5.6. Oceania
- 5.7. Rest of Asia Pacific
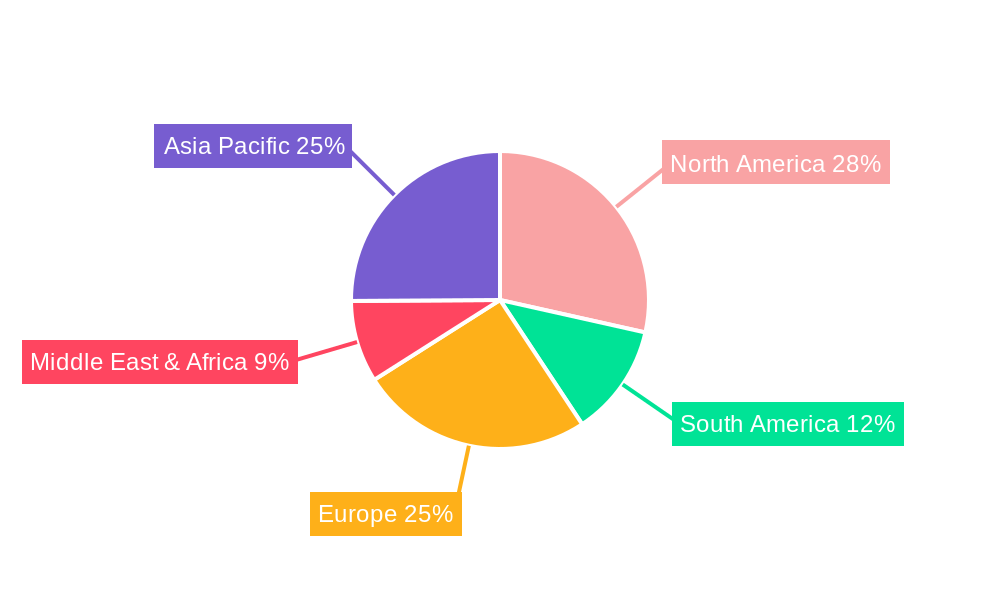
Sparkling Water Market Regional Market Share
Geographic Coverage of Sparkling Water Market
Sparkling Water Market REPORT HIGHLIGHTS
| Aspects | Details |
|---|---|
| Study Period | 2020-2034 |
| Base Year | 2025 |
| Estimated Year | 2026 |
| Forecast Period | 2026-2034 |
| Historical Period | 2020-2025 |
| Growth Rate | CAGR of 8.15% from 2020-2034 |
| Segmentation |
|
Table of Contents
- 1. Introduction
- 1.1. Research Scope
- 1.2. Market Segmentation
- 1.3. Research Objective
- 1.4. Definitions and Assumptions
- 2. Executive Summary
- 2.1. Market Snapshot
- 3. Market Dynamics
- 3.1. Market Drivers
- 3.2. Market Restrains
- 3.3. Market Trends
- 3.4. Market Opportunities
- 4. Market Factor Analysis
- 4.1. Porters Five Forces
- 4.1.1. Bargaining Power of Suppliers
- 4.1.2. Bargaining Power of Buyers
- 4.1.3. Threat of New Entrants
- 4.1.4. Threat of Substitutes
- 4.1.5. Competitive Rivalry
- 4.2. PESTEL analysis
- 4.3. BCG Analysis
- 4.3.1. Stars (High Growth, High Market Share)
- 4.3.2. Cash Cows (Low Growth, High Market Share)
- 4.3.3. Question Mark (High Growth, Low Market Share)
- 4.3.4. Dogs (Low Growth, Low Market Share)
- 4.4. Ansoff Matrix Analysis
- 4.5. Supply Chain Analysis
- 4.6. Regulatory Landscape
- 4.7. Current Market Potential and Opportunity Assessment (TAM–SAM–SOM Framework)
- 4.8. VDR Analyst Note
- 4.1. Porters Five Forces
- 5. Market Analysis, Insights and Forecast 2021-2033
- 5.1. Market Analysis, Insights and Forecast - by Type
- 5.1.1. Still Water
- 5.1.2. Sparkling Water
- 5.1.3. Functional Water
- 5.2. Market Analysis, Insights and Forecast - by Distribution Channel
- 5.2.1. Supermarkets/Hypermarkets
- 5.2.2. Convenience Stores
- 5.2.3. Online Retailers
- 5.2.4. On-trade
- 5.2.5. Other Distribution Channels
- 5.3. Market Analysis, Insights and Forecast - by Region
- 5.3.1. North America
- 5.3.2. South America
- 5.3.3. Europe
- 5.3.4. Middle East & Africa
- 5.3.5. Asia Pacific
- 5.1. Market Analysis, Insights and Forecast - by Type
- 6. Global Sparkling Water Market Analysis, Insights and Forecast, 2021-2033
- 6.1. Market Analysis, Insights and Forecast - by Type
- 6.1.1. Still Water
- 6.1.2. Sparkling Water
- 6.1.3. Functional Water
- 6.2. Market Analysis, Insights and Forecast - by Distribution Channel
- 6.2.1. Supermarkets/Hypermarkets
- 6.2.2. Convenience Stores
- 6.2.3. Online Retailers
- 6.2.4. On-trade
- 6.2.5. Other Distribution Channels
- 6.1. Market Analysis, Insights and Forecast - by Type
- 7. North America Sparkling Water Market Analysis, Insights and Forecast, 2021-2033
- 7.1. Market Analysis, Insights and Forecast - by Type
- 7.1.1. Still Water
- 7.1.2. Sparkling Water
- 7.1.3. Functional Water
- 7.2. Market Analysis, Insights and Forecast - by Distribution Channel
- 7.2.1. Supermarkets/Hypermarkets
- 7.2.2. Convenience Stores
- 7.2.3. Online Retailers
- 7.2.4. On-trade
- 7.2.5. Other Distribution Channels
- 7.1. Market Analysis, Insights and Forecast - by Type
- 8. South America Sparkling Water Market Analysis, Insights and Forecast, 2021-2033
- 8.1. Market Analysis, Insights and Forecast - by Type
- 8.1.1. Still Water
- 8.1.2. Sparkling Water
- 8.1.3. Functional Water
- 8.2. Market Analysis, Insights and Forecast - by Distribution Channel
- 8.2.1. Supermarkets/Hypermarkets
- 8.2.2. Convenience Stores
- 8.2.3. Online Retailers
- 8.2.4. On-trade
- 8.2.5. Other Distribution Channels
- 8.1. Market Analysis, Insights and Forecast - by Type
- 9. Europe Sparkling Water Market Analysis, Insights and Forecast, 2021-2033
- 9.1. Market Analysis, Insights and Forecast - by Type
- 9.1.1. Still Water
- 9.1.2. Sparkling Water
- 9.1.3. Functional Water
- 9.2. Market Analysis, Insights and Forecast - by Distribution Channel
- 9.2.1. Supermarkets/Hypermarkets
- 9.2.2. Convenience Stores
- 9.2.3. Online Retailers
- 9.2.4. On-trade
- 9.2.5. Other Distribution Channels
- 9.1. Market Analysis, Insights and Forecast - by Type
- 10. Middle East & Africa Sparkling Water Market Analysis, Insights and Forecast, 2021-2033
- 10.1. Market Analysis, Insights and Forecast - by Type
- 10.1.1. Still Water
- 10.1.2. Sparkling Water
- 10.1.3. Functional Water
- 10.2. Market Analysis, Insights and Forecast - by Distribution Channel
- 10.2.1. Supermarkets/Hypermarkets
- 10.2.2. Convenience Stores
- 10.2.3. Online Retailers
- 10.2.4. On-trade
- 10.2.5. Other Distribution Channels
- 10.1. Market Analysis, Insights and Forecast - by Type
- 11. Asia Pacific Sparkling Water Market Analysis, Insights and Forecast, 2021-2033
- 11.1. Market Analysis, Insights and Forecast - by Type
- 11.1.1. Still Water
- 11.1.2. Sparkling Water
- 11.1.3. Functional Water
- 11.2. Market Analysis, Insights and Forecast - by Distribution Channel
- 11.2.1. Supermarkets/Hypermarkets
- 11.2.2. Convenience Stores
- 11.2.3. Online Retailers
- 11.2.4. On-trade
- 11.2.5. Other Distribution Channels
- 11.1. Market Analysis, Insights and Forecast - by Type
- 12. Competitive Analysis
- 12.1. Company Profiles
- 12.1.1 Nestle SA
- 12.1.1.1. Company Overview
- 12.1.1.2. Products
- 12.1.1.3. Company Financials
- 12.1.1.4. SWOT Analysis
- 12.1.2 Promag
- 12.1.2.1. Company Overview
- 12.1.2.2. Products
- 12.1.2.3. Company Financials
- 12.1.2.4. SWOT Analysis
- 12.1.3 Asahi Group Holdings Ltd
- 12.1.3.1. Company Overview
- 12.1.3.2. Products
- 12.1.3.3. Company Financials
- 12.1.3.4. SWOT Analysis
- 12.1.4 PT INDOFOOD SUKSES MAKMUR Tbk
- 12.1.4.1. Company Overview
- 12.1.4.2. Products
- 12.1.4.3. Company Financials
- 12.1.4.4. SWOT Analysis
- 12.1.5 Tanobel Food
- 12.1.5.1. Company Overview
- 12.1.5.2. Products
- 12.1.5.3. Company Financials
- 12.1.5.4. SWOT Analysis
- 12.1.6 Fraser and Neave Limited
- 12.1.6.1. Company Overview
- 12.1.6.2. Products
- 12.1.6.3. Company Financials
- 12.1.6.4. SWOT Analysis
- 12.1.7 Danone S A
- 12.1.7.1. Company Overview
- 12.1.7.2. Products
- 12.1.7.3. Company Financials
- 12.1.7.4. SWOT Analysis
- 12.1.8 Blue Band
- 12.1.8.1. Company Overview
- 12.1.8.2. Products
- 12.1.8.3. Company Financials
- 12.1.8.4. SWOT Analysis
- 12.1.9 The Coca-Cola Company
- 12.1.9.1. Company Overview
- 12.1.9.2. Products
- 12.1.9.3. Company Financials
- 12.1.9.4. SWOT Analysis
- 12.1.10 Indo Food
- 12.1.10.1. Company Overview
- 12.1.10.2. Products
- 12.1.10.3. Company Financials
- 12.1.10.4. SWOT Analysis
- 12.1.11 Kosme Group*List Not Exhaustive
- 12.1.11.1. Company Overview
- 12.1.11.2. Products
- 12.1.11.3. Company Financials
- 12.1.11.4. SWOT Analysis
- 12.1.1 Nestle SA
- 12.2. Market Entropy
- 12.2.1 Company's Key Areas Served
- 12.2.2 Recent Developments
- 12.3. Company Market Share Analysis 2025
- 12.3.1 Top 5 Companies Market Share Analysis
- 12.3.2 Top 3 Companies Market Share Analysis
- 12.4. List of Potential Customers
- 13. Research Methodology
List of Figures
- Figure 1: Global Sparkling Water Market Revenue Breakdown (Million, %) by Region 2025 & 2033
- Figure 2: Global Sparkling Water Market Volume Breakdown (liter , %) by Region 2025 & 2033
- Figure 3: North America Sparkling Water Market Revenue (Million), by Type 2025 & 2033
- Figure 4: North America Sparkling Water Market Volume (liter ), by Type 2025 & 2033
- Figure 5: North America Sparkling Water Market Revenue Share (%), by Type 2025 & 2033
- Figure 6: North America Sparkling Water Market Volume Share (%), by Type 2025 & 2033
- Figure 7: North America Sparkling Water Market Revenue (Million), by Distribution Channel 2025 & 2033
- Figure 8: North America Sparkling Water Market Volume (liter ), by Distribution Channel 2025 & 2033
- Figure 9: North America Sparkling Water Market Revenue Share (%), by Distribution Channel 2025 & 2033
- Figure 10: North America Sparkling Water Market Volume Share (%), by Distribution Channel 2025 & 2033
- Figure 11: North America Sparkling Water Market Revenue (Million), by Country 2025 & 2033
- Figure 12: North America Sparkling Water Market Volume (liter ), by Country 2025 & 2033
- Figure 13: North America Sparkling Water Market Revenue Share (%), by Country 2025 & 2033
- Figure 14: North America Sparkling Water Market Volume Share (%), by Country 2025 & 2033
- Figure 15: South America Sparkling Water Market Revenue (Million), by Type 2025 & 2033
- Figure 16: South America Sparkling Water Market Volume (liter ), by Type 2025 & 2033
- Figure 17: South America Sparkling Water Market Revenue Share (%), by Type 2025 & 2033
- Figure 18: South America Sparkling Water Market Volume Share (%), by Type 2025 & 2033
- Figure 19: South America Sparkling Water Market Revenue (Million), by Distribution Channel 2025 & 2033
- Figure 20: South America Sparkling Water Market Volume (liter ), by Distribution Channel 2025 & 2033
- Figure 21: South America Sparkling Water Market Revenue Share (%), by Distribution Channel 2025 & 2033
- Figure 22: South America Sparkling Water Market Volume Share (%), by Distribution Channel 2025 & 2033
- Figure 23: South America Sparkling Water Market Revenue (Million), by Country 2025 & 2033
- Figure 24: South America Sparkling Water Market Volume (liter ), by Country 2025 & 2033
- Figure 25: South America Sparkling Water Market Revenue Share (%), by Country 2025 & 2033
- Figure 26: South America Sparkling Water Market Volume Share (%), by Country 2025 & 2033
- Figure 27: Europe Sparkling Water Market Revenue (Million), by Type 2025 & 2033
- Figure 28: Europe Sparkling Water Market Volume (liter ), by Type 2025 & 2033
- Figure 29: Europe Sparkling Water Market Revenue Share (%), by Type 2025 & 2033
- Figure 30: Europe Sparkling Water Market Volume Share (%), by Type 2025 & 2033
- Figure 31: Europe Sparkling Water Market Revenue (Million), by Distribution Channel 2025 & 2033
- Figure 32: Europe Sparkling Water Market Volume (liter ), by Distribution Channel 2025 & 2033
- Figure 33: Europe Sparkling Water Market Revenue Share (%), by Distribution Channel 2025 & 2033
- Figure 34: Europe Sparkling Water Market Volume Share (%), by Distribution Channel 2025 & 2033
- Figure 35: Europe Sparkling Water Market Revenue (Million), by Country 2025 & 2033
- Figure 36: Europe Sparkling Water Market Volume (liter ), by Country 2025 & 2033
- Figure 37: Europe Sparkling Water Market Revenue Share (%), by Country 2025 & 2033
- Figure 38: Europe Sparkling Water Market Volume Share (%), by Country 2025 & 2033
- Figure 39: Middle East & Africa Sparkling Water Market Revenue (Million), by Type 2025 & 2033
- Figure 40: Middle East & Africa Sparkling Water Market Volume (liter ), by Type 2025 & 2033
- Figure 41: Middle East & Africa Sparkling Water Market Revenue Share (%), by Type 2025 & 2033
- Figure 42: Middle East & Africa Sparkling Water Market Volume Share (%), by Type 2025 & 2033
- Figure 43: Middle East & Africa Sparkling Water Market Revenue (Million), by Distribution Channel 2025 & 2033
- Figure 44: Middle East & Africa Sparkling Water Market Volume (liter ), by Distribution Channel 2025 & 2033
- Figure 45: Middle East & Africa Sparkling Water Market Revenue Share (%), by Distribution Channel 2025 & 2033
- Figure 46: Middle East & Africa Sparkling Water Market Volume Share (%), by Distribution Channel 2025 & 2033
- Figure 47: Middle East & Africa Sparkling Water Market Revenue (Million), by Country 2025 & 2033
- Figure 48: Middle East & Africa Sparkling Water Market Volume (liter ), by Country 2025 & 2033
- Figure 49: Middle East & Africa Sparkling Water Market Revenue Share (%), by Country 2025 & 2033
- Figure 50: Middle East & Africa Sparkling Water Market Volume Share (%), by Country 2025 & 2033
- Figure 51: Asia Pacific Sparkling Water Market Revenue (Million), by Type 2025 & 2033
- Figure 52: Asia Pacific Sparkling Water Market Volume (liter ), by Type 2025 & 2033
- Figure 53: Asia Pacific Sparkling Water Market Revenue Share (%), by Type 2025 & 2033
- Figure 54: Asia Pacific Sparkling Water Market Volume Share (%), by Type 2025 & 2033
- Figure 55: Asia Pacific Sparkling Water Market Revenue (Million), by Distribution Channel 2025 & 2033
- Figure 56: Asia Pacific Sparkling Water Market Volume (liter ), by Distribution Channel 2025 & 2033
- Figure 57: Asia Pacific Sparkling Water Market Revenue Share (%), by Distribution Channel 2025 & 2033
- Figure 58: Asia Pacific Sparkling Water Market Volume Share (%), by Distribution Channel 2025 & 2033
- Figure 59: Asia Pacific Sparkling Water Market Revenue (Million), by Country 2025 & 2033
- Figure 60: Asia Pacific Sparkling Water Market Volume (liter ), by Country 2025 & 2033
- Figure 61: Asia Pacific Sparkling Water Market Revenue Share (%), by Country 2025 & 2033
- Figure 62: Asia Pacific Sparkling Water Market Volume Share (%), by Country 2025 & 2033
List of Tables
- Table 1: Global Sparkling Water Market Revenue Million Forecast, by Type 2020 & 2033
- Table 2: Global Sparkling Water Market Volume liter Forecast, by Type 2020 & 2033
- Table 3: Global Sparkling Water Market Revenue Million Forecast, by Distribution Channel 2020 & 2033
- Table 4: Global Sparkling Water Market Volume liter Forecast, by Distribution Channel 2020 & 2033
- Table 5: Global Sparkling Water Market Revenue Million Forecast, by Region 2020 & 2033
- Table 6: Global Sparkling Water Market Volume liter Forecast, by Region 2020 & 2033
- Table 7: Global Sparkling Water Market Revenue Million Forecast, by Type 2020 & 2033
- Table 8: Global Sparkling Water Market Volume liter Forecast, by Type 2020 & 2033
- Table 9: Global Sparkling Water Market Revenue Million Forecast, by Distribution Channel 2020 & 2033
- Table 10: Global Sparkling Water Market Volume liter Forecast, by Distribution Channel 2020 & 2033
- Table 11: Global Sparkling Water Market Revenue Million Forecast, by Country 2020 & 2033
- Table 12: Global Sparkling Water Market Volume liter Forecast, by Country 2020 & 2033
- Table 13: United States Sparkling Water Market Revenue (Million) Forecast, by Application 2020 & 2033
- Table 14: United States Sparkling Water Market Volume (liter ) Forecast, by Application 2020 & 2033
- Table 15: Canada Sparkling Water Market Revenue (Million) Forecast, by Application 2020 & 2033
- Table 16: Canada Sparkling Water Market Volume (liter ) Forecast, by Application 2020 & 2033
- Table 17: Mexico Sparkling Water Market Revenue (Million) Forecast, by Application 2020 & 2033
- Table 18: Mexico Sparkling Water Market Volume (liter ) Forecast, by Application 2020 & 2033
- Table 19: Global Sparkling Water Market Revenue Million Forecast, by Type 2020 & 2033
- Table 20: Global Sparkling Water Market Volume liter Forecast, by Type 2020 & 2033
- Table 21: Global Sparkling Water Market Revenue Million Forecast, by Distribution Channel 2020 & 2033
- Table 22: Global Sparkling Water Market Volume liter Forecast, by Distribution Channel 2020 & 2033
- Table 23: Global Sparkling Water Market Revenue Million Forecast, by Country 2020 & 2033
- Table 24: Global Sparkling Water Market Volume liter Forecast, by Country 2020 & 2033
- Table 25: Brazil Sparkling Water Market Revenue (Million) Forecast, by Application 2020 & 2033
- Table 26: Brazil Sparkling Water Market Volume (liter ) Forecast, by Application 2020 & 2033
- Table 27: Argentina Sparkling Water Market Revenue (Million) Forecast, by Application 2020 & 2033
- Table 28: Argentina Sparkling Water Market Volume (liter ) Forecast, by Application 2020 & 2033
- Table 29: Rest of South America Sparkling Water Market Revenue (Million) Forecast, by Application 2020 & 2033
- Table 30: Rest of South America Sparkling Water Market Volume (liter ) Forecast, by Application 2020 & 2033
- Table 31: Global Sparkling Water Market Revenue Million Forecast, by Type 2020 & 2033
- Table 32: Global Sparkling Water Market Volume liter Forecast, by Type 2020 & 2033
- Table 33: Global Sparkling Water Market Revenue Million Forecast, by Distribution Channel 2020 & 2033
- Table 34: Global Sparkling Water Market Volume liter Forecast, by Distribution Channel 2020 & 2033
- Table 35: Global Sparkling Water Market Revenue Million Forecast, by Country 2020 & 2033
- Table 36: Global Sparkling Water Market Volume liter Forecast, by Country 2020 & 2033
- Table 37: United Kingdom Sparkling Water Market Revenue (Million) Forecast, by Application 2020 & 2033
- Table 38: United Kingdom Sparkling Water Market Volume (liter ) Forecast, by Application 2020 & 2033
- Table 39: Germany Sparkling Water Market Revenue (Million) Forecast, by Application 2020 & 2033
- Table 40: Germany Sparkling Water Market Volume (liter ) Forecast, by Application 2020 & 2033
- Table 41: France Sparkling Water Market Revenue (Million) Forecast, by Application 2020 & 2033
- Table 42: France Sparkling Water Market Volume (liter ) Forecast, by Application 2020 & 2033
- Table 43: Italy Sparkling Water Market Revenue (Million) Forecast, by Application 2020 & 2033
- Table 44: Italy Sparkling Water Market Volume (liter ) Forecast, by Application 2020 & 2033
- Table 45: Spain Sparkling Water Market Revenue (Million) Forecast, by Application 2020 & 2033
- Table 46: Spain Sparkling Water Market Volume (liter ) Forecast, by Application 2020 & 2033
- Table 47: Russia Sparkling Water Market Revenue (Million) Forecast, by Application 2020 & 2033
- Table 48: Russia Sparkling Water Market Volume (liter ) Forecast, by Application 2020 & 2033
- Table 49: Benelux Sparkling Water Market Revenue (Million) Forecast, by Application 2020 & 2033
- Table 50: Benelux Sparkling Water Market Volume (liter ) Forecast, by Application 2020 & 2033
- Table 51: Nordics Sparkling Water Market Revenue (Million) Forecast, by Application 2020 & 2033
- Table 52: Nordics Sparkling Water Market Volume (liter ) Forecast, by Application 2020 & 2033
- Table 53: Rest of Europe Sparkling Water Market Revenue (Million) Forecast, by Application 2020 & 2033
- Table 54: Rest of Europe Sparkling Water Market Volume (liter ) Forecast, by Application 2020 & 2033
- Table 55: Global Sparkling Water Market Revenue Million Forecast, by Type 2020 & 2033
- Table 56: Global Sparkling Water Market Volume liter Forecast, by Type 2020 & 2033
- Table 57: Global Sparkling Water Market Revenue Million Forecast, by Distribution Channel 2020 & 2033
- Table 58: Global Sparkling Water Market Volume liter Forecast, by Distribution Channel 2020 & 2033
- Table 59: Global Sparkling Water Market Revenue Million Forecast, by Country 2020 & 2033
- Table 60: Global Sparkling Water Market Volume liter Forecast, by Country 2020 & 2033
- Table 61: Turkey Sparkling Water Market Revenue (Million) Forecast, by Application 2020 & 2033
- Table 62: Turkey Sparkling Water Market Volume (liter ) Forecast, by Application 2020 & 2033
- Table 63: Israel Sparkling Water Market Revenue (Million) Forecast, by Application 2020 & 2033
- Table 64: Israel Sparkling Water Market Volume (liter ) Forecast, by Application 2020 & 2033
- Table 65: GCC Sparkling Water Market Revenue (Million) Forecast, by Application 2020 & 2033
- Table 66: GCC Sparkling Water Market Volume (liter ) Forecast, by Application 2020 & 2033
- Table 67: North Africa Sparkling Water Market Revenue (Million) Forecast, by Application 2020 & 2033
- Table 68: North Africa Sparkling Water Market Volume (liter ) Forecast, by Application 2020 & 2033
- Table 69: South Africa Sparkling Water Market Revenue (Million) Forecast, by Application 2020 & 2033
- Table 70: South Africa Sparkling Water Market Volume (liter ) Forecast, by Application 2020 & 2033
- Table 71: Rest of Middle East & Africa Sparkling Water Market Revenue (Million) Forecast, by Application 2020 & 2033
- Table 72: Rest of Middle East & Africa Sparkling Water Market Volume (liter ) Forecast, by Application 2020 & 2033
- Table 73: Global Sparkling Water Market Revenue Million Forecast, by Type 2020 & 2033
- Table 74: Global Sparkling Water Market Volume liter Forecast, by Type 2020 & 2033
- Table 75: Global Sparkling Water Market Revenue Million Forecast, by Distribution Channel 2020 & 2033
- Table 76: Global Sparkling Water Market Volume liter Forecast, by Distribution Channel 2020 & 2033
- Table 77: Global Sparkling Water Market Revenue Million Forecast, by Country 2020 & 2033
- Table 78: Global Sparkling Water Market Volume liter Forecast, by Country 2020 & 2033
- Table 79: China Sparkling Water Market Revenue (Million) Forecast, by Application 2020 & 2033
- Table 80: China Sparkling Water Market Volume (liter ) Forecast, by Application 2020 & 2033
- Table 81: India Sparkling Water Market Revenue (Million) Forecast, by Application 2020 & 2033
- Table 82: India Sparkling Water Market Volume (liter ) Forecast, by Application 2020 & 2033
- Table 83: Japan Sparkling Water Market Revenue (Million) Forecast, by Application 2020 & 2033
- Table 84: Japan Sparkling Water Market Volume (liter ) Forecast, by Application 2020 & 2033
- Table 85: South Korea Sparkling Water Market Revenue (Million) Forecast, by Application 2020 & 2033
- Table 86: South Korea Sparkling Water Market Volume (liter ) Forecast, by Application 2020 & 2033
- Table 87: ASEAN Sparkling Water Market Revenue (Million) Forecast, by Application 2020 & 2033
- Table 88: ASEAN Sparkling Water Market Volume (liter ) Forecast, by Application 2020 & 2033
- Table 89: Oceania Sparkling Water Market Revenue (Million) Forecast, by Application 2020 & 2033
- Table 90: Oceania Sparkling Water Market Volume (liter ) Forecast, by Application 2020 & 2033
- Table 91: Rest of Asia Pacific Sparkling Water Market Revenue (Million) Forecast, by Application 2020 & 2033
- Table 92: Rest of Asia Pacific Sparkling Water Market Volume (liter ) Forecast, by Application 2020 & 2033
Frequently Asked Questions
1. What is the projected Compound Annual Growth Rate (CAGR) of the Sparkling Water Market?
The projected CAGR is approximately 8.15%.
2. Which companies are prominent players in the Sparkling Water Market?
Key companies in the market include Nestle SA, Promag, Asahi Group Holdings Ltd, PT INDOFOOD SUKSES MAKMUR Tbk, Tanobel Food, Fraser and Neave Limited, Danone S A, Blue Band, The Coca-Cola Company, Indo Food, Kosme Group*List Not Exhaustive.
3. What are the main segments of the Sparkling Water Market?
The market segments include Type, Distribution Channel.
4. Can you provide details about the market size?
The market size is estimated to be USD 32740 Million as of 2022.
5. What are some drivers contributing to market growth?
Increasing Demand for Alcoholic Beverages; Health Conscious Consumers Accelerating Demand For Gluten-free Beer.
6. What are the notable trends driving market growth?
Increasing Expenditure on Drinking Water Due to Lack of Safe Drinking Water Availability.
7. Are there any restraints impacting market growth?
Threat From Other Alcoholic Beverages.
8. Can you provide examples of recent developments in the market?
August 2022: Kosme Group has launched Jiwater in Indonesia. Jiwater is natural artesian water that has undergone Japanese technological processing. The pH range of the new mineral water is between 7.5 and 8.
9. What pricing options are available for accessing the report?
Pricing options include single-user, multi-user, and enterprise licenses priced at USD 3800, USD 4500, and USD 5800 respectively.
10. Is the market size provided in terms of value or volume?
The market size is provided in terms of value, measured in Million and volume, measured in liter .
11. Are there any specific market keywords associated with the report?
Yes, the market keyword associated with the report is "Sparkling Water Market," which aids in identifying and referencing the specific market segment covered.
12. How do I determine which pricing option suits my needs best?
The pricing options vary based on user requirements and access needs. Individual users may opt for single-user licenses, while businesses requiring broader access may choose multi-user or enterprise licenses for cost-effective access to the report.
13. Are there any additional resources or data provided in the Sparkling Water Market report?
While the report offers comprehensive insights, it's advisable to review the specific contents or supplementary materials provided to ascertain if additional resources or data are available.
14. How can I stay updated on further developments or reports in the Sparkling Water Market?
To stay informed about further developments, trends, and reports in the Sparkling Water Market, consider subscribing to industry newsletters, following relevant companies and organizations, or regularly checking reputable industry news sources and publications.
Methodology
Step 1 - Identification of Relevant Samples Size from Population Database


Step 2 - Approaches for Defining Global Market Size (Value, Volume* & Price*)

Note*: In applicable scenarios
Step 3 - Data Sources
Primary Research
- Web Analytics
- Survey Reports
- Research Institute
- Latest Research Reports
- Opinion Leaders
Secondary Research
- Annual Reports
- White Paper
- Latest Press Release
- Industry Association
- Paid Database
- Investor Presentations

Step 4 - Data Triangulation
Involves using different sources of information in order to increase the validity of a study
These sources are likely to be stakeholders in a program - participants, other researchers, program staff, other community members, and so on.
Then we put all data in single framework & apply various statistical tools to find out the dynamic on the market.
During the analysis stage, feedback from the stakeholder groups would be compared to determine areas of agreement as well as areas of divergence