

Key Insights
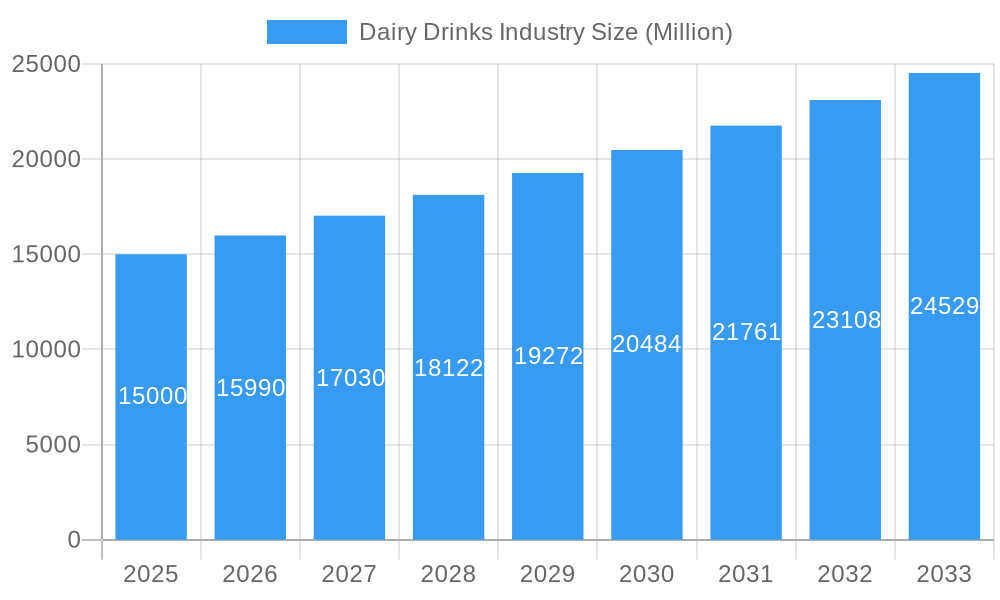
The global dairy drinks market, valued at $87.86 billion in 2025, is projected for substantial growth at a Compound Annual Growth Rate (CAGR) of 6% from 2025 to 2033. This expansion is driven by increasing consumer demand for convenient and nutritious beverages. Growing health consciousness fuels demand for probiotic and vitamin-enriched dairy drinks, boosting flavored and functional product segments. The rise of plant-based alternatives also contributes to overall market expansion. Product innovation, including new flavors, packaging, and functional benefits, further stimulates growth. Expanded retail channels, especially online, enhance market accessibility. However, fluctuating milk prices, stringent regulations, and lactose intolerance concerns present potential restraints. North America and Europe exhibit strong performance, while Asia-Pacific is a key growth region due to population increase and rising disposable incomes.
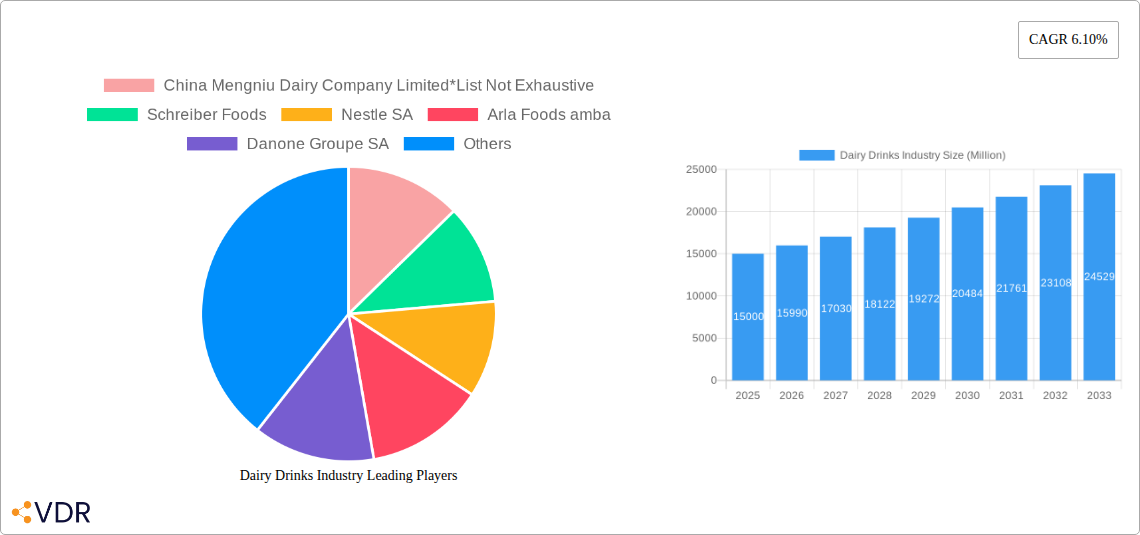
Dairy Drinks Industry Market Size (In Billion)
Market segmentation highlights milk as the leading category, followed by yogurt and kefir, with plant-based drinks categorized under 'others.' Flavored dairy drinks are more popular than unflavored options. Distribution is diverse, encompassing supermarkets, convenience stores, specialty stores, and online channels. Key industry players, including Mengniu, Schreiber Foods, Nestle, Arla Foods, and Danone, are driving market evolution through innovation and strategic expansion. The competitive landscape necessitates ongoing innovation and strong branding. Future growth will hinge on managing supply chain costs, adapting to consumer preferences, and navigating regulatory changes.
Dairy Drinks Industry Company Market Share
Dairy Drinks Industry Market Report: 2019-2033
This comprehensive report provides a detailed analysis of the global dairy drinks market, encompassing historical data (2019-2024), current estimates (2025), and future forecasts (2025-2033). We delve into market dynamics, growth trends, regional performance, product landscapes, and key player strategies within the dairy drinks sector, covering parent markets (Dairy Products) and child markets (Milk, Yogurt, Kefir, etc.) to offer a holistic view. The report utilizes a robust methodology, incorporating both quantitative and qualitative data, to deliver actionable insights for industry professionals.
Dairy Drinks Industry Market Dynamics & Structure
This section analyzes the competitive landscape of the dairy drinks market, exploring market concentration, technological innovation, regulatory influences, substitute products, end-user demographics, and merger & acquisition (M&A) activity. We examine the interplay of these factors to understand the market’s structure and its evolution.
- Market Concentration: The global dairy drinks market exhibits a moderately concentrated structure, with a few major players holding significant market share. xx% of the market is controlled by the top 5 players in 2025.
- Technological Innovation: Technological advancements in processing, packaging, and preservation are driving efficiency and product diversification. The adoption of sustainable packaging solutions is also gaining traction.
- Regulatory Frameworks: Stringent regulations regarding food safety, labeling, and ingredients significantly impact market operations. Varied regulations across different geographies add complexity.
- Competitive Product Substitutes: Plant-based alternatives, such as soy milk and almond milk, pose a competitive threat, capturing an estimated xx% market share in 2025.
- End-User Demographics: Growing health consciousness and demand for functional dairy drinks are shaping consumer preferences, driving innovation in nutritional value and product formulations.
- M&A Trends: The dairy drinks industry witnesses frequent M&A activities, with companies strategically acquiring smaller players to expand their product portfolio and market presence. An estimated xx M&A deals were concluded in the period 2019-2024.
Dairy Drinks Industry Growth Trends & Insights
This section provides a detailed analysis of the dairy drinks market’s growth trajectory, encompassing market size evolution, adoption rates, technological disruptions, and shifting consumer preferences. Leveraging extensive secondary research and market intelligence, we project a CAGR of xx% for the forecast period (2025-2033). The increasing demand for convenience, health-conscious options, and the rising disposable incomes in developing economies are key growth drivers. Technological advancements, such as improved preservation techniques and the introduction of innovative product formats, contribute significantly to market expansion.
Dominant Regions, Countries, or Segments in Dairy Drinks Industry
This section identifies the leading regions, countries, and market segments (Type: Milk, Yogurt, Kefir, Others; Category: Flavoured, Unflavoured; Distribution Channel: Supermarkets/hypermarkets, Convenience stores, Specialty Stores, Online Channels, Others) driving market growth.
- Leading Region: North America and Europe remain dominant regions due to high per capita consumption and established distribution networks. However, Asia-Pacific is experiencing rapid growth fueled by rising disposable incomes and changing lifestyles.
- Leading Country: The USA holds the largest market share in 2025, followed by China and India.
- Leading Segment (Type): Milk remains the dominant segment, although Yogurt and Kefir are showing strong growth potential due to their perceived health benefits.
- Leading Segment (Category): Flavored dairy drinks hold a larger market share compared to unflavored options, driven by consumer preference for variety and taste.
- Leading Segment (Distribution): Supermarkets/hypermarkets remain the primary distribution channel due to their widespread accessibility, followed by convenience stores and increasingly, online channels.
Key drivers include robust economic growth in emerging markets, improving infrastructure, and favorable government policies supporting the dairy industry.
Dairy Drinks Industry Product Landscape
The dairy drinks market showcases a diverse product landscape featuring innovations in flavors, formats, and functional ingredients. Probiotic-enriched yogurts, high-protein milk alternatives, and convenient single-serving options are gaining popularity. Technological advancements like High Pressure Processing (HPP) enhance shelf life and maintain product quality. Unique selling propositions include organic certifications, natural ingredients, and functional benefits tailored to specific health needs.
Key Drivers, Barriers & Challenges in Dairy Drinks Industry
Key Drivers: Increasing consumer awareness of health and wellness, rising disposable incomes, expanding distribution networks, and technological innovations in product development and packaging drive market growth. Government initiatives promoting dairy consumption in certain regions also contribute positively.
Key Challenges: Fluctuating raw material prices, stringent regulatory compliance requirements, and intense competition from substitutes (plant-based alternatives) pose significant challenges. Supply chain disruptions and the impact of geopolitical instability further complicate the market dynamics. Estimated losses due to supply chain disruptions in 2024 reached xx Million units.
Emerging Opportunities in Dairy Drinks Industry
Emerging opportunities lie in expanding into untapped markets, particularly in developing economies. The growing demand for functional dairy drinks with added health benefits presents significant opportunities for innovation. Personalized nutrition and customized dairy products cater to individual needs and preferences. Sustainable and eco-friendly packaging solutions also represent a key opportunity for growth.
Growth Accelerators in the Dairy Drinks Industry
Strategic partnerships, collaborations, and technological breakthroughs in processing and packaging are key accelerators. Expansion into new geographical markets, particularly in Asia and Africa, holds immense growth potential. Product diversification through the development of novel dairy-based beverages and functional foods further contributes to market expansion.
Key Players Shaping the Dairy Drinks Industry Market
- China Mengniu Dairy Company Limited
- Schreiber Foods
- Nestle SA
- Arla Foods amba
- Danone Groupe SA
- Chr Hansen
- Pillars
- Morinaga Nutritional Foods Inc
- Chobani LLC
Notable Milestones in Dairy Drinks Industry Sector
- 2020: Nestle launches a range of plant-based dairy alternatives.
- 2021: Danone acquires a smaller dairy company to expand its product portfolio.
- 2022: Significant investment in sustainable packaging solutions across the industry.
- 2023: Launch of several functional dairy drinks with added health benefits.
- 2024: Increased adoption of digital marketing strategies by major players.
In-Depth Dairy Drinks Industry Market Outlook
The dairy drinks market is poised for sustained growth driven by consumer preference shifts, technological advancements, and expanding distribution networks. Strategic acquisitions, innovative product development, and a focus on sustainability will be crucial for success. The market is expected to reach xx Million units by 2033, presenting significant opportunities for established players and new entrants alike.
Dairy Drinks Industry Segmentation
-
1. Type
- 1.1. Milk
- 1.2. Yogurt
- 1.3. Kefir
- 1.4. Others
-
2. Category
- 2.1. Flavoured drink
- 2.2. Unflavored drink
-
3. Distibution Channel
- 3.1. Supermarkets/hypermarkets
- 3.2. Convenience stores
- 3.3. Specialty Stores
- 3.4. Online Channels
- 3.5. Others
Dairy Drinks Industry Segmentation By Geography
-
1. North America
- 1.1. United States
- 1.2. Canada
- 1.3. Mexico
- 1.4. Rest of North America
-
2. Europe
- 2.1. United Kingdom
- 2.2. Germany
- 2.3. France
- 2.4. Russia
- 2.5. Italy
- 2.6. Spain
- 2.7. Rest of Europe
-
3. Asia Pacific
- 3.1. India
- 3.2. China
- 3.3. Japan
- 3.4. Australia
- 3.5. Rest of Asia Pacific
-
4. South America
- 4.1. Brazil
- 4.2. Argentina
- 4.3. Rest of South America
- 5. Middle East
-
6. South Africa
- 6.1. Saudi Arabia
- 6.2. Rest of Middle East
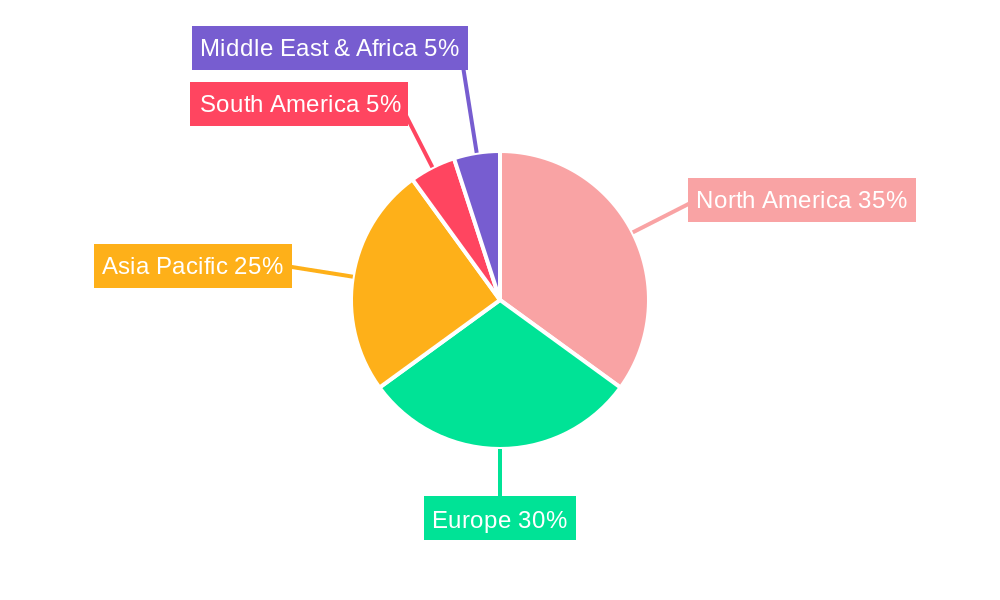
Dairy Drinks Industry Regional Market Share
Geographic Coverage of Dairy Drinks Industry
Dairy Drinks Industry REPORT HIGHLIGHTS
| Aspects | Details |
|---|---|
| Study Period | 2020-2034 |
| Base Year | 2025 |
| Estimated Year | 2026 |
| Forecast Period | 2026-2034 |
| Historical Period | 2020-2025 |
| Growth Rate | CAGR of 6% from 2020-2034 |
| Segmentation |
|
Table of Contents
- 1. Introduction
- 1.1. Research Scope
- 1.2. Market Segmentation
- 1.3. Research Objective
- 1.4. Definitions and Assumptions
- 2. Executive Summary
- 2.1. Market Snapshot
- 3. Market Dynamics
- 3.1. Market Drivers
- 3.2. Market Restrains
- 3.3. Market Trends
- 3.4. Market Opportunities
- 4. Market Factor Analysis
- 4.1. Porters Five Forces
- 4.1.1. Bargaining Power of Suppliers
- 4.1.2. Bargaining Power of Buyers
- 4.1.3. Threat of New Entrants
- 4.1.4. Threat of Substitutes
- 4.1.5. Competitive Rivalry
- 4.2. PESTEL analysis
- 4.3. BCG Analysis
- 4.3.1. Stars (High Growth, High Market Share)
- 4.3.2. Cash Cows (Low Growth, High Market Share)
- 4.3.3. Question Mark (High Growth, Low Market Share)
- 4.3.4. Dogs (Low Growth, Low Market Share)
- 4.4. Ansoff Matrix Analysis
- 4.5. Supply Chain Analysis
- 4.6. Regulatory Landscape
- 4.7. Current Market Potential and Opportunity Assessment (TAM–SAM–SOM Framework)
- 4.8. VDR Analyst Note
- 4.1. Porters Five Forces
- 5. Market Analysis, Insights and Forecast 2021-2033
- 5.1. Market Analysis, Insights and Forecast - by Type
- 5.1.1. Milk
- 5.1.2. Yogurt
- 5.1.3. Kefir
- 5.1.4. Others
- 5.2. Market Analysis, Insights and Forecast - by Category
- 5.2.1. Flavoured drink
- 5.2.2. Unflavored drink
- 5.3. Market Analysis, Insights and Forecast - by Distibution Channel
- 5.3.1. Supermarkets/hypermarkets
- 5.3.2. Convenience stores
- 5.3.3. Specialty Stores
- 5.3.4. Online Channels
- 5.3.5. Others
- 5.4. Market Analysis, Insights and Forecast - by Region
- 5.4.1. North America
- 5.4.2. Europe
- 5.4.3. Asia Pacific
- 5.4.4. South America
- 5.4.5. Middle East
- 5.4.6. South Africa
- 5.1. Market Analysis, Insights and Forecast - by Type
- 6. Global Dairy Drinks Industry Analysis, Insights and Forecast, 2021-2033
- 6.1. Market Analysis, Insights and Forecast - by Type
- 6.1.1. Milk
- 6.1.2. Yogurt
- 6.1.3. Kefir
- 6.1.4. Others
- 6.2. Market Analysis, Insights and Forecast - by Category
- 6.2.1. Flavoured drink
- 6.2.2. Unflavored drink
- 6.3. Market Analysis, Insights and Forecast - by Distibution Channel
- 6.3.1. Supermarkets/hypermarkets
- 6.3.2. Convenience stores
- 6.3.3. Specialty Stores
- 6.3.4. Online Channels
- 6.3.5. Others
- 6.1. Market Analysis, Insights and Forecast - by Type
- 7. North America Dairy Drinks Industry Analysis, Insights and Forecast, 2021-2033
- 7.1. Market Analysis, Insights and Forecast - by Type
- 7.1.1. Milk
- 7.1.2. Yogurt
- 7.1.3. Kefir
- 7.1.4. Others
- 7.2. Market Analysis, Insights and Forecast - by Category
- 7.2.1. Flavoured drink
- 7.2.2. Unflavored drink
- 7.3. Market Analysis, Insights and Forecast - by Distibution Channel
- 7.3.1. Supermarkets/hypermarkets
- 7.3.2. Convenience stores
- 7.3.3. Specialty Stores
- 7.3.4. Online Channels
- 7.3.5. Others
- 7.1. Market Analysis, Insights and Forecast - by Type
- 8. Europe Dairy Drinks Industry Analysis, Insights and Forecast, 2021-2033
- 8.1. Market Analysis, Insights and Forecast - by Type
- 8.1.1. Milk
- 8.1.2. Yogurt
- 8.1.3. Kefir
- 8.1.4. Others
- 8.2. Market Analysis, Insights and Forecast - by Category
- 8.2.1. Flavoured drink
- 8.2.2. Unflavored drink
- 8.3. Market Analysis, Insights and Forecast - by Distibution Channel
- 8.3.1. Supermarkets/hypermarkets
- 8.3.2. Convenience stores
- 8.3.3. Specialty Stores
- 8.3.4. Online Channels
- 8.3.5. Others
- 8.1. Market Analysis, Insights and Forecast - by Type
- 9. Asia Pacific Dairy Drinks Industry Analysis, Insights and Forecast, 2021-2033
- 9.1. Market Analysis, Insights and Forecast - by Type
- 9.1.1. Milk
- 9.1.2. Yogurt
- 9.1.3. Kefir
- 9.1.4. Others
- 9.2. Market Analysis, Insights and Forecast - by Category
- 9.2.1. Flavoured drink
- 9.2.2. Unflavored drink
- 9.3. Market Analysis, Insights and Forecast - by Distibution Channel
- 9.3.1. Supermarkets/hypermarkets
- 9.3.2. Convenience stores
- 9.3.3. Specialty Stores
- 9.3.4. Online Channels
- 9.3.5. Others
- 9.1. Market Analysis, Insights and Forecast - by Type
- 10. South America Dairy Drinks Industry Analysis, Insights and Forecast, 2021-2033
- 10.1. Market Analysis, Insights and Forecast - by Type
- 10.1.1. Milk
- 10.1.2. Yogurt
- 10.1.3. Kefir
- 10.1.4. Others
- 10.2. Market Analysis, Insights and Forecast - by Category
- 10.2.1. Flavoured drink
- 10.2.2. Unflavored drink
- 10.3. Market Analysis, Insights and Forecast - by Distibution Channel
- 10.3.1. Supermarkets/hypermarkets
- 10.3.2. Convenience stores
- 10.3.3. Specialty Stores
- 10.3.4. Online Channels
- 10.3.5. Others
- 10.1. Market Analysis, Insights and Forecast - by Type
- 11. Middle East Dairy Drinks Industry Analysis, Insights and Forecast, 2021-2033
- 11.1. Market Analysis, Insights and Forecast - by Type
- 11.1.1. Milk
- 11.1.2. Yogurt
- 11.1.3. Kefir
- 11.1.4. Others
- 11.2. Market Analysis, Insights and Forecast - by Category
- 11.2.1. Flavoured drink
- 11.2.2. Unflavored drink
- 11.3. Market Analysis, Insights and Forecast - by Distibution Channel
- 11.3.1. Supermarkets/hypermarkets
- 11.3.2. Convenience stores
- 11.3.3. Specialty Stores
- 11.3.4. Online Channels
- 11.3.5. Others
- 11.1. Market Analysis, Insights and Forecast - by Type
- 12. South Africa Dairy Drinks Industry Analysis, Insights and Forecast, 2021-2033
- 12.1. Market Analysis, Insights and Forecast - by Type
- 12.1.1. Milk
- 12.1.2. Yogurt
- 12.1.3. Kefir
- 12.1.4. Others
- 12.2. Market Analysis, Insights and Forecast - by Category
- 12.2.1. Flavoured drink
- 12.2.2. Unflavored drink
- 12.3. Market Analysis, Insights and Forecast - by Distibution Channel
- 12.3.1. Supermarkets/hypermarkets
- 12.3.2. Convenience stores
- 12.3.3. Specialty Stores
- 12.3.4. Online Channels
- 12.3.5. Others
- 12.1. Market Analysis, Insights and Forecast - by Type
- 13. Competitive Analysis
- 13.1. Company Profiles
- 13.1.1 China Mengniu Dairy Company Limited*List Not Exhaustive
- 13.1.1.1. Company Overview
- 13.1.1.2. Products
- 13.1.1.3. Company Financials
- 13.1.1.4. SWOT Analysis
- 13.1.2 Schreiber Foods
- 13.1.2.1. Company Overview
- 13.1.2.2. Products
- 13.1.2.3. Company Financials
- 13.1.2.4. SWOT Analysis
- 13.1.3 Nestle SA
- 13.1.3.1. Company Overview
- 13.1.3.2. Products
- 13.1.3.3. Company Financials
- 13.1.3.4. SWOT Analysis
- 13.1.4 Arla Foods amba
- 13.1.4.1. Company Overview
- 13.1.4.2. Products
- 13.1.4.3. Company Financials
- 13.1.4.4. SWOT Analysis
- 13.1.5 Danone Groupe SA
- 13.1.5.1. Company Overview
- 13.1.5.2. Products
- 13.1.5.3. Company Financials
- 13.1.5.4. SWOT Analysis
- 13.1.6 Chr Hansen
- 13.1.6.1. Company Overview
- 13.1.6.2. Products
- 13.1.6.3. Company Financials
- 13.1.6.4. SWOT Analysis
- 13.1.7 Pillars
- 13.1.7.1. Company Overview
- 13.1.7.2. Products
- 13.1.7.3. Company Financials
- 13.1.7.4. SWOT Analysis
- 13.1.8 Morinaga Nutritional Foods Inc
- 13.1.8.1. Company Overview
- 13.1.8.2. Products
- 13.1.8.3. Company Financials
- 13.1.8.4. SWOT Analysis
- 13.1.9 Chobani LLC
- 13.1.9.1. Company Overview
- 13.1.9.2. Products
- 13.1.9.3. Company Financials
- 13.1.9.4. SWOT Analysis
- 13.1.1 China Mengniu Dairy Company Limited*List Not Exhaustive
- 13.2. Market Entropy
- 13.2.1 Company's Key Areas Served
- 13.2.2 Recent Developments
- 13.3. Company Market Share Analysis 2025
- 13.3.1 Top 5 Companies Market Share Analysis
- 13.3.2 Top 3 Companies Market Share Analysis
- 13.4. List of Potential Customers
- 14. Research Methodology
List of Figures
- Figure 1: Global Dairy Drinks Industry Revenue Breakdown (billion, %) by Region 2025 & 2033
- Figure 2: North America Dairy Drinks Industry Revenue (billion), by Type 2025 & 2033
- Figure 3: North America Dairy Drinks Industry Revenue Share (%), by Type 2025 & 2033
- Figure 4: North America Dairy Drinks Industry Revenue (billion), by Category 2025 & 2033
- Figure 5: North America Dairy Drinks Industry Revenue Share (%), by Category 2025 & 2033
- Figure 6: North America Dairy Drinks Industry Revenue (billion), by Distibution Channel 2025 & 2033
- Figure 7: North America Dairy Drinks Industry Revenue Share (%), by Distibution Channel 2025 & 2033
- Figure 8: North America Dairy Drinks Industry Revenue (billion), by Country 2025 & 2033
- Figure 9: North America Dairy Drinks Industry Revenue Share (%), by Country 2025 & 2033
- Figure 10: Europe Dairy Drinks Industry Revenue (billion), by Type 2025 & 2033
- Figure 11: Europe Dairy Drinks Industry Revenue Share (%), by Type 2025 & 2033
- Figure 12: Europe Dairy Drinks Industry Revenue (billion), by Category 2025 & 2033
- Figure 13: Europe Dairy Drinks Industry Revenue Share (%), by Category 2025 & 2033
- Figure 14: Europe Dairy Drinks Industry Revenue (billion), by Distibution Channel 2025 & 2033
- Figure 15: Europe Dairy Drinks Industry Revenue Share (%), by Distibution Channel 2025 & 2033
- Figure 16: Europe Dairy Drinks Industry Revenue (billion), by Country 2025 & 2033
- Figure 17: Europe Dairy Drinks Industry Revenue Share (%), by Country 2025 & 2033
- Figure 18: Asia Pacific Dairy Drinks Industry Revenue (billion), by Type 2025 & 2033
- Figure 19: Asia Pacific Dairy Drinks Industry Revenue Share (%), by Type 2025 & 2033
- Figure 20: Asia Pacific Dairy Drinks Industry Revenue (billion), by Category 2025 & 2033
- Figure 21: Asia Pacific Dairy Drinks Industry Revenue Share (%), by Category 2025 & 2033
- Figure 22: Asia Pacific Dairy Drinks Industry Revenue (billion), by Distibution Channel 2025 & 2033
- Figure 23: Asia Pacific Dairy Drinks Industry Revenue Share (%), by Distibution Channel 2025 & 2033
- Figure 24: Asia Pacific Dairy Drinks Industry Revenue (billion), by Country 2025 & 2033
- Figure 25: Asia Pacific Dairy Drinks Industry Revenue Share (%), by Country 2025 & 2033
- Figure 26: South America Dairy Drinks Industry Revenue (billion), by Type 2025 & 2033
- Figure 27: South America Dairy Drinks Industry Revenue Share (%), by Type 2025 & 2033
- Figure 28: South America Dairy Drinks Industry Revenue (billion), by Category 2025 & 2033
- Figure 29: South America Dairy Drinks Industry Revenue Share (%), by Category 2025 & 2033
- Figure 30: South America Dairy Drinks Industry Revenue (billion), by Distibution Channel 2025 & 2033
- Figure 31: South America Dairy Drinks Industry Revenue Share (%), by Distibution Channel 2025 & 2033
- Figure 32: South America Dairy Drinks Industry Revenue (billion), by Country 2025 & 2033
- Figure 33: South America Dairy Drinks Industry Revenue Share (%), by Country 2025 & 2033
- Figure 34: Middle East Dairy Drinks Industry Revenue (billion), by Type 2025 & 2033
- Figure 35: Middle East Dairy Drinks Industry Revenue Share (%), by Type 2025 & 2033
- Figure 36: Middle East Dairy Drinks Industry Revenue (billion), by Category 2025 & 2033
- Figure 37: Middle East Dairy Drinks Industry Revenue Share (%), by Category 2025 & 2033
- Figure 38: Middle East Dairy Drinks Industry Revenue (billion), by Distibution Channel 2025 & 2033
- Figure 39: Middle East Dairy Drinks Industry Revenue Share (%), by Distibution Channel 2025 & 2033
- Figure 40: Middle East Dairy Drinks Industry Revenue (billion), by Country 2025 & 2033
- Figure 41: Middle East Dairy Drinks Industry Revenue Share (%), by Country 2025 & 2033
- Figure 42: South Africa Dairy Drinks Industry Revenue (billion), by Type 2025 & 2033
- Figure 43: South Africa Dairy Drinks Industry Revenue Share (%), by Type 2025 & 2033
- Figure 44: South Africa Dairy Drinks Industry Revenue (billion), by Category 2025 & 2033
- Figure 45: South Africa Dairy Drinks Industry Revenue Share (%), by Category 2025 & 2033
- Figure 46: South Africa Dairy Drinks Industry Revenue (billion), by Distibution Channel 2025 & 2033
- Figure 47: South Africa Dairy Drinks Industry Revenue Share (%), by Distibution Channel 2025 & 2033
- Figure 48: South Africa Dairy Drinks Industry Revenue (billion), by Country 2025 & 2033
- Figure 49: South Africa Dairy Drinks Industry Revenue Share (%), by Country 2025 & 2033
List of Tables
- Table 1: Global Dairy Drinks Industry Revenue billion Forecast, by Type 2020 & 2033
- Table 2: Global Dairy Drinks Industry Revenue billion Forecast, by Category 2020 & 2033
- Table 3: Global Dairy Drinks Industry Revenue billion Forecast, by Distibution Channel 2020 & 2033
- Table 4: Global Dairy Drinks Industry Revenue billion Forecast, by Region 2020 & 2033
- Table 5: Global Dairy Drinks Industry Revenue billion Forecast, by Type 2020 & 2033
- Table 6: Global Dairy Drinks Industry Revenue billion Forecast, by Category 2020 & 2033
- Table 7: Global Dairy Drinks Industry Revenue billion Forecast, by Distibution Channel 2020 & 2033
- Table 8: Global Dairy Drinks Industry Revenue billion Forecast, by Country 2020 & 2033
- Table 9: United States Dairy Drinks Industry Revenue (billion) Forecast, by Application 2020 & 2033
- Table 10: Canada Dairy Drinks Industry Revenue (billion) Forecast, by Application 2020 & 2033
- Table 11: Mexico Dairy Drinks Industry Revenue (billion) Forecast, by Application 2020 & 2033
- Table 12: Rest of North America Dairy Drinks Industry Revenue (billion) Forecast, by Application 2020 & 2033
- Table 13: Global Dairy Drinks Industry Revenue billion Forecast, by Type 2020 & 2033
- Table 14: Global Dairy Drinks Industry Revenue billion Forecast, by Category 2020 & 2033
- Table 15: Global Dairy Drinks Industry Revenue billion Forecast, by Distibution Channel 2020 & 2033
- Table 16: Global Dairy Drinks Industry Revenue billion Forecast, by Country 2020 & 2033
- Table 17: United Kingdom Dairy Drinks Industry Revenue (billion) Forecast, by Application 2020 & 2033
- Table 18: Germany Dairy Drinks Industry Revenue (billion) Forecast, by Application 2020 & 2033
- Table 19: France Dairy Drinks Industry Revenue (billion) Forecast, by Application 2020 & 2033
- Table 20: Russia Dairy Drinks Industry Revenue (billion) Forecast, by Application 2020 & 2033
- Table 21: Italy Dairy Drinks Industry Revenue (billion) Forecast, by Application 2020 & 2033
- Table 22: Spain Dairy Drinks Industry Revenue (billion) Forecast, by Application 2020 & 2033
- Table 23: Rest of Europe Dairy Drinks Industry Revenue (billion) Forecast, by Application 2020 & 2033
- Table 24: Global Dairy Drinks Industry Revenue billion Forecast, by Type 2020 & 2033
- Table 25: Global Dairy Drinks Industry Revenue billion Forecast, by Category 2020 & 2033
- Table 26: Global Dairy Drinks Industry Revenue billion Forecast, by Distibution Channel 2020 & 2033
- Table 27: Global Dairy Drinks Industry Revenue billion Forecast, by Country 2020 & 2033
- Table 28: India Dairy Drinks Industry Revenue (billion) Forecast, by Application 2020 & 2033
- Table 29: China Dairy Drinks Industry Revenue (billion) Forecast, by Application 2020 & 2033
- Table 30: Japan Dairy Drinks Industry Revenue (billion) Forecast, by Application 2020 & 2033
- Table 31: Australia Dairy Drinks Industry Revenue (billion) Forecast, by Application 2020 & 2033
- Table 32: Rest of Asia Pacific Dairy Drinks Industry Revenue (billion) Forecast, by Application 2020 & 2033
- Table 33: Global Dairy Drinks Industry Revenue billion Forecast, by Type 2020 & 2033
- Table 34: Global Dairy Drinks Industry Revenue billion Forecast, by Category 2020 & 2033
- Table 35: Global Dairy Drinks Industry Revenue billion Forecast, by Distibution Channel 2020 & 2033
- Table 36: Global Dairy Drinks Industry Revenue billion Forecast, by Country 2020 & 2033
- Table 37: Brazil Dairy Drinks Industry Revenue (billion) Forecast, by Application 2020 & 2033
- Table 38: Argentina Dairy Drinks Industry Revenue (billion) Forecast, by Application 2020 & 2033
- Table 39: Rest of South America Dairy Drinks Industry Revenue (billion) Forecast, by Application 2020 & 2033
- Table 40: Global Dairy Drinks Industry Revenue billion Forecast, by Type 2020 & 2033
- Table 41: Global Dairy Drinks Industry Revenue billion Forecast, by Category 2020 & 2033
- Table 42: Global Dairy Drinks Industry Revenue billion Forecast, by Distibution Channel 2020 & 2033
- Table 43: Global Dairy Drinks Industry Revenue billion Forecast, by Country 2020 & 2033
- Table 44: Global Dairy Drinks Industry Revenue billion Forecast, by Type 2020 & 2033
- Table 45: Global Dairy Drinks Industry Revenue billion Forecast, by Category 2020 & 2033
- Table 46: Global Dairy Drinks Industry Revenue billion Forecast, by Distibution Channel 2020 & 2033
- Table 47: Global Dairy Drinks Industry Revenue billion Forecast, by Country 2020 & 2033
- Table 48: Saudi Arabia Dairy Drinks Industry Revenue (billion) Forecast, by Application 2020 & 2033
- Table 49: Rest of Middle East Dairy Drinks Industry Revenue (billion) Forecast, by Application 2020 & 2033
Frequently Asked Questions
1. What is the projected Compound Annual Growth Rate (CAGR) of the Dairy Drinks Industry?
The projected CAGR is approximately 6%.
2. Which companies are prominent players in the Dairy Drinks Industry?
Key companies in the market include China Mengniu Dairy Company Limited*List Not Exhaustive, Schreiber Foods, Nestle SA, Arla Foods amba, Danone Groupe SA, Chr Hansen, Pillars, Morinaga Nutritional Foods Inc, Chobani LLC.
3. What are the main segments of the Dairy Drinks Industry?
The market segments include Type, Category, Distibution Channel.
4. Can you provide details about the market size?
The market size is estimated to be USD 87.86 billion as of 2022.
5. What are some drivers contributing to market growth?
Growth In Foodservice Expenditure and Tourism Sector; Premiumization with the Growth of Fortified and Flavored Water.
6. What are the notable trends driving market growth?
Rising Demand for Drinkable Yogurt.
7. Are there any restraints impacting market growth?
Concerns Regarding Plastic Waste and the Rising Inclination Toward Tap Water.
8. Can you provide examples of recent developments in the market?
N/A
9. What pricing options are available for accessing the report?
Pricing options include single-user, multi-user, and enterprise licenses priced at USD 4750, USD 5250, and USD 8750 respectively.
10. Is the market size provided in terms of value or volume?
The market size is provided in terms of value, measured in billion.
11. Are there any specific market keywords associated with the report?
Yes, the market keyword associated with the report is "Dairy Drinks Industry," which aids in identifying and referencing the specific market segment covered.
12. How do I determine which pricing option suits my needs best?
The pricing options vary based on user requirements and access needs. Individual users may opt for single-user licenses, while businesses requiring broader access may choose multi-user or enterprise licenses for cost-effective access to the report.
13. Are there any additional resources or data provided in the Dairy Drinks Industry report?
While the report offers comprehensive insights, it's advisable to review the specific contents or supplementary materials provided to ascertain if additional resources or data are available.
14. How can I stay updated on further developments or reports in the Dairy Drinks Industry?
To stay informed about further developments, trends, and reports in the Dairy Drinks Industry, consider subscribing to industry newsletters, following relevant companies and organizations, or regularly checking reputable industry news sources and publications.
Methodology
Step 1 - Identification of Relevant Samples Size from Population Database


Step 2 - Approaches for Defining Global Market Size (Value, Volume* & Price*)

Note*: In applicable scenarios
Step 3 - Data Sources
Primary Research
- Web Analytics
- Survey Reports
- Research Institute
- Latest Research Reports
- Opinion Leaders
Secondary Research
- Annual Reports
- White Paper
- Latest Press Release
- Industry Association
- Paid Database
- Investor Presentations

Step 4 - Data Triangulation
Involves using different sources of information in order to increase the validity of a study
These sources are likely to be stakeholders in a program - participants, other researchers, program staff, other community members, and so on.
Then we put all data in single framework & apply various statistical tools to find out the dynamic on the market.
During the analysis stage, feedback from the stakeholder groups would be compared to determine areas of agreement as well as areas of divergence