
Key Insights
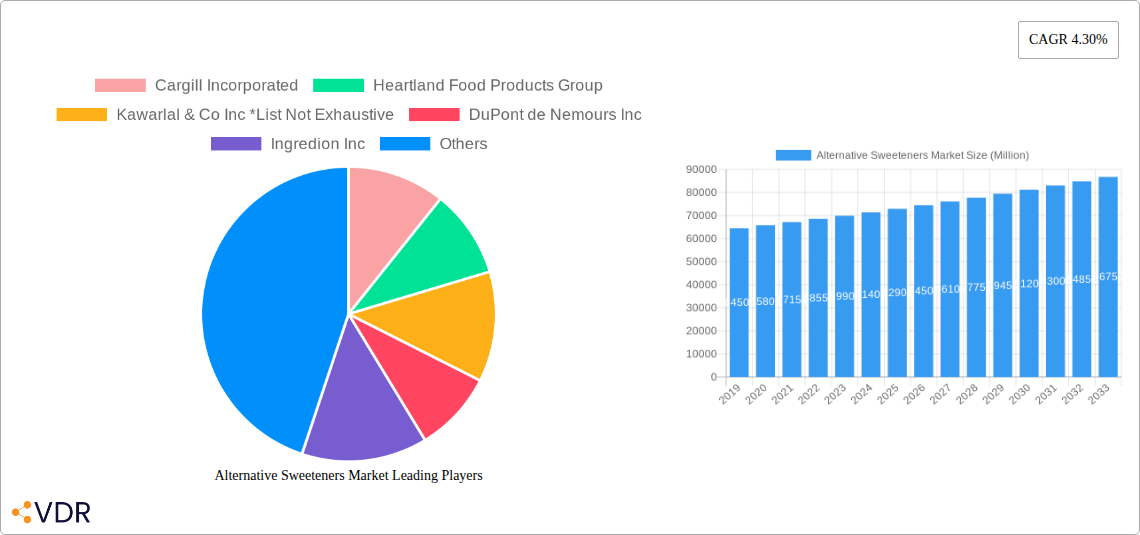
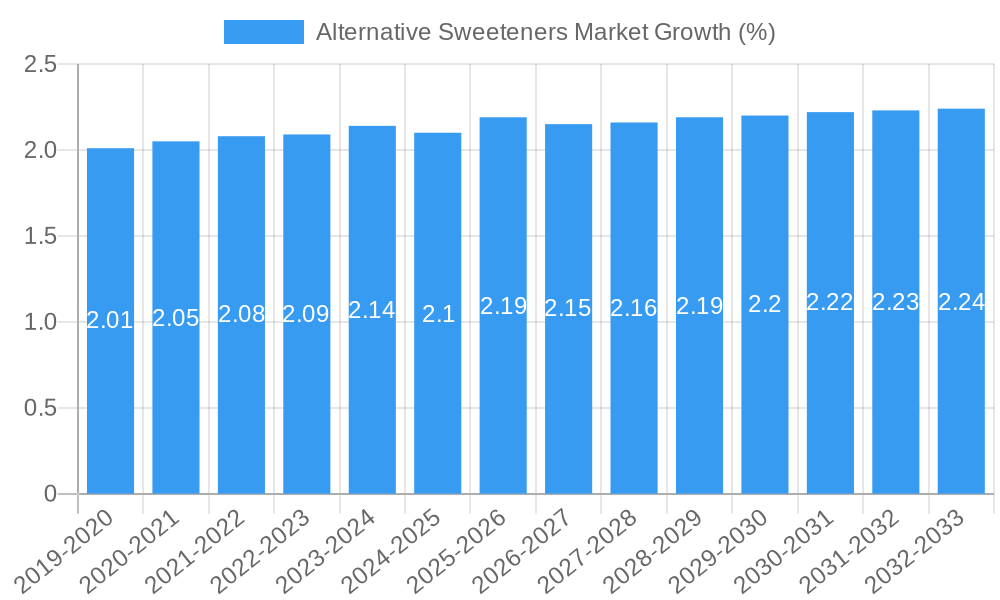
The global Alternative Sweeteners Market is projected for robust growth, estimated to reach a substantial market size of approximately $75,500 million by 2025, with a Compound Annual Growth Rate (CAGR) of 4.30% through 2033. This expansion is fueled by a growing consumer preference for healthier food and beverage options, a significant rise in health consciousness, and an increasing demand for sugar reduction in diets. The market encompasses a diverse range of product types, including High Fructose Syrup, High-Intensity Sweeteners (like aspartame, sucralose, and saccharin), and Low-Intensity Sweeteners (such as stevia and monk fruit). Both natural and synthetic sources contribute to this market, with natural sweeteners gaining considerable traction due to their perceived health benefits. The food and beverage sector remains the dominant application, with bakery, confectionery, and dairy products being key segments, alongside notable adoption in the pharmaceutical industry for palatability enhancement.
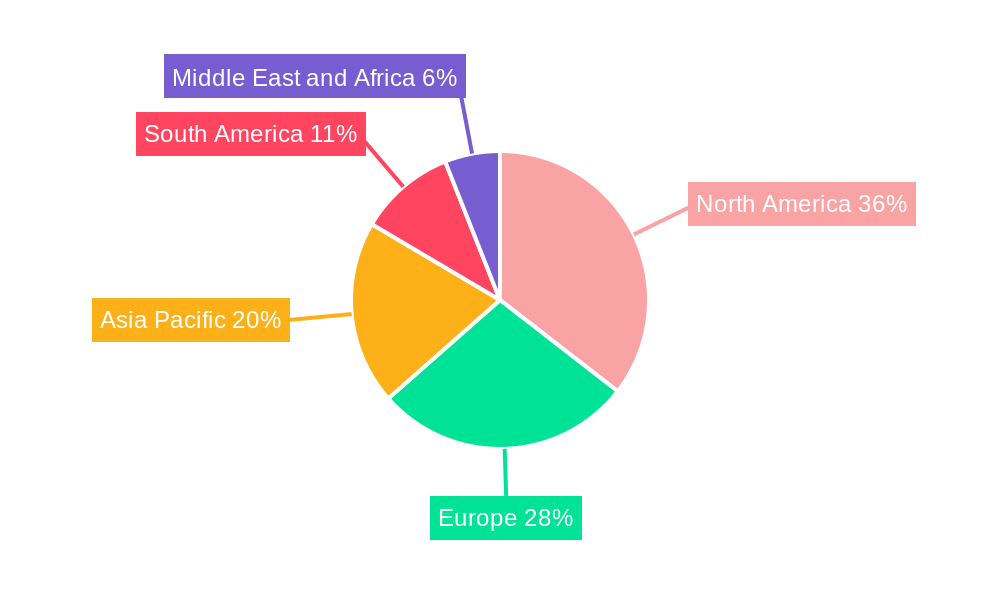
Key market drivers include the escalating rates of obesity and diabetes globally, prompting manufacturers to reformulate products with reduced sugar content. Technological advancements in the extraction and production of natural sweeteners are also playing a crucial role, making them more cost-effective and accessible. However, challenges such as fluctuating raw material prices, stringent regulatory landscapes in certain regions, and consumer perception issues regarding the taste and safety of some artificial sweeteners, can act as restraints. Geographically, North America is expected to lead the market, driven by high consumer awareness and strong demand for low-calorie products. Asia Pacific, with its burgeoning population and increasing disposable income, represents a significant growth opportunity, while Europe and South America also exhibit promising expansion trajectories. Prominent players like Cargill Incorporated, Ingredion Inc., and Archer Daniels Midland Company are investing heavily in research and development to innovate and expand their product portfolios.
Alternative Sweeteners Market Report Description
Unlock the Future of Sweetness: Comprehensive Analysis of the Global Alternative Sweeteners Market (2019-2033)
This in-depth report provides a definitive analysis of the alternative sweeteners market, a rapidly expanding sector driven by evolving consumer preferences for healthier, low-calorie, and natural sugar alternatives. Covering the study period of 2019–2033, with a base year of 2025 and an estimated year of 2025, this research delves into market dynamics, growth trends, regional dominance, product landscape, key drivers, challenges, and emerging opportunities. We present granular insights on the global alternative sweeteners market size and forecast the alternative sweeteners market growth at a CAGR of xx% from 2025 to 2033. This report is meticulously structured to provide actionable intelligence for stakeholders in the food and beverage industry, pharmaceutical sector, and chemical manufacturing.
Our analysis encompasses the parent market of food ingredients and the child market of sugar substitutes, offering a holistic view of market interconnectedness and growth trajectories. We cover crucial segments including Product Type (High Fructose Syrup, High-Intensity Sweeteners, Low-Intensity Sweeteners), Source (Natural, Synthetic), and Application (Food and Beverages - Bakery, Confectionery, Dairy, Others; Pharmaceuticals). We examine the impact of key players such as Cargill Incorporated, Heartland Food Products Group, Kawarlal & Co Inc, DuPont de Nemours Inc, Ingredion Inc, Archer Daniels Midland Company, Ajinomoto Co Inc, PureCircle Ltd, Roquette Freres, Stevia First Corporation, and others.
This report is designed for industry professionals seeking to navigate the complexities of the sugar substitute market, understand sweetener market trends, and capitalize on the burgeoning demand for low-calorie sweeteners, natural sweeteners, and sugar-free products.
Alternative Sweeteners Market Market Dynamics & Structure
The alternative sweeteners market exhibits a dynamic and evolving structure, characterized by a moderate to high degree of concentration within specific segments. Leading players are actively engaged in technological innovation, driving the development of novel sweeteners with improved taste profiles and functionalities. Regulatory frameworks play a pivotal role, influencing product approvals, labeling requirements, and consumer acceptance of both natural and synthetic alternatives. Competitive product substitutes, primarily from the evolving landscape of high-intensity sweeteners and functional ingredients, necessitate continuous product differentiation. End-user demographics, particularly the growing health-conscious consumer base and diabetic populations, are a significant driver of market expansion. Mergers and acquisitions (M&A) are prevalent, as larger corporations seek to consolidate market share, acquire innovative technologies, and expand their product portfolios.
- Market Concentration: Dominated by a few large global ingredient suppliers, with significant regional players in specialized niches.
- Technological Innovation: Focus on enhancing taste, stability, and cost-effectiveness of both natural and synthetic sweeteners. Significant R&D in fermentation and bioprocessing for novel sweetener production.
- Regulatory Frameworks: Stringent approval processes for new sweeteners by bodies like the FDA and EFSA, impacting market entry timelines and R&D investments.
- Competitive Product Substitutes: Emerging blends and natural extracts are challenging established high-intensity sweeteners.
- End-User Demographics: Growing demand from health-conscious consumers, individuals managing diabetes, and the expanding obese population seeking calorie reduction.
- M&A Trends: Strategic acquisitions to gain access to patented technologies, expand production capacity, and enhance distribution networks. The volume of M&A deals in the past three years is estimated at xx billion USD, with xx significant transactions.
Alternative Sweeteners Market Growth Trends & Insights
The alternative sweeteners market is projected for robust and sustained growth, driven by a confluence of powerful trends. The escalating global health consciousness and increasing prevalence of lifestyle diseases such as diabetes and obesity are fundamentally reshaping dietary habits, leading consumers to actively seek sugar-free and low-calorie options. This paradigm shift is directly fueling the demand for various alternative sweeteners, including stevia, erythritol, aspartame, sucralose, and monk fruit. The market size for alternative sweeteners is estimated to have reached xx billion units in 2025 and is expected to witness significant expansion throughout the forecast period. Technological advancements are playing a crucial role in enhancing the quality and accessibility of these sweeteners. Innovations in extraction and purification techniques for natural sweeteners, coupled with advancements in synthetic sweetener production, are leading to improved taste profiles, reduced aftertastes, and greater cost-effectiveness. This makes them more viable for a wider range of applications in the food and beverage industry, from bakery and confectionery to dairy and beverages.
Consumer behavior is also evolving, with a discernible preference for ingredients perceived as natural and clean-label. This trend significantly favors the growth of natural alternative sweeteners derived from sources like plants, while synthetic alternatives are facing increased scrutiny and consumer skepticism in certain markets. However, the superior cost-effectiveness and high-intensity sweetening power of synthetic options continue to ensure their significant market penetration, particularly in price-sensitive segments. Market penetration of high-intensity sweeteners is expected to surpass xx% by 2028, driven by their ability to deliver intense sweetness with negligible caloric contribution. Furthermore, the pharmaceutical industry is increasingly incorporating these sweeteners into medications to improve palatability, especially for pediatric and geriatric formulations, further broadening the market's reach. The projected CAGR for the alternative sweeteners market is approximately xx% from 2025 to 2033, reflecting a healthy and consistent upward trajectory. Disruptions in the traditional sugar supply chain and increasing sugar taxes in various regions also serve as significant catalysts, compelling manufacturers to explore and adopt alternative sweetening solutions. The market is also witnessing a rise in blended sweeteners, offering a more balanced flavor profile and functional benefits, catering to nuanced consumer demands.
Dominant Regions, Countries, or Segments in Alternative Sweeteners Market
The global alternative sweeteners market is characterized by regional variations in demand drivers, regulatory landscapes, and consumer preferences, with North America and Europe currently leading the charge. However, the Asia Pacific region is emerging as a significant growth engine, driven by rapid urbanization, rising disposable incomes, and increasing awareness of health and wellness.
Product Type Dominance: Within the Product Type segment, High-Intensity Sweeteners (HIS) are currently dominating the market, accounting for an estimated xx% of the total market share in 2025. This dominance is attributed to their exceptional sweetening power, allowing for minimal usage and significant calorie reduction in food and beverage products. Key HIS include aspartame, sucralose, saccharin, acesulfame potassium (Ace-K), and neotame. The growing demand for diet and zero-calorie beverages, alongside sugar-free confectionery, is a primary driver for HIS growth.
Source Preference: The Natural Source segment is experiencing the fastest growth, projected to grow at a CAGR of xx% from 2025-2033. This surge is propelled by a strong consumer preference for clean-label ingredients and a perceived healthier profile compared to synthetic alternatives. Natural sweeteners like stevia and monk fruit extracts are gaining substantial traction. However, Synthetic sweeteners still hold a significant market share due to their cost-effectiveness and established presence in various applications.
Application Landscape: The Food and Beverages segment remains the largest application area, commanding an estimated xx% of the market share in 2025. Within this, Confectionery and Bakery are particularly strong application areas, followed by Dairy products and other beverage categories. The ability of alternative sweeteners to replicate the taste and texture of sugar without the added calories makes them indispensable for these product categories. The Pharmaceuticals segment is also a growing application, with sweeteners used to mask the bitter taste of active ingredients in medicines.
Regional Leadership:
- North America: The largest market due to high consumer awareness regarding health and wellness, significant prevalence of diabetes and obesity, and established regulatory frameworks supporting sugar reduction initiatives. The United States alternative sweeteners market is a major contributor.
- Europe: A mature market with a strong emphasis on natural and clean-label products. Stringent regulations on sugar content and increasing consumer demand for healthier food options are key growth drivers.
- Asia Pacific: The fastest-growing region, fueled by rising middle-class incomes, increasing health consciousness, and a growing food processing industry. Countries like China, India, and Southeast Asian nations are key contributors.
Alternative Sweeteners Market Product Landscape
The alternative sweeteners market is characterized by continuous product innovation and diversification. Key advancements focus on enhancing the sensory experience and functional properties of sweeteners. High-intensity sweeteners like sucralose and Ace-K offer significant sweetness with virtually no calories, making them ideal for diet beverages and sugar-free products. Natural alternatives, such as steviol glycosides from stevia and mogrosides from monk fruit, are gaining immense popularity due to consumer preference for natural ingredients. These natural sweeteners are being refined to mitigate their characteristic bitter aftertastes. Innovations in blending different types of sweeteners aim to create synergistic effects, achieving a taste profile closer to sucrose while optimizing cost and functionality. Furthermore, research into novel low-intensity sweeteners and polyols like erythritol and xylitol focuses on their digestive tolerance and specific textural benefits in food applications. The performance metrics of these products are evaluated based on their sweetness intensity, taste profile, stability across different processing conditions (pH, temperature), and their caloric contribution, all of which are critical for their adoption across a wide array of food, beverage, and pharmaceutical formulations.
Key Drivers, Barriers & Challenges in Alternative Sweeteners Market
Key Drivers:
- Growing Health Consciousness & Obesity Epidemic: Rising awareness of health issues linked to sugar consumption is a primary driver, fueling demand for low-calorie and sugar-free alternatives.
- Increasing Prevalence of Diabetes: The global rise in diabetes cases necessitates sugar substitutes for effective diabetes management.
- Government Initiatives & Sugar Taxes: Policies aimed at reducing sugar intake in food and beverages are encouraging manufacturers to switch to alternative sweeteners.
- Technological Advancements: Innovations in extraction, purification, and production of both natural and synthetic sweeteners are improving taste, cost-effectiveness, and availability.
- Expanding Food & Beverage Industry: Growth in processed foods, beverages, and confectionery products globally creates a larger market for sweeteners.
Key Barriers & Challenges:
- Aftertaste Concerns: Some high-intensity sweeteners, particularly natural ones, can have a lingering bitter or metallic aftertaste, affecting consumer acceptance.
- Regulatory Hurdles & Public Perception: Stringent regulations for new sweetener approvals and negative public perception of certain synthetic sweeteners can impede market entry and growth.
- Cost Competitiveness: While improving, some advanced natural sweeteners can still be more expensive than traditional sugar or certain synthetic alternatives, impacting their widespread adoption.
- Supply Chain Volatility: Reliance on specific agricultural sources for natural sweeteners can lead to price fluctuations and supply chain disruptions. The estimated impact of these disruptions on market growth could be xx%.
- Limited Functionality: Some sweeteners lack the bulking, browning, or fermentation properties of sugar, limiting their application in certain food products.
Emerging Opportunities in Alternative Sweeteners Market
The alternative sweeteners market presents a fertile ground for innovation and expansion. The burgeoning demand for plant-based and vegan sweeteners offers significant opportunities for ingredients derived from natural sources. Continued research into novel natural sweeteners with superior taste profiles and functionalities, such as better mouthfeel and heat stability, will capture market share. The development of sweetener blends that mimic the sensory attributes of sugar more closely presents a substantial opportunity for both established and emerging players. Untapped markets in developing economies, with increasing health awareness and disposable incomes, represent a significant growth potential. Furthermore, exploring innovative applications beyond traditional food and beverages, such as in functional foods, nutritional supplements, and even non-food applications like animal feed, can open new revenue streams. The development of cost-effective production methods for high-quality natural sweeteners will be crucial for widespread adoption.
Growth Accelerators in the Alternative Sweeteners Market Industry
Several catalysts are propelling the long-term growth of the alternative sweeteners market. Technological breakthroughs in biotechnology and fermentation processes are enabling the efficient and sustainable production of novel sweeteners, reducing reliance on traditional agricultural methods and lowering production costs. Strategic partnerships between ingredient manufacturers, food and beverage companies, and research institutions are accelerating product development and market penetration. The continuous expansion of the global food and beverage industry, coupled with increasing consumer demand for healthier product options, provides a sustained growth impetus. Furthermore, aggressive market expansion strategies by key players, including geographical diversification and product portfolio enhancement, are contributing to overall market growth. The ongoing focus on research and development to address taste, texture, and cost challenges is creating a more robust and versatile sweetener landscape.
Key Players Shaping the Alternative Sweeteners Market Market
- Cargill Incorporated
- Heartland Food Products Group
- Kawarlal & Co Inc
- DuPont de Nemours Inc
- Ingredion Inc
- Archer Daniels Midland Company
- Ajinomoto Co Inc
- PureCircle Ltd
- Roquette Freres
- Stevia First Corporation
Notable Milestones in Alternative Sweeteners Market Sector
- 2019: Approval of new steviol glycosides by regulatory bodies in several key markets, expanding the range of available natural sweeteners.
- 2020: Launch of innovative blended sweeteners by major players, offering improved taste profiles and sugar-like functionality.
- 2021: Significant investment in research and development for fermentation-based production of rare sugars and next-generation sweeteners.
- 2022: Increased M&A activity as larger companies acquire niche players with proprietary sweetener technologies.
- 2023: Growing consumer awareness and demand for "clean label" and "natural" sweeteners leading to accelerated product launches in these categories.
- 2024 (Estimated): Introduction of sweeteners with enhanced digestive tolerance and reduced caloric impact in the market.
In-Depth Alternative Sweeteners Market Market Outlook
The outlook for the alternative sweeteners market remains exceptionally positive, driven by persistent and intensifying global trends. The demand for healthier food and beverage options, coupled with the ongoing battle against lifestyle diseases, will continue to be the primary growth accelerator. Innovations in natural sweeteners, particularly those offering superior taste and functionality, are poised to capture a larger market share. Strategic collaborations and targeted investments in emerging markets will further expand the reach of alternative sweeteners. The market is expected to witness a steady increase in the adoption of these ingredients across a wider range of applications, including bakery, dairy, beverages, and pharmaceuticals. The continuous evolution of consumer preferences towards clean-label and sustainable ingredients will shape future product development and market strategies. The future of the alternative sweeteners market is one of sustained innovation, robust demand, and increasing integration into global food systems.
Alternative Sweeteners Market Segmentation
-
1. Product Type
- 1.1. High Fructose Syrup
- 1.2. High-Intensity Sweeteners
- 1.3. Low-Intensity Sweeteners
-
2. Source
- 2.1. Natural
- 2.2. Synthetic
-
3. Application
-
3.1. Food and Beverages
- 3.1.1. Bakery
- 3.1.2. Confectionery
- 3.1.3. Dairy
- 3.1.4. Others
- 3.2. Pharmaceuticals
-
3.1. Food and Beverages
Alternative Sweeteners Market Segmentation By Geography
-
1. North America
- 1.1. United States
- 1.2. Canada
- 1.3. Mexico
- 1.4. Rest of North America
-
2. Europe
- 2.1. Spain
- 2.2. United Kingdom
- 2.3. Germany
- 2.4. France
- 2.5. Italy
- 2.6. Russia
- 2.7. Rest of Europe
-
3. Asia Pacific
- 3.1. China
- 3.2. Japan
- 3.3. India
- 3.4. Australia
- 3.5. Rest of Asia Pacific
-
4. South America
- 4.1. Brazil
- 4.2. Argentina
- 4.3. Rest of South America
-
5. Middle East and Africa
- 5.1. South Africa
- 5.2. United Arab Emirates
- 5.3. Rest of Middle East and Africa
Alternative Sweeteners Market REPORT HIGHLIGHTS
| Aspects | Details |
|---|---|
| Study Period | 2019-2033 |
| Base Year | 2024 |
| Estimated Year | 2025 |
| Forecast Period | 2025-2033 |
| Historical Period | 2019-2024 |
| Growth Rate | CAGR of 4.30% from 2019-2033 |
| Segmentation |
|
Table of Contents
- 1. Introduction
- 1.1. Research Scope
- 1.2. Market Segmentation
- 1.3. Research Methodology
- 1.4. Definitions and Assumptions
- 2. Executive Summary
- 2.1. Introduction
- 3. Market Dynamics
- 3.1. Introduction
- 3.2. Market Drivers
- 3.2.1. Increasing Demand for Low-Fat and Low-Calorie Food; Increasing Product Innovation
- 3.3. Market Restrains
- 3.3.1. Higher Production Cost of Fat Replacers
- 3.4. Market Trends
- 3.4.1. Rising Number of Consumers Affected by Diabetes and Obesity
- 4. Market Factor Analysis
- 4.1. Porters Five Forces
- 4.2. Supply/Value Chain
- 4.3. PESTEL analysis
- 4.4. Market Entropy
- 4.5. Patent/Trademark Analysis
- 5. Global Alternative Sweeteners Market Analysis, Insights and Forecast, 2019-2031
- 5.1. Market Analysis, Insights and Forecast - by Product Type
- 5.1.1. High Fructose Syrup
- 5.1.2. High-Intensity Sweeteners
- 5.1.3. Low-Intensity Sweeteners
- 5.2. Market Analysis, Insights and Forecast - by Source
- 5.2.1. Natural
- 5.2.2. Synthetic
- 5.3. Market Analysis, Insights and Forecast - by Application
- 5.3.1. Food and Beverages
- 5.3.1.1. Bakery
- 5.3.1.2. Confectionery
- 5.3.1.3. Dairy
- 5.3.1.4. Others
- 5.3.2. Pharmaceuticals
- 5.3.1. Food and Beverages
- 5.4. Market Analysis, Insights and Forecast - by Region
- 5.4.1. North America
- 5.4.2. Europe
- 5.4.3. Asia Pacific
- 5.4.4. South America
- 5.4.5. Middle East and Africa
- 5.1. Market Analysis, Insights and Forecast - by Product Type
- 6. North America Alternative Sweeteners Market Analysis, Insights and Forecast, 2019-2031
- 6.1. Market Analysis, Insights and Forecast - by Product Type
- 6.1.1. High Fructose Syrup
- 6.1.2. High-Intensity Sweeteners
- 6.1.3. Low-Intensity Sweeteners
- 6.2. Market Analysis, Insights and Forecast - by Source
- 6.2.1. Natural
- 6.2.2. Synthetic
- 6.3. Market Analysis, Insights and Forecast - by Application
- 6.3.1. Food and Beverages
- 6.3.1.1. Bakery
- 6.3.1.2. Confectionery
- 6.3.1.3. Dairy
- 6.3.1.4. Others
- 6.3.2. Pharmaceuticals
- 6.3.1. Food and Beverages
- 6.1. Market Analysis, Insights and Forecast - by Product Type
- 7. Europe Alternative Sweeteners Market Analysis, Insights and Forecast, 2019-2031
- 7.1. Market Analysis, Insights and Forecast - by Product Type
- 7.1.1. High Fructose Syrup
- 7.1.2. High-Intensity Sweeteners
- 7.1.3. Low-Intensity Sweeteners
- 7.2. Market Analysis, Insights and Forecast - by Source
- 7.2.1. Natural
- 7.2.2. Synthetic
- 7.3. Market Analysis, Insights and Forecast - by Application
- 7.3.1. Food and Beverages
- 7.3.1.1. Bakery
- 7.3.1.2. Confectionery
- 7.3.1.3. Dairy
- 7.3.1.4. Others
- 7.3.2. Pharmaceuticals
- 7.3.1. Food and Beverages
- 7.1. Market Analysis, Insights and Forecast - by Product Type
- 8. Asia Pacific Alternative Sweeteners Market Analysis, Insights and Forecast, 2019-2031
- 8.1. Market Analysis, Insights and Forecast - by Product Type
- 8.1.1. High Fructose Syrup
- 8.1.2. High-Intensity Sweeteners
- 8.1.3. Low-Intensity Sweeteners
- 8.2. Market Analysis, Insights and Forecast - by Source
- 8.2.1. Natural
- 8.2.2. Synthetic
- 8.3. Market Analysis, Insights and Forecast - by Application
- 8.3.1. Food and Beverages
- 8.3.1.1. Bakery
- 8.3.1.2. Confectionery
- 8.3.1.3. Dairy
- 8.3.1.4. Others
- 8.3.2. Pharmaceuticals
- 8.3.1. Food and Beverages
- 8.1. Market Analysis, Insights and Forecast - by Product Type
- 9. South America Alternative Sweeteners Market Analysis, Insights and Forecast, 2019-2031
- 9.1. Market Analysis, Insights and Forecast - by Product Type
- 9.1.1. High Fructose Syrup
- 9.1.2. High-Intensity Sweeteners
- 9.1.3. Low-Intensity Sweeteners
- 9.2. Market Analysis, Insights and Forecast - by Source
- 9.2.1. Natural
- 9.2.2. Synthetic
- 9.3. Market Analysis, Insights and Forecast - by Application
- 9.3.1. Food and Beverages
- 9.3.1.1. Bakery
- 9.3.1.2. Confectionery
- 9.3.1.3. Dairy
- 9.3.1.4. Others
- 9.3.2. Pharmaceuticals
- 9.3.1. Food and Beverages
- 9.1. Market Analysis, Insights and Forecast - by Product Type
- 10. Middle East and Africa Alternative Sweeteners Market Analysis, Insights and Forecast, 2019-2031
- 10.1. Market Analysis, Insights and Forecast - by Product Type
- 10.1.1. High Fructose Syrup
- 10.1.2. High-Intensity Sweeteners
- 10.1.3. Low-Intensity Sweeteners
- 10.2. Market Analysis, Insights and Forecast - by Source
- 10.2.1. Natural
- 10.2.2. Synthetic
- 10.3. Market Analysis, Insights and Forecast - by Application
- 10.3.1. Food and Beverages
- 10.3.1.1. Bakery
- 10.3.1.2. Confectionery
- 10.3.1.3. Dairy
- 10.3.1.4. Others
- 10.3.2. Pharmaceuticals
- 10.3.1. Food and Beverages
- 10.1. Market Analysis, Insights and Forecast - by Product Type
- 11. North America Alternative Sweeteners Market Analysis, Insights and Forecast, 2019-2031
- 11.1. Market Analysis, Insights and Forecast - By Country/Sub-region
- 11.1.1 United States
- 11.1.2 Canada
- 11.1.3 Mexico
- 11.1.4 Rest of North America
- 12. Europe Alternative Sweeteners Market Analysis, Insights and Forecast, 2019-2031
- 12.1. Market Analysis, Insights and Forecast - By Country/Sub-region
- 12.1.1 Spain
- 12.1.2 United Kingdom
- 12.1.3 Germany
- 12.1.4 France
- 12.1.5 Italy
- 12.1.6 Russia
- 12.1.7 Rest of Europe
- 13. Asia Pacific Alternative Sweeteners Market Analysis, Insights and Forecast, 2019-2031
- 13.1. Market Analysis, Insights and Forecast - By Country/Sub-region
- 13.1.1 China
- 13.1.2 Japan
- 13.1.3 India
- 13.1.4 Australia
- 13.1.5 Rest of Asia Pacific
- 14. South America Alternative Sweeteners Market Analysis, Insights and Forecast, 2019-2031
- 14.1. Market Analysis, Insights and Forecast - By Country/Sub-region
- 14.1.1 Brazil
- 14.1.2 Argentina
- 14.1.3 Rest of South America
- 15. Middle East and Africa Alternative Sweeteners Market Analysis, Insights and Forecast, 2019-2031
- 15.1. Market Analysis, Insights and Forecast - By Country/Sub-region
- 15.1.1 South Africa
- 15.1.2 United Arab Emirates
- 15.1.3 Rest of Middle East and Africa
- 16. Competitive Analysis
- 16.1. Global Market Share Analysis 2024
- 16.2. Company Profiles
- 16.2.1 Cargill Incorporated
- 16.2.1.1. Overview
- 16.2.1.2. Products
- 16.2.1.3. SWOT Analysis
- 16.2.1.4. Recent Developments
- 16.2.1.5. Financials (Based on Availability)
- 16.2.2 Heartland Food Products Group
- 16.2.2.1. Overview
- 16.2.2.2. Products
- 16.2.2.3. SWOT Analysis
- 16.2.2.4. Recent Developments
- 16.2.2.5. Financials (Based on Availability)
- 16.2.3 Kawarlal & Co Inc *List Not Exhaustive
- 16.2.3.1. Overview
- 16.2.3.2. Products
- 16.2.3.3. SWOT Analysis
- 16.2.3.4. Recent Developments
- 16.2.3.5. Financials (Based on Availability)
- 16.2.4 DuPont de Nemours Inc
- 16.2.4.1. Overview
- 16.2.4.2. Products
- 16.2.4.3. SWOT Analysis
- 16.2.4.4. Recent Developments
- 16.2.4.5. Financials (Based on Availability)
- 16.2.5 Ingredion Inc
- 16.2.5.1. Overview
- 16.2.5.2. Products
- 16.2.5.3. SWOT Analysis
- 16.2.5.4. Recent Developments
- 16.2.5.5. Financials (Based on Availability)
- 16.2.6 Archer Daniels Midland Company
- 16.2.6.1. Overview
- 16.2.6.2. Products
- 16.2.6.3. SWOT Analysis
- 16.2.6.4. Recent Developments
- 16.2.6.5. Financials (Based on Availability)
- 16.2.7 Ajinomoto Co Inc
- 16.2.7.1. Overview
- 16.2.7.2. Products
- 16.2.7.3. SWOT Analysis
- 16.2.7.4. Recent Developments
- 16.2.7.5. Financials (Based on Availability)
- 16.2.8 PureCircle Ltd
- 16.2.8.1. Overview
- 16.2.8.2. Products
- 16.2.8.3. SWOT Analysis
- 16.2.8.4. Recent Developments
- 16.2.8.5. Financials (Based on Availability)
- 16.2.9 Roquette Freres
- 16.2.9.1. Overview
- 16.2.9.2. Products
- 16.2.9.3. SWOT Analysis
- 16.2.9.4. Recent Developments
- 16.2.9.5. Financials (Based on Availability)
- 16.2.10 Stevia First Corporation
- 16.2.10.1. Overview
- 16.2.10.2. Products
- 16.2.10.3. SWOT Analysis
- 16.2.10.4. Recent Developments
- 16.2.10.5. Financials (Based on Availability)
- 16.2.1 Cargill Incorporated
List of Figures
- Figure 1: Global Alternative Sweeteners Market Revenue Breakdown (Million, %) by Region 2024 & 2032
- Figure 2: North America Alternative Sweeteners Market Revenue (Million), by Country 2024 & 2032
- Figure 3: North America Alternative Sweeteners Market Revenue Share (%), by Country 2024 & 2032
- Figure 4: Europe Alternative Sweeteners Market Revenue (Million), by Country 2024 & 2032
- Figure 5: Europe Alternative Sweeteners Market Revenue Share (%), by Country 2024 & 2032
- Figure 6: Asia Pacific Alternative Sweeteners Market Revenue (Million), by Country 2024 & 2032
- Figure 7: Asia Pacific Alternative Sweeteners Market Revenue Share (%), by Country 2024 & 2032
- Figure 8: South America Alternative Sweeteners Market Revenue (Million), by Country 2024 & 2032
- Figure 9: South America Alternative Sweeteners Market Revenue Share (%), by Country 2024 & 2032
- Figure 10: Middle East and Africa Alternative Sweeteners Market Revenue (Million), by Country 2024 & 2032
- Figure 11: Middle East and Africa Alternative Sweeteners Market Revenue Share (%), by Country 2024 & 2032
- Figure 12: North America Alternative Sweeteners Market Revenue (Million), by Product Type 2024 & 2032
- Figure 13: North America Alternative Sweeteners Market Revenue Share (%), by Product Type 2024 & 2032
- Figure 14: North America Alternative Sweeteners Market Revenue (Million), by Source 2024 & 2032
- Figure 15: North America Alternative Sweeteners Market Revenue Share (%), by Source 2024 & 2032
- Figure 16: North America Alternative Sweeteners Market Revenue (Million), by Application 2024 & 2032
- Figure 17: North America Alternative Sweeteners Market Revenue Share (%), by Application 2024 & 2032
- Figure 18: North America Alternative Sweeteners Market Revenue (Million), by Country 2024 & 2032
- Figure 19: North America Alternative Sweeteners Market Revenue Share (%), by Country 2024 & 2032
- Figure 20: Europe Alternative Sweeteners Market Revenue (Million), by Product Type 2024 & 2032
- Figure 21: Europe Alternative Sweeteners Market Revenue Share (%), by Product Type 2024 & 2032
- Figure 22: Europe Alternative Sweeteners Market Revenue (Million), by Source 2024 & 2032
- Figure 23: Europe Alternative Sweeteners Market Revenue Share (%), by Source 2024 & 2032
- Figure 24: Europe Alternative Sweeteners Market Revenue (Million), by Application 2024 & 2032
- Figure 25: Europe Alternative Sweeteners Market Revenue Share (%), by Application 2024 & 2032
- Figure 26: Europe Alternative Sweeteners Market Revenue (Million), by Country 2024 & 2032
- Figure 27: Europe Alternative Sweeteners Market Revenue Share (%), by Country 2024 & 2032
- Figure 28: Asia Pacific Alternative Sweeteners Market Revenue (Million), by Product Type 2024 & 2032
- Figure 29: Asia Pacific Alternative Sweeteners Market Revenue Share (%), by Product Type 2024 & 2032
- Figure 30: Asia Pacific Alternative Sweeteners Market Revenue (Million), by Source 2024 & 2032
- Figure 31: Asia Pacific Alternative Sweeteners Market Revenue Share (%), by Source 2024 & 2032
- Figure 32: Asia Pacific Alternative Sweeteners Market Revenue (Million), by Application 2024 & 2032
- Figure 33: Asia Pacific Alternative Sweeteners Market Revenue Share (%), by Application 2024 & 2032
- Figure 34: Asia Pacific Alternative Sweeteners Market Revenue (Million), by Country 2024 & 2032
- Figure 35: Asia Pacific Alternative Sweeteners Market Revenue Share (%), by Country 2024 & 2032
- Figure 36: South America Alternative Sweeteners Market Revenue (Million), by Product Type 2024 & 2032
- Figure 37: South America Alternative Sweeteners Market Revenue Share (%), by Product Type 2024 & 2032
- Figure 38: South America Alternative Sweeteners Market Revenue (Million), by Source 2024 & 2032
- Figure 39: South America Alternative Sweeteners Market Revenue Share (%), by Source 2024 & 2032
- Figure 40: South America Alternative Sweeteners Market Revenue (Million), by Application 2024 & 2032
- Figure 41: South America Alternative Sweeteners Market Revenue Share (%), by Application 2024 & 2032
- Figure 42: South America Alternative Sweeteners Market Revenue (Million), by Country 2024 & 2032
- Figure 43: South America Alternative Sweeteners Market Revenue Share (%), by Country 2024 & 2032
- Figure 44: Middle East and Africa Alternative Sweeteners Market Revenue (Million), by Product Type 2024 & 2032
- Figure 45: Middle East and Africa Alternative Sweeteners Market Revenue Share (%), by Product Type 2024 & 2032
- Figure 46: Middle East and Africa Alternative Sweeteners Market Revenue (Million), by Source 2024 & 2032
- Figure 47: Middle East and Africa Alternative Sweeteners Market Revenue Share (%), by Source 2024 & 2032
- Figure 48: Middle East and Africa Alternative Sweeteners Market Revenue (Million), by Application 2024 & 2032
- Figure 49: Middle East and Africa Alternative Sweeteners Market Revenue Share (%), by Application 2024 & 2032
- Figure 50: Middle East and Africa Alternative Sweeteners Market Revenue (Million), by Country 2024 & 2032
- Figure 51: Middle East and Africa Alternative Sweeteners Market Revenue Share (%), by Country 2024 & 2032
List of Tables
- Table 1: Global Alternative Sweeteners Market Revenue Million Forecast, by Region 2019 & 2032
- Table 2: Global Alternative Sweeteners Market Revenue Million Forecast, by Product Type 2019 & 2032
- Table 3: Global Alternative Sweeteners Market Revenue Million Forecast, by Source 2019 & 2032
- Table 4: Global Alternative Sweeteners Market Revenue Million Forecast, by Application 2019 & 2032
- Table 5: Global Alternative Sweeteners Market Revenue Million Forecast, by Region 2019 & 2032
- Table 6: Global Alternative Sweeteners Market Revenue Million Forecast, by Country 2019 & 2032
- Table 7: United States Alternative Sweeteners Market Revenue (Million) Forecast, by Application 2019 & 2032
- Table 8: Canada Alternative Sweeteners Market Revenue (Million) Forecast, by Application 2019 & 2032
- Table 9: Mexico Alternative Sweeteners Market Revenue (Million) Forecast, by Application 2019 & 2032
- Table 10: Rest of North America Alternative Sweeteners Market Revenue (Million) Forecast, by Application 2019 & 2032
- Table 11: Global Alternative Sweeteners Market Revenue Million Forecast, by Country 2019 & 2032
- Table 12: Spain Alternative Sweeteners Market Revenue (Million) Forecast, by Application 2019 & 2032
- Table 13: United Kingdom Alternative Sweeteners Market Revenue (Million) Forecast, by Application 2019 & 2032
- Table 14: Germany Alternative Sweeteners Market Revenue (Million) Forecast, by Application 2019 & 2032
- Table 15: France Alternative Sweeteners Market Revenue (Million) Forecast, by Application 2019 & 2032
- Table 16: Italy Alternative Sweeteners Market Revenue (Million) Forecast, by Application 2019 & 2032
- Table 17: Russia Alternative Sweeteners Market Revenue (Million) Forecast, by Application 2019 & 2032
- Table 18: Rest of Europe Alternative Sweeteners Market Revenue (Million) Forecast, by Application 2019 & 2032
- Table 19: Global Alternative Sweeteners Market Revenue Million Forecast, by Country 2019 & 2032
- Table 20: China Alternative Sweeteners Market Revenue (Million) Forecast, by Application 2019 & 2032
- Table 21: Japan Alternative Sweeteners Market Revenue (Million) Forecast, by Application 2019 & 2032
- Table 22: India Alternative Sweeteners Market Revenue (Million) Forecast, by Application 2019 & 2032
- Table 23: Australia Alternative Sweeteners Market Revenue (Million) Forecast, by Application 2019 & 2032
- Table 24: Rest of Asia Pacific Alternative Sweeteners Market Revenue (Million) Forecast, by Application 2019 & 2032
- Table 25: Global Alternative Sweeteners Market Revenue Million Forecast, by Country 2019 & 2032
- Table 26: Brazil Alternative Sweeteners Market Revenue (Million) Forecast, by Application 2019 & 2032
- Table 27: Argentina Alternative Sweeteners Market Revenue (Million) Forecast, by Application 2019 & 2032
- Table 28: Rest of South America Alternative Sweeteners Market Revenue (Million) Forecast, by Application 2019 & 2032
- Table 29: Global Alternative Sweeteners Market Revenue Million Forecast, by Country 2019 & 2032
- Table 30: South Africa Alternative Sweeteners Market Revenue (Million) Forecast, by Application 2019 & 2032
- Table 31: United Arab Emirates Alternative Sweeteners Market Revenue (Million) Forecast, by Application 2019 & 2032
- Table 32: Rest of Middle East and Africa Alternative Sweeteners Market Revenue (Million) Forecast, by Application 2019 & 2032
- Table 33: Global Alternative Sweeteners Market Revenue Million Forecast, by Product Type 2019 & 2032
- Table 34: Global Alternative Sweeteners Market Revenue Million Forecast, by Source 2019 & 2032
- Table 35: Global Alternative Sweeteners Market Revenue Million Forecast, by Application 2019 & 2032
- Table 36: Global Alternative Sweeteners Market Revenue Million Forecast, by Country 2019 & 2032
- Table 37: United States Alternative Sweeteners Market Revenue (Million) Forecast, by Application 2019 & 2032
- Table 38: Canada Alternative Sweeteners Market Revenue (Million) Forecast, by Application 2019 & 2032
- Table 39: Mexico Alternative Sweeteners Market Revenue (Million) Forecast, by Application 2019 & 2032
- Table 40: Rest of North America Alternative Sweeteners Market Revenue (Million) Forecast, by Application 2019 & 2032
- Table 41: Global Alternative Sweeteners Market Revenue Million Forecast, by Product Type 2019 & 2032
- Table 42: Global Alternative Sweeteners Market Revenue Million Forecast, by Source 2019 & 2032
- Table 43: Global Alternative Sweeteners Market Revenue Million Forecast, by Application 2019 & 2032
- Table 44: Global Alternative Sweeteners Market Revenue Million Forecast, by Country 2019 & 2032
- Table 45: Spain Alternative Sweeteners Market Revenue (Million) Forecast, by Application 2019 & 2032
- Table 46: United Kingdom Alternative Sweeteners Market Revenue (Million) Forecast, by Application 2019 & 2032
- Table 47: Germany Alternative Sweeteners Market Revenue (Million) Forecast, by Application 2019 & 2032
- Table 48: France Alternative Sweeteners Market Revenue (Million) Forecast, by Application 2019 & 2032
- Table 49: Italy Alternative Sweeteners Market Revenue (Million) Forecast, by Application 2019 & 2032
- Table 50: Russia Alternative Sweeteners Market Revenue (Million) Forecast, by Application 2019 & 2032
- Table 51: Rest of Europe Alternative Sweeteners Market Revenue (Million) Forecast, by Application 2019 & 2032
- Table 52: Global Alternative Sweeteners Market Revenue Million Forecast, by Product Type 2019 & 2032
- Table 53: Global Alternative Sweeteners Market Revenue Million Forecast, by Source 2019 & 2032
- Table 54: Global Alternative Sweeteners Market Revenue Million Forecast, by Application 2019 & 2032
- Table 55: Global Alternative Sweeteners Market Revenue Million Forecast, by Country 2019 & 2032
- Table 56: China Alternative Sweeteners Market Revenue (Million) Forecast, by Application 2019 & 2032
- Table 57: Japan Alternative Sweeteners Market Revenue (Million) Forecast, by Application 2019 & 2032
- Table 58: India Alternative Sweeteners Market Revenue (Million) Forecast, by Application 2019 & 2032
- Table 59: Australia Alternative Sweeteners Market Revenue (Million) Forecast, by Application 2019 & 2032
- Table 60: Rest of Asia Pacific Alternative Sweeteners Market Revenue (Million) Forecast, by Application 2019 & 2032
- Table 61: Global Alternative Sweeteners Market Revenue Million Forecast, by Product Type 2019 & 2032
- Table 62: Global Alternative Sweeteners Market Revenue Million Forecast, by Source 2019 & 2032
- Table 63: Global Alternative Sweeteners Market Revenue Million Forecast, by Application 2019 & 2032
- Table 64: Global Alternative Sweeteners Market Revenue Million Forecast, by Country 2019 & 2032
- Table 65: Brazil Alternative Sweeteners Market Revenue (Million) Forecast, by Application 2019 & 2032
- Table 66: Argentina Alternative Sweeteners Market Revenue (Million) Forecast, by Application 2019 & 2032
- Table 67: Rest of South America Alternative Sweeteners Market Revenue (Million) Forecast, by Application 2019 & 2032
- Table 68: Global Alternative Sweeteners Market Revenue Million Forecast, by Product Type 2019 & 2032
- Table 69: Global Alternative Sweeteners Market Revenue Million Forecast, by Source 2019 & 2032
- Table 70: Global Alternative Sweeteners Market Revenue Million Forecast, by Application 2019 & 2032
- Table 71: Global Alternative Sweeteners Market Revenue Million Forecast, by Country 2019 & 2032
- Table 72: South Africa Alternative Sweeteners Market Revenue (Million) Forecast, by Application 2019 & 2032
- Table 73: United Arab Emirates Alternative Sweeteners Market Revenue (Million) Forecast, by Application 2019 & 2032
- Table 74: Rest of Middle East and Africa Alternative Sweeteners Market Revenue (Million) Forecast, by Application 2019 & 2032
Frequently Asked Questions
1. What is the projected Compound Annual Growth Rate (CAGR) of the Alternative Sweeteners Market?
The projected CAGR is approximately 4.30%.
2. Which companies are prominent players in the Alternative Sweeteners Market?
Key companies in the market include Cargill Incorporated, Heartland Food Products Group, Kawarlal & Co Inc *List Not Exhaustive, DuPont de Nemours Inc, Ingredion Inc, Archer Daniels Midland Company, Ajinomoto Co Inc, PureCircle Ltd, Roquette Freres, Stevia First Corporation.
3. What are the main segments of the Alternative Sweeteners Market?
The market segments include Product Type, Source, Application.
4. Can you provide details about the market size?
The market size is estimated to be USD XX Million as of 2022.
5. What are some drivers contributing to market growth?
Increasing Demand for Low-Fat and Low-Calorie Food; Increasing Product Innovation.
6. What are the notable trends driving market growth?
Rising Number of Consumers Affected by Diabetes and Obesity.
7. Are there any restraints impacting market growth?
Higher Production Cost of Fat Replacers.
8. Can you provide examples of recent developments in the market?
N/A
9. What pricing options are available for accessing the report?
Pricing options include single-user, multi-user, and enterprise licenses priced at USD 4750, USD 5250, and USD 8750 respectively.
10. Is the market size provided in terms of value or volume?
The market size is provided in terms of value, measured in Million.
11. Are there any specific market keywords associated with the report?
Yes, the market keyword associated with the report is "Alternative Sweeteners Market," which aids in identifying and referencing the specific market segment covered.
12. How do I determine which pricing option suits my needs best?
The pricing options vary based on user requirements and access needs. Individual users may opt for single-user licenses, while businesses requiring broader access may choose multi-user or enterprise licenses for cost-effective access to the report.
13. Are there any additional resources or data provided in the Alternative Sweeteners Market report?
While the report offers comprehensive insights, it's advisable to review the specific contents or supplementary materials provided to ascertain if additional resources or data are available.
14. How can I stay updated on further developments or reports in the Alternative Sweeteners Market?
To stay informed about further developments, trends, and reports in the Alternative Sweeteners Market, consider subscribing to industry newsletters, following relevant companies and organizations, or regularly checking reputable industry news sources and publications.
Methodology
Step 1 - Identification of Relevant Samples Size from Population Database


Step 2 - Approaches for Defining Global Market Size (Value, Volume* & Price*)

Note*: In applicable scenarios
Step 3 - Data Sources
Primary Research
- Web Analytics
- Survey Reports
- Research Institute
- Latest Research Reports
- Opinion Leaders
Secondary Research
- Annual Reports
- White Paper
- Latest Press Release
- Industry Association
- Paid Database
- Investor Presentations

Step 4 - Data Triangulation
Involves using different sources of information in order to increase the validity of a study
These sources are likely to be stakeholders in a program - participants, other researchers, program staff, other community members, and so on.
Then we put all data in single framework & apply various statistical tools to find out the dynamic on the market.
During the analysis stage, feedback from the stakeholder groups would be compared to determine areas of agreement as well as areas of divergence


