


Key Insights
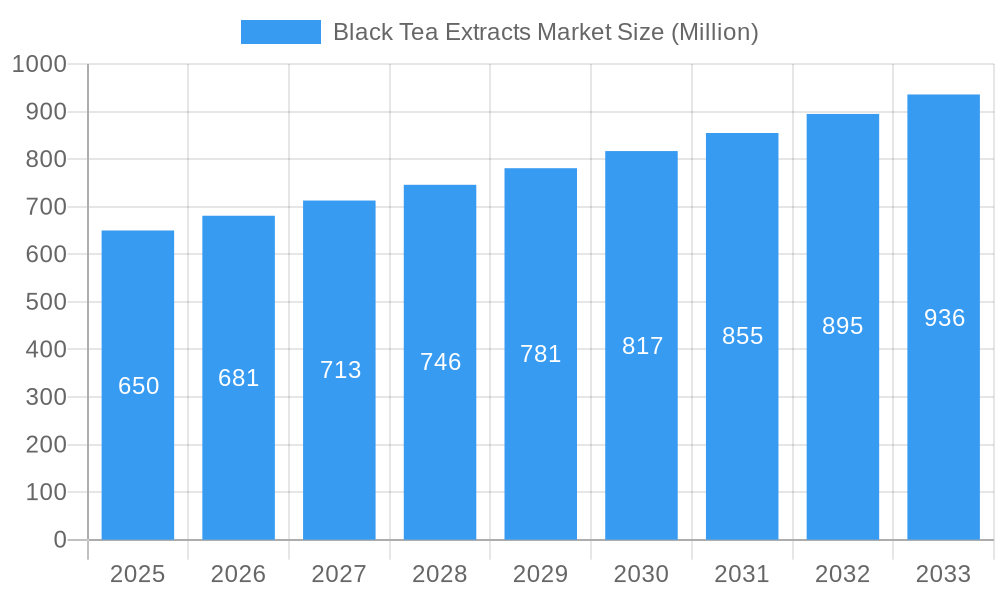
The global Black Tea Extracts market is poised for significant growth, projected to reach an estimated market size of approximately $650 million by 2025, with a robust Compound Annual Growth Rate (CAGR) of 4.50% from 2019 to 2033. This expansion is largely fueled by the escalating consumer demand for natural and functional ingredients in food, beverages, and health products. The inherent health benefits associated with black tea, including its antioxidant properties and potential to improve cardiovascular health, are driving its integration into a wider array of applications beyond traditional beverages. The rising awareness of these benefits, coupled with a global shift towards healthier lifestyles, is creating a fertile ground for market expansion. The liquid form of black tea extract currently dominates the market due to its ease of use and integration into various formulations, while encapsulated and powder forms are gaining traction for specific applications requiring controlled release or enhanced stability.

Black Tea Extracts Market Market Size (In Million)

The market's trajectory is further propelled by key drivers such as the increasing preference for plant-based ingredients and the growing popularity of dietary supplements and functional foods. The demand for natural cosmetic ingredients, offering anti-aging and skin-soothing properties, also contributes to this positive outlook. Hot Water Soluble (HWS) extracts are widely adopted across industries, particularly in the beverage sector, due to their cost-effectiveness and ease of dissolution. However, the development of Cold Water Soluble (CWS) extracts is opening new avenues for application in sensitive formulations and products requiring low-temperature processing. Restraints, such as the fluctuating prices of raw tea leaves and stringent regulatory landscapes in certain regions, are challenges that market players are actively navigating. Despite these hurdles, the innovation in extraction technologies and the exploration of new application areas are expected to sustain the market's upward momentum throughout the forecast period, with Asia Pacific and Europe anticipated to be leading regions in consumption and production.
Black Tea Extracts Market Company Market Share
Comprehensive Report: Black Tea Extracts Market - Growth, Trends, and Future Outlook (2019-2033)
Unlock the potential of the burgeoning Black Tea Extracts Market with this in-depth industry report. Covering a detailed study period from 2019 to 2033, with a base and estimated year of 2025, this analysis provides a critical examination of market dynamics, growth trajectories, regional dominance, product innovations, key drivers, and future opportunities. Essential for industry professionals, manufacturers, investors, and researchers, this report offers actionable insights and quantitative data to navigate the complexities and capitalize on the expansion of the global Black Tea Extracts market.
Black Tea Extracts Market Market Dynamics & Structure
The global Black Tea Extracts market exhibits a moderately concentrated structure, with key players like Phyto Life Sciences P Ltd, AVT Naturals, and Martin Bauer Group holding significant sway. Technological innovation is primarily driven by advancements in extraction techniques, leading to enhanced purity and efficacy of black tea extracts, crucial for their burgeoning use in functional foods and dietary supplements. The regulatory landscape is evolving, with a growing emphasis on food safety standards and ingredient traceability, impacting product development and market entry strategies. Competitive product substitutes, such as other polyphenol-rich extracts, pose a constant challenge, necessitating continuous innovation in product differentiation and unique selling propositions. End-user demographics are shifting towards a more health-conscious consumer base actively seeking natural ingredients with proven health benefits, fueling demand for black tea extracts in beverages, cosmetics, and supplements. Mergers and acquisitions (M&A) trends are expected to continue as larger companies seek to consolidate their market position and expand their product portfolios. For instance, acquisitions of smaller, specialized extract manufacturers by larger players could increase market concentration. The market share of leading players is estimated to be around 15-20% in 2025, with smaller players collectively accounting for the remaining share. Barriers to innovation include the high cost of research and development for novel extraction methods and the stringent regulatory approval processes for new applications.
Black Tea Extracts Market Growth Trends & Insights
The Black Tea Extracts market is poised for substantial expansion, driven by a confluence of escalating health awareness, evolving consumer preferences for natural ingredients, and the versatile applications of these potent extracts across various industries. The global market size for black tea extracts is projected to reach an estimated $XXX Million in 2025, exhibiting a robust Compound Annual Growth Rate (CAGR) of approximately X.X% during the forecast period of 2025–2033. This growth is underpinned by increasing consumer adoption of functional foods and beverages, where black tea extracts are prized for their antioxidant properties and potential health benefits, including cardiovascular support and cognitive enhancement. The market penetration of black tea extracts in the dietary supplements segment is expected to witness a significant upswing, fueled by a growing demand for natural remedies and preventative health solutions. Technological disruptions in extraction processes, such as supercritical fluid extraction and enzyme-assisted extraction, are enhancing the yield and quality of extracts, making them more commercially viable and appealing to manufacturers. Consumer behavior is shifting towards a proactive approach to wellness, with a heightened interest in ingredients that offer tangible health advantages. This trend is a pivotal accelerator for the black tea extracts market, particularly within the cosmetics and beauty supplements sectors, where consumers are increasingly seeking natural anti-aging and skin-nourishing compounds. The rising popularity of ready-to-drink (RTD) functional beverages, infused with natural extracts for added health benefits, further contributes to the market's upward trajectory. Furthermore, the expanding e-commerce landscape is facilitating greater accessibility to specialized health and wellness products, including those featuring black tea extracts, thereby broadening the consumer base. The historical period from 2019–2024 laid the groundwork for this accelerated growth, with steady increases in demand and innovation. The base year of 2025 marks a crucial inflection point, setting the stage for sustained and dynamic expansion.
Dominant Regions, Countries, or Segments in Black Tea Extracts Market
The Black Tea Extracts market’s dominance is significantly influenced by a combination of factors including consumer health consciousness, regulatory environments, agricultural output of tea, and the presence of robust end-user industries. North America, particularly the United States, is emerging as a dominant region, driven by a large and health-conscious consumer base with a high disposable income, fostering strong demand for dietary supplements and functional foods. The increasing adoption of black tea extracts in cosmetics and beauty supplements, owing to their antioxidant and anti-inflammatory properties, further solidifies North America's leading position. In terms of countries, the United States leads, followed by European nations such as Germany and the United Kingdom, where regulatory frameworks are supportive of natural ingredient utilization and consumer demand for wellness products is consistently high.
Analyzing the segments:
- Form: The Powder form of black tea extracts currently holds a substantial market share, owing to its ease of handling, extended shelf life, and versatility in incorporation into a wide array of products, including instant beverages, nutritional bars, and capsule formulations. The Liquid form is also witnessing significant growth, particularly for direct consumption in beverages and skincare applications. Encapsulated forms are gaining traction for controlled release and improved bioavailability.
- Type: Hot Water Soluble (HWS) extracts are dominant due to their widespread application in traditional beverage formats and their cost-effectiveness. However, Cold Water Soluble (CWS) extracts are experiencing rapid growth, driven by the demand for clear, stable beverages and formulations that do not require heating, such as cold brews and ready-to-mix powders.
- Application: The Beverages segment is the largest contributor to the black tea extracts market, encompassing functional drinks, teas, and RTD beverages. The Dietary Supplements segment is a close second and is expected to witness the highest growth rate, propelled by increasing consumer focus on preventive healthcare and natural wellness solutions. The Cosmetics and Beauty Supplements segment is also a significant growth driver, capitalizing on the demand for natural anti-aging and skin-repairing ingredients. The Functional Foods segment, including snacks, cereals, and dairy products, is steadily expanding, as manufacturers incorporate these extracts for added health benefits.
The growth in these dominant regions and segments is further catalyzed by favorable economic policies that support the food and beverage industry, robust infrastructure for manufacturing and distribution, and a continuous influx of new product development catering to specific consumer needs. For instance, the economic policies in the US encouraging innovation in the health and wellness sector directly benefit the Black Tea Extracts market. The market share of the Beverages segment is estimated at over 35% in 2025, while Dietary Supplements are projected to grow at a CAGR of over 7% during the forecast period.
Black Tea Extracts Market Product Landscape
The Black Tea Extracts market is characterized by ongoing product innovations focused on enhancing the bioavailability, stability, and specific functionalities of black tea compounds. Manufacturers are developing advanced extraction technologies that yield highly concentrated and standardized extracts, rich in key polyphenols like theaflavins and thearubigins. These innovations are critical for the application of black tea extracts in high-performance dietary supplements for cardiovascular health and cognitive function, as well as in sophisticated cosmetic formulations for antioxidant protection and skin rejuvenation. Unique selling propositions include organic certification, allergen-free processing, and the development of specialized blends targeting specific health outcomes. Technological advancements are also enabling the creation of encapsulated black tea extracts, offering improved shelf-life and controlled release for enhanced efficacy in various applications.
Key Drivers, Barriers & Challenges in Black Tea Extracts Market
Key Drivers: The primary forces propelling the Black Tea Extracts market include the escalating global demand for natural and plant-based ingredients, driven by increasing consumer awareness of health and wellness. The recognized antioxidant and anti-inflammatory properties of black tea polyphenols are significant drivers, leading to their incorporation in dietary supplements, functional foods, and beverages. Technological advancements in extraction and purification methods are making these extracts more accessible and cost-effective. Furthermore, the growing trend of personalized nutrition and the demand for ingredients with scientifically backed health benefits are accelerating market growth.
Barriers & Challenges: Despite the positive outlook, the Black Tea Extracts market faces several challenges. Supply chain volatility for raw tea materials, influenced by climate change and geopolitical factors, can impact pricing and availability. Stringent and varying regulatory landscapes across different regions for food additives and health claims can pose hurdles for market entry and product development. Intense competition from other natural extracts with similar health benefits, such as green tea or fruit extracts, necessitates continuous innovation and effective marketing to highlight the unique advantages of black tea extracts. The cost of advanced extraction technologies and certifications can also be a barrier for smaller manufacturers.
Emerging Opportunities in Black Tea Extracts Market
Emerging opportunities in the Black Tea Extracts market lie in the development of novel applications for specific polyphenol fractions with targeted health benefits, such as anti-diabetic or anti-obesity properties. The untapped potential in emerging economies with a growing middle class and increasing health consciousness presents significant market expansion opportunities. Innovative delivery systems, including nano-encapsulation for enhanced absorption and stability, are poised to unlock new product categories in both the nutraceutical and cosmetic sectors. Furthermore, the increasing consumer preference for sustainable and ethically sourced ingredients creates a niche for black tea extracts produced through eco-friendly methods, offering a strong competitive advantage.
Growth Accelerators in the Black Tea Extracts Market Industry
Long-term growth in the Black Tea Extracts market is being significantly accelerated by breakthrough research validating the extensive health benefits of black tea compounds, leading to wider acceptance and demand from consumers and health professionals alike. Strategic partnerships between extract manufacturers and major food, beverage, and cosmetic companies are crucial for product innovation and market penetration, driving economies of scale. Market expansion strategies focusing on regions with nascent but rapidly growing health and wellness sectors, coupled with tailored product offerings, will be pivotal. The continuous refinement of extraction technologies, reducing production costs and improving extract quality, will further fuel adoption and profitability across all segments.
Key Players Shaping the Black Tea Extracts Market Market
- Phyto Life Sciences P Ltd
- Blueberry Agro Products Pvt Ltd
- AVT Naturals
- Martin Bauer Group
- James Finlay Limited
- Amax NutraSource Inc
- Synthite Industries
- Teawolf LLC
- Cymbio Pharma Pvt Ltd
Notable Milestones in Black Tea Extracts Market Sector
- 2023: Introduction of novel, cold-water soluble black tea extracts with enhanced clarity and stability for beverage applications.
- 2022: Significant increase in R&D investment by major players into the development of black tea extract formulations targeting cognitive health and stress reduction.
- 2021: Emergence of several smaller companies specializing in organic and ethically sourced black tea extracts, catering to a niche market of environmentally conscious consumers.
- 2020: Regulatory bodies in key markets update guidelines for health claims related to antioxidants, positively impacting the marketing of black tea extracts.
- 2019: Advancements in supercritical CO2 extraction technology lead to higher purity and yield of valuable polyphenols from black tea.
In-Depth Black Tea Extracts Market Market Outlook
The Black Tea Extracts market is projected for sustained and robust growth, driven by the confluence of increasing global health consciousness, advancements in extraction technology, and the expanding range of applications across diverse industries. Key growth accelerators, including validated health benefits, strategic collaborations, and market expansion into emerging economies, will continue to shape the industry's trajectory. The focus on sustainable sourcing and innovative product development, particularly in the nutraceutical and cosmetic sectors, presents significant opportunities for market players to differentiate and capture value. The future outlook is characterized by increasing demand for high-purity, functional extracts, positioning the black tea extracts market as a vital component of the global health and wellness landscape.
Black Tea Extracts Market Segmentation
-
1. Form
- 1.1. Liquid
- 1.2. Encapsulated
- 1.3. Powder
-
2. Type
- 2.1. Hot Water Soluble (HWS)
- 2.2. Cold Water Soluble (CWS)
-
3. Application
- 3.1. Beverages
- 3.2. Functional Foods
- 3.3. Cosmetics and Beauty Supplements
- 3.4. Dietary Supplements
- 3.5. Others
Black Tea Extracts Market Segmentation By Geography
-
1. North America
- 1.1. United States
- 1.2. Canada
- 1.3. Mexico
- 1.4. Rest of North America
-
2. Europe
- 2.1. United Kingdom
- 2.2. Germany
- 2.3. France
- 2.4. Russia
- 2.5. Italy
- 2.6. Spain
- 2.7. Rest of Europe
-
3. Asia Pacific
- 3.1. India
- 3.2. China
- 3.3. Japan
- 3.4. Australia
- 3.5. Rest of Asia Pacific
-
4. South America
- 4.1. Brazil
- 4.2. Argentina
- 4.3. Rest of South America
- 5. Middle East
-
6. South Africa
- 6.1. Saudi Arabia
- 6.2. Rest of Middle East
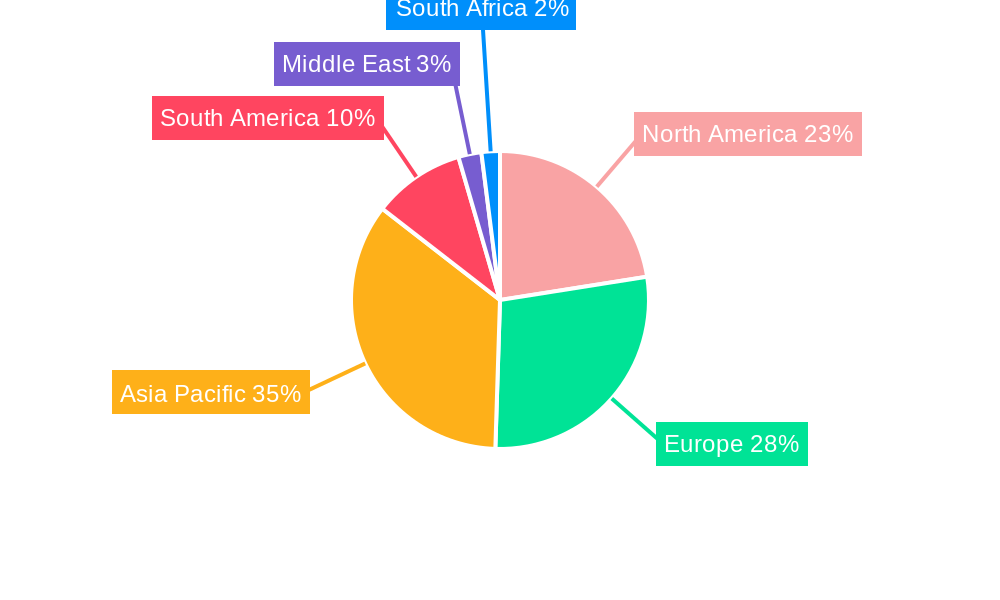
Black Tea Extracts Market Regional Market Share
Geographic Coverage of Black Tea Extracts Market
Black Tea Extracts Market REPORT HIGHLIGHTS
| Aspects | Details |
|---|---|
| Study Period | 2020-2034 |
| Base Year | 2025 |
| Estimated Year | 2026 |
| Forecast Period | 2026-2034 |
| Historical Period | 2020-2025 |
| Growth Rate | CAGR of 4.50% from 2020-2034 |
| Segmentation |
|
Table of Contents
- 1. Introduction
- 1.1. Research Scope
- 1.2. Market Segmentation
- 1.3. Research Methodology
- 1.4. Definitions and Assumptions
- 2. Executive Summary
- 2.1. Introduction
- 3. Market Dynamics
- 3.1. Introduction
- 3.2. Market Drivers
- 3.2.1. Awareness Of Health Benefits Of Oleoresins; Rise Of Clean Label Products
- 3.3. Market Restrains
- 3.3.1. Supply Chain Volatility and Availability Of Other Flavor Ingredients
- 3.4. Market Trends
- 3.4.1. Growing Demand for Functional Food
- 4. Market Factor Analysis
- 4.1. Porters Five Forces
- 4.2. Supply/Value Chain
- 4.3. PESTEL analysis
- 4.4. Market Entropy
- 4.5. Patent/Trademark Analysis
- 5. Global Black Tea Extracts Market Analysis, Insights and Forecast, 2020-2032
- 5.1. Market Analysis, Insights and Forecast - by Form
- 5.1.1. Liquid
- 5.1.2. Encapsulated
- 5.1.3. Powder
- 5.2. Market Analysis, Insights and Forecast - by Type
- 5.2.1. Hot Water Soluble (HWS)
- 5.2.2. Cold Water Soluble (CWS)
- 5.3. Market Analysis, Insights and Forecast - by Application
- 5.3.1. Beverages
- 5.3.2. Functional Foods
- 5.3.3. Cosmetics and Beauty Supplements
- 5.3.4. Dietary Supplements
- 5.3.5. Others
- 5.4. Market Analysis, Insights and Forecast - by Region
- 5.4.1. North America
- 5.4.2. Europe
- 5.4.3. Asia Pacific
- 5.4.4. South America
- 5.4.5. Middle East
- 5.4.6. South Africa
- 5.1. Market Analysis, Insights and Forecast - by Form
- 6. North America Black Tea Extracts Market Analysis, Insights and Forecast, 2020-2032
- 6.1. Market Analysis, Insights and Forecast - by Form
- 6.1.1. Liquid
- 6.1.2. Encapsulated
- 6.1.3. Powder
- 6.2. Market Analysis, Insights and Forecast - by Type
- 6.2.1. Hot Water Soluble (HWS)
- 6.2.2. Cold Water Soluble (CWS)
- 6.3. Market Analysis, Insights and Forecast - by Application
- 6.3.1. Beverages
- 6.3.2. Functional Foods
- 6.3.3. Cosmetics and Beauty Supplements
- 6.3.4. Dietary Supplements
- 6.3.5. Others
- 6.1. Market Analysis, Insights and Forecast - by Form
- 7. Europe Black Tea Extracts Market Analysis, Insights and Forecast, 2020-2032
- 7.1. Market Analysis, Insights and Forecast - by Form
- 7.1.1. Liquid
- 7.1.2. Encapsulated
- 7.1.3. Powder
- 7.2. Market Analysis, Insights and Forecast - by Type
- 7.2.1. Hot Water Soluble (HWS)
- 7.2.2. Cold Water Soluble (CWS)
- 7.3. Market Analysis, Insights and Forecast - by Application
- 7.3.1. Beverages
- 7.3.2. Functional Foods
- 7.3.3. Cosmetics and Beauty Supplements
- 7.3.4. Dietary Supplements
- 7.3.5. Others
- 7.1. Market Analysis, Insights and Forecast - by Form
- 8. Asia Pacific Black Tea Extracts Market Analysis, Insights and Forecast, 2020-2032
- 8.1. Market Analysis, Insights and Forecast - by Form
- 8.1.1. Liquid
- 8.1.2. Encapsulated
- 8.1.3. Powder
- 8.2. Market Analysis, Insights and Forecast - by Type
- 8.2.1. Hot Water Soluble (HWS)
- 8.2.2. Cold Water Soluble (CWS)
- 8.3. Market Analysis, Insights and Forecast - by Application
- 8.3.1. Beverages
- 8.3.2. Functional Foods
- 8.3.3. Cosmetics and Beauty Supplements
- 8.3.4. Dietary Supplements
- 8.3.5. Others
- 8.1. Market Analysis, Insights and Forecast - by Form
- 9. South America Black Tea Extracts Market Analysis, Insights and Forecast, 2020-2032
- 9.1. Market Analysis, Insights and Forecast - by Form
- 9.1.1. Liquid
- 9.1.2. Encapsulated
- 9.1.3. Powder
- 9.2. Market Analysis, Insights and Forecast - by Type
- 9.2.1. Hot Water Soluble (HWS)
- 9.2.2. Cold Water Soluble (CWS)
- 9.3. Market Analysis, Insights and Forecast - by Application
- 9.3.1. Beverages
- 9.3.2. Functional Foods
- 9.3.3. Cosmetics and Beauty Supplements
- 9.3.4. Dietary Supplements
- 9.3.5. Others
- 9.1. Market Analysis, Insights and Forecast - by Form
- 10. Middle East Black Tea Extracts Market Analysis, Insights and Forecast, 2020-2032
- 10.1. Market Analysis, Insights and Forecast - by Form
- 10.1.1. Liquid
- 10.1.2. Encapsulated
- 10.1.3. Powder
- 10.2. Market Analysis, Insights and Forecast - by Type
- 10.2.1. Hot Water Soluble (HWS)
- 10.2.2. Cold Water Soluble (CWS)
- 10.3. Market Analysis, Insights and Forecast - by Application
- 10.3.1. Beverages
- 10.3.2. Functional Foods
- 10.3.3. Cosmetics and Beauty Supplements
- 10.3.4. Dietary Supplements
- 10.3.5. Others
- 10.1. Market Analysis, Insights and Forecast - by Form
- 11. South Africa Black Tea Extracts Market Analysis, Insights and Forecast, 2020-2032
- 11.1. Market Analysis, Insights and Forecast - by Form
- 11.1.1. Liquid
- 11.1.2. Encapsulated
- 11.1.3. Powder
- 11.2. Market Analysis, Insights and Forecast - by Type
- 11.2.1. Hot Water Soluble (HWS)
- 11.2.2. Cold Water Soluble (CWS)
- 11.3. Market Analysis, Insights and Forecast - by Application
- 11.3.1. Beverages
- 11.3.2. Functional Foods
- 11.3.3. Cosmetics and Beauty Supplements
- 11.3.4. Dietary Supplements
- 11.3.5. Others
- 11.1. Market Analysis, Insights and Forecast - by Form
- 12. Competitive Analysis
- 12.1. Global Market Share Analysis 2025
- 12.2. Company Profiles
- 12.2.1 Phyto Life Sciences P Ltd
- 12.2.1.1. Overview
- 12.2.1.2. Products
- 12.2.1.3. SWOT Analysis
- 12.2.1.4. Recent Developments
- 12.2.1.5. Financials (Based on Availability)
- 12.2.2 Blueberry Agro Products Pvt Ltd *List Not Exhaustive
- 12.2.2.1. Overview
- 12.2.2.2. Products
- 12.2.2.3. SWOT Analysis
- 12.2.2.4. Recent Developments
- 12.2.2.5. Financials (Based on Availability)
- 12.2.3 AVT Naturals
- 12.2.3.1. Overview
- 12.2.3.2. Products
- 12.2.3.3. SWOT Analysis
- 12.2.3.4. Recent Developments
- 12.2.3.5. Financials (Based on Availability)
- 12.2.4 Martin Bauer Group
- 12.2.4.1. Overview
- 12.2.4.2. Products
- 12.2.4.3. SWOT Analysis
- 12.2.4.4. Recent Developments
- 12.2.4.5. Financials (Based on Availability)
- 12.2.5 James Finlay Limited
- 12.2.5.1. Overview
- 12.2.5.2. Products
- 12.2.5.3. SWOT Analysis
- 12.2.5.4. Recent Developments
- 12.2.5.5. Financials (Based on Availability)
- 12.2.6 Amax NutraSource Inc
- 12.2.6.1. Overview
- 12.2.6.2. Products
- 12.2.6.3. SWOT Analysis
- 12.2.6.4. Recent Developments
- 12.2.6.5. Financials (Based on Availability)
- 12.2.7 Synthite Industries
- 12.2.7.1. Overview
- 12.2.7.2. Products
- 12.2.7.3. SWOT Analysis
- 12.2.7.4. Recent Developments
- 12.2.7.5. Financials (Based on Availability)
- 12.2.8 Teawolf LLC
- 12.2.8.1. Overview
- 12.2.8.2. Products
- 12.2.8.3. SWOT Analysis
- 12.2.8.4. Recent Developments
- 12.2.8.5. Financials (Based on Availability)
- 12.2.9 Cymbio Pharma Pvt Ltd
- 12.2.9.1. Overview
- 12.2.9.2. Products
- 12.2.9.3. SWOT Analysis
- 12.2.9.4. Recent Developments
- 12.2.9.5. Financials (Based on Availability)
- 12.2.1 Phyto Life Sciences P Ltd
List of Figures
- Figure 1: Global Black Tea Extracts Market Revenue Breakdown (Million, %) by Region 2025 & 2033
- Figure 2: Global Black Tea Extracts Market Volume Breakdown (K Tons, %) by Region 2025 & 2033
- Figure 3: North America Black Tea Extracts Market Revenue (Million), by Form 2025 & 2033
- Figure 4: North America Black Tea Extracts Market Volume (K Tons), by Form 2025 & 2033
- Figure 5: North America Black Tea Extracts Market Revenue Share (%), by Form 2025 & 2033
- Figure 6: North America Black Tea Extracts Market Volume Share (%), by Form 2025 & 2033
- Figure 7: North America Black Tea Extracts Market Revenue (Million), by Type 2025 & 2033
- Figure 8: North America Black Tea Extracts Market Volume (K Tons), by Type 2025 & 2033
- Figure 9: North America Black Tea Extracts Market Revenue Share (%), by Type 2025 & 2033
- Figure 10: North America Black Tea Extracts Market Volume Share (%), by Type 2025 & 2033
- Figure 11: North America Black Tea Extracts Market Revenue (Million), by Application 2025 & 2033
- Figure 12: North America Black Tea Extracts Market Volume (K Tons), by Application 2025 & 2033
- Figure 13: North America Black Tea Extracts Market Revenue Share (%), by Application 2025 & 2033
- Figure 14: North America Black Tea Extracts Market Volume Share (%), by Application 2025 & 2033
- Figure 15: North America Black Tea Extracts Market Revenue (Million), by Country 2025 & 2033
- Figure 16: North America Black Tea Extracts Market Volume (K Tons), by Country 2025 & 2033
- Figure 17: North America Black Tea Extracts Market Revenue Share (%), by Country 2025 & 2033
- Figure 18: North America Black Tea Extracts Market Volume Share (%), by Country 2025 & 2033
- Figure 19: Europe Black Tea Extracts Market Revenue (Million), by Form 2025 & 2033
- Figure 20: Europe Black Tea Extracts Market Volume (K Tons), by Form 2025 & 2033
- Figure 21: Europe Black Tea Extracts Market Revenue Share (%), by Form 2025 & 2033
- Figure 22: Europe Black Tea Extracts Market Volume Share (%), by Form 2025 & 2033
- Figure 23: Europe Black Tea Extracts Market Revenue (Million), by Type 2025 & 2033
- Figure 24: Europe Black Tea Extracts Market Volume (K Tons), by Type 2025 & 2033
- Figure 25: Europe Black Tea Extracts Market Revenue Share (%), by Type 2025 & 2033
- Figure 26: Europe Black Tea Extracts Market Volume Share (%), by Type 2025 & 2033
- Figure 27: Europe Black Tea Extracts Market Revenue (Million), by Application 2025 & 2033
- Figure 28: Europe Black Tea Extracts Market Volume (K Tons), by Application 2025 & 2033
- Figure 29: Europe Black Tea Extracts Market Revenue Share (%), by Application 2025 & 2033
- Figure 30: Europe Black Tea Extracts Market Volume Share (%), by Application 2025 & 2033
- Figure 31: Europe Black Tea Extracts Market Revenue (Million), by Country 2025 & 2033
- Figure 32: Europe Black Tea Extracts Market Volume (K Tons), by Country 2025 & 2033
- Figure 33: Europe Black Tea Extracts Market Revenue Share (%), by Country 2025 & 2033
- Figure 34: Europe Black Tea Extracts Market Volume Share (%), by Country 2025 & 2033
- Figure 35: Asia Pacific Black Tea Extracts Market Revenue (Million), by Form 2025 & 2033
- Figure 36: Asia Pacific Black Tea Extracts Market Volume (K Tons), by Form 2025 & 2033
- Figure 37: Asia Pacific Black Tea Extracts Market Revenue Share (%), by Form 2025 & 2033
- Figure 38: Asia Pacific Black Tea Extracts Market Volume Share (%), by Form 2025 & 2033
- Figure 39: Asia Pacific Black Tea Extracts Market Revenue (Million), by Type 2025 & 2033
- Figure 40: Asia Pacific Black Tea Extracts Market Volume (K Tons), by Type 2025 & 2033
- Figure 41: Asia Pacific Black Tea Extracts Market Revenue Share (%), by Type 2025 & 2033
- Figure 42: Asia Pacific Black Tea Extracts Market Volume Share (%), by Type 2025 & 2033
- Figure 43: Asia Pacific Black Tea Extracts Market Revenue (Million), by Application 2025 & 2033
- Figure 44: Asia Pacific Black Tea Extracts Market Volume (K Tons), by Application 2025 & 2033
- Figure 45: Asia Pacific Black Tea Extracts Market Revenue Share (%), by Application 2025 & 2033
- Figure 46: Asia Pacific Black Tea Extracts Market Volume Share (%), by Application 2025 & 2033
- Figure 47: Asia Pacific Black Tea Extracts Market Revenue (Million), by Country 2025 & 2033
- Figure 48: Asia Pacific Black Tea Extracts Market Volume (K Tons), by Country 2025 & 2033
- Figure 49: Asia Pacific Black Tea Extracts Market Revenue Share (%), by Country 2025 & 2033
- Figure 50: Asia Pacific Black Tea Extracts Market Volume Share (%), by Country 2025 & 2033
- Figure 51: South America Black Tea Extracts Market Revenue (Million), by Form 2025 & 2033
- Figure 52: South America Black Tea Extracts Market Volume (K Tons), by Form 2025 & 2033
- Figure 53: South America Black Tea Extracts Market Revenue Share (%), by Form 2025 & 2033
- Figure 54: South America Black Tea Extracts Market Volume Share (%), by Form 2025 & 2033
- Figure 55: South America Black Tea Extracts Market Revenue (Million), by Type 2025 & 2033
- Figure 56: South America Black Tea Extracts Market Volume (K Tons), by Type 2025 & 2033
- Figure 57: South America Black Tea Extracts Market Revenue Share (%), by Type 2025 & 2033
- Figure 58: South America Black Tea Extracts Market Volume Share (%), by Type 2025 & 2033
- Figure 59: South America Black Tea Extracts Market Revenue (Million), by Application 2025 & 2033
- Figure 60: South America Black Tea Extracts Market Volume (K Tons), by Application 2025 & 2033
- Figure 61: South America Black Tea Extracts Market Revenue Share (%), by Application 2025 & 2033
- Figure 62: South America Black Tea Extracts Market Volume Share (%), by Application 2025 & 2033
- Figure 63: South America Black Tea Extracts Market Revenue (Million), by Country 2025 & 2033
- Figure 64: South America Black Tea Extracts Market Volume (K Tons), by Country 2025 & 2033
- Figure 65: South America Black Tea Extracts Market Revenue Share (%), by Country 2025 & 2033
- Figure 66: South America Black Tea Extracts Market Volume Share (%), by Country 2025 & 2033
- Figure 67: Middle East Black Tea Extracts Market Revenue (Million), by Form 2025 & 2033
- Figure 68: Middle East Black Tea Extracts Market Volume (K Tons), by Form 2025 & 2033
- Figure 69: Middle East Black Tea Extracts Market Revenue Share (%), by Form 2025 & 2033
- Figure 70: Middle East Black Tea Extracts Market Volume Share (%), by Form 2025 & 2033
- Figure 71: Middle East Black Tea Extracts Market Revenue (Million), by Type 2025 & 2033
- Figure 72: Middle East Black Tea Extracts Market Volume (K Tons), by Type 2025 & 2033
- Figure 73: Middle East Black Tea Extracts Market Revenue Share (%), by Type 2025 & 2033
- Figure 74: Middle East Black Tea Extracts Market Volume Share (%), by Type 2025 & 2033
- Figure 75: Middle East Black Tea Extracts Market Revenue (Million), by Application 2025 & 2033
- Figure 76: Middle East Black Tea Extracts Market Volume (K Tons), by Application 2025 & 2033
- Figure 77: Middle East Black Tea Extracts Market Revenue Share (%), by Application 2025 & 2033
- Figure 78: Middle East Black Tea Extracts Market Volume Share (%), by Application 2025 & 2033
- Figure 79: Middle East Black Tea Extracts Market Revenue (Million), by Country 2025 & 2033
- Figure 80: Middle East Black Tea Extracts Market Volume (K Tons), by Country 2025 & 2033
- Figure 81: Middle East Black Tea Extracts Market Revenue Share (%), by Country 2025 & 2033
- Figure 82: Middle East Black Tea Extracts Market Volume Share (%), by Country 2025 & 2033
- Figure 83: South Africa Black Tea Extracts Market Revenue (Million), by Form 2025 & 2033
- Figure 84: South Africa Black Tea Extracts Market Volume (K Tons), by Form 2025 & 2033
- Figure 85: South Africa Black Tea Extracts Market Revenue Share (%), by Form 2025 & 2033
- Figure 86: South Africa Black Tea Extracts Market Volume Share (%), by Form 2025 & 2033
- Figure 87: South Africa Black Tea Extracts Market Revenue (Million), by Type 2025 & 2033
- Figure 88: South Africa Black Tea Extracts Market Volume (K Tons), by Type 2025 & 2033
- Figure 89: South Africa Black Tea Extracts Market Revenue Share (%), by Type 2025 & 2033
- Figure 90: South Africa Black Tea Extracts Market Volume Share (%), by Type 2025 & 2033
- Figure 91: South Africa Black Tea Extracts Market Revenue (Million), by Application 2025 & 2033
- Figure 92: South Africa Black Tea Extracts Market Volume (K Tons), by Application 2025 & 2033
- Figure 93: South Africa Black Tea Extracts Market Revenue Share (%), by Application 2025 & 2033
- Figure 94: South Africa Black Tea Extracts Market Volume Share (%), by Application 2025 & 2033
- Figure 95: South Africa Black Tea Extracts Market Revenue (Million), by Country 2025 & 2033
- Figure 96: South Africa Black Tea Extracts Market Volume (K Tons), by Country 2025 & 2033
- Figure 97: South Africa Black Tea Extracts Market Revenue Share (%), by Country 2025 & 2033
- Figure 98: South Africa Black Tea Extracts Market Volume Share (%), by Country 2025 & 2033
List of Tables
- Table 1: Global Black Tea Extracts Market Revenue Million Forecast, by Form 2020 & 2033
- Table 2: Global Black Tea Extracts Market Volume K Tons Forecast, by Form 2020 & 2033
- Table 3: Global Black Tea Extracts Market Revenue Million Forecast, by Type 2020 & 2033
- Table 4: Global Black Tea Extracts Market Volume K Tons Forecast, by Type 2020 & 2033
- Table 5: Global Black Tea Extracts Market Revenue Million Forecast, by Application 2020 & 2033
- Table 6: Global Black Tea Extracts Market Volume K Tons Forecast, by Application 2020 & 2033
- Table 7: Global Black Tea Extracts Market Revenue Million Forecast, by Region 2020 & 2033
- Table 8: Global Black Tea Extracts Market Volume K Tons Forecast, by Region 2020 & 2033
- Table 9: Global Black Tea Extracts Market Revenue Million Forecast, by Form 2020 & 2033
- Table 10: Global Black Tea Extracts Market Volume K Tons Forecast, by Form 2020 & 2033
- Table 11: Global Black Tea Extracts Market Revenue Million Forecast, by Type 2020 & 2033
- Table 12: Global Black Tea Extracts Market Volume K Tons Forecast, by Type 2020 & 2033
- Table 13: Global Black Tea Extracts Market Revenue Million Forecast, by Application 2020 & 2033
- Table 14: Global Black Tea Extracts Market Volume K Tons Forecast, by Application 2020 & 2033
- Table 15: Global Black Tea Extracts Market Revenue Million Forecast, by Country 2020 & 2033
- Table 16: Global Black Tea Extracts Market Volume K Tons Forecast, by Country 2020 & 2033
- Table 17: United States Black Tea Extracts Market Revenue (Million) Forecast, by Application 2020 & 2033
- Table 18: United States Black Tea Extracts Market Volume (K Tons) Forecast, by Application 2020 & 2033
- Table 19: Canada Black Tea Extracts Market Revenue (Million) Forecast, by Application 2020 & 2033
- Table 20: Canada Black Tea Extracts Market Volume (K Tons) Forecast, by Application 2020 & 2033
- Table 21: Mexico Black Tea Extracts Market Revenue (Million) Forecast, by Application 2020 & 2033
- Table 22: Mexico Black Tea Extracts Market Volume (K Tons) Forecast, by Application 2020 & 2033
- Table 23: Rest of North America Black Tea Extracts Market Revenue (Million) Forecast, by Application 2020 & 2033
- Table 24: Rest of North America Black Tea Extracts Market Volume (K Tons) Forecast, by Application 2020 & 2033
- Table 25: Global Black Tea Extracts Market Revenue Million Forecast, by Form 2020 & 2033
- Table 26: Global Black Tea Extracts Market Volume K Tons Forecast, by Form 2020 & 2033
- Table 27: Global Black Tea Extracts Market Revenue Million Forecast, by Type 2020 & 2033
- Table 28: Global Black Tea Extracts Market Volume K Tons Forecast, by Type 2020 & 2033
- Table 29: Global Black Tea Extracts Market Revenue Million Forecast, by Application 2020 & 2033
- Table 30: Global Black Tea Extracts Market Volume K Tons Forecast, by Application 2020 & 2033
- Table 31: Global Black Tea Extracts Market Revenue Million Forecast, by Country 2020 & 2033
- Table 32: Global Black Tea Extracts Market Volume K Tons Forecast, by Country 2020 & 2033
- Table 33: United Kingdom Black Tea Extracts Market Revenue (Million) Forecast, by Application 2020 & 2033
- Table 34: United Kingdom Black Tea Extracts Market Volume (K Tons) Forecast, by Application 2020 & 2033
- Table 35: Germany Black Tea Extracts Market Revenue (Million) Forecast, by Application 2020 & 2033
- Table 36: Germany Black Tea Extracts Market Volume (K Tons) Forecast, by Application 2020 & 2033
- Table 37: France Black Tea Extracts Market Revenue (Million) Forecast, by Application 2020 & 2033
- Table 38: France Black Tea Extracts Market Volume (K Tons) Forecast, by Application 2020 & 2033
- Table 39: Russia Black Tea Extracts Market Revenue (Million) Forecast, by Application 2020 & 2033
- Table 40: Russia Black Tea Extracts Market Volume (K Tons) Forecast, by Application 2020 & 2033
- Table 41: Italy Black Tea Extracts Market Revenue (Million) Forecast, by Application 2020 & 2033
- Table 42: Italy Black Tea Extracts Market Volume (K Tons) Forecast, by Application 2020 & 2033
- Table 43: Spain Black Tea Extracts Market Revenue (Million) Forecast, by Application 2020 & 2033
- Table 44: Spain Black Tea Extracts Market Volume (K Tons) Forecast, by Application 2020 & 2033
- Table 45: Rest of Europe Black Tea Extracts Market Revenue (Million) Forecast, by Application 2020 & 2033
- Table 46: Rest of Europe Black Tea Extracts Market Volume (K Tons) Forecast, by Application 2020 & 2033
- Table 47: Global Black Tea Extracts Market Revenue Million Forecast, by Form 2020 & 2033
- Table 48: Global Black Tea Extracts Market Volume K Tons Forecast, by Form 2020 & 2033
- Table 49: Global Black Tea Extracts Market Revenue Million Forecast, by Type 2020 & 2033
- Table 50: Global Black Tea Extracts Market Volume K Tons Forecast, by Type 2020 & 2033
- Table 51: Global Black Tea Extracts Market Revenue Million Forecast, by Application 2020 & 2033
- Table 52: Global Black Tea Extracts Market Volume K Tons Forecast, by Application 2020 & 2033
- Table 53: Global Black Tea Extracts Market Revenue Million Forecast, by Country 2020 & 2033
- Table 54: Global Black Tea Extracts Market Volume K Tons Forecast, by Country 2020 & 2033
- Table 55: India Black Tea Extracts Market Revenue (Million) Forecast, by Application 2020 & 2033
- Table 56: India Black Tea Extracts Market Volume (K Tons) Forecast, by Application 2020 & 2033
- Table 57: China Black Tea Extracts Market Revenue (Million) Forecast, by Application 2020 & 2033
- Table 58: China Black Tea Extracts Market Volume (K Tons) Forecast, by Application 2020 & 2033
- Table 59: Japan Black Tea Extracts Market Revenue (Million) Forecast, by Application 2020 & 2033
- Table 60: Japan Black Tea Extracts Market Volume (K Tons) Forecast, by Application 2020 & 2033
- Table 61: Australia Black Tea Extracts Market Revenue (Million) Forecast, by Application 2020 & 2033
- Table 62: Australia Black Tea Extracts Market Volume (K Tons) Forecast, by Application 2020 & 2033
- Table 63: Rest of Asia Pacific Black Tea Extracts Market Revenue (Million) Forecast, by Application 2020 & 2033
- Table 64: Rest of Asia Pacific Black Tea Extracts Market Volume (K Tons) Forecast, by Application 2020 & 2033
- Table 65: Global Black Tea Extracts Market Revenue Million Forecast, by Form 2020 & 2033
- Table 66: Global Black Tea Extracts Market Volume K Tons Forecast, by Form 2020 & 2033
- Table 67: Global Black Tea Extracts Market Revenue Million Forecast, by Type 2020 & 2033
- Table 68: Global Black Tea Extracts Market Volume K Tons Forecast, by Type 2020 & 2033
- Table 69: Global Black Tea Extracts Market Revenue Million Forecast, by Application 2020 & 2033
- Table 70: Global Black Tea Extracts Market Volume K Tons Forecast, by Application 2020 & 2033
- Table 71: Global Black Tea Extracts Market Revenue Million Forecast, by Country 2020 & 2033
- Table 72: Global Black Tea Extracts Market Volume K Tons Forecast, by Country 2020 & 2033
- Table 73: Brazil Black Tea Extracts Market Revenue (Million) Forecast, by Application 2020 & 2033
- Table 74: Brazil Black Tea Extracts Market Volume (K Tons) Forecast, by Application 2020 & 2033
- Table 75: Argentina Black Tea Extracts Market Revenue (Million) Forecast, by Application 2020 & 2033
- Table 76: Argentina Black Tea Extracts Market Volume (K Tons) Forecast, by Application 2020 & 2033
- Table 77: Rest of South America Black Tea Extracts Market Revenue (Million) Forecast, by Application 2020 & 2033
- Table 78: Rest of South America Black Tea Extracts Market Volume (K Tons) Forecast, by Application 2020 & 2033
- Table 79: Global Black Tea Extracts Market Revenue Million Forecast, by Form 2020 & 2033
- Table 80: Global Black Tea Extracts Market Volume K Tons Forecast, by Form 2020 & 2033
- Table 81: Global Black Tea Extracts Market Revenue Million Forecast, by Type 2020 & 2033
- Table 82: Global Black Tea Extracts Market Volume K Tons Forecast, by Type 2020 & 2033
- Table 83: Global Black Tea Extracts Market Revenue Million Forecast, by Application 2020 & 2033
- Table 84: Global Black Tea Extracts Market Volume K Tons Forecast, by Application 2020 & 2033
- Table 85: Global Black Tea Extracts Market Revenue Million Forecast, by Country 2020 & 2033
- Table 86: Global Black Tea Extracts Market Volume K Tons Forecast, by Country 2020 & 2033
- Table 87: Global Black Tea Extracts Market Revenue Million Forecast, by Form 2020 & 2033
- Table 88: Global Black Tea Extracts Market Volume K Tons Forecast, by Form 2020 & 2033
- Table 89: Global Black Tea Extracts Market Revenue Million Forecast, by Type 2020 & 2033
- Table 90: Global Black Tea Extracts Market Volume K Tons Forecast, by Type 2020 & 2033
- Table 91: Global Black Tea Extracts Market Revenue Million Forecast, by Application 2020 & 2033
- Table 92: Global Black Tea Extracts Market Volume K Tons Forecast, by Application 2020 & 2033
- Table 93: Global Black Tea Extracts Market Revenue Million Forecast, by Country 2020 & 2033
- Table 94: Global Black Tea Extracts Market Volume K Tons Forecast, by Country 2020 & 2033
- Table 95: Saudi Arabia Black Tea Extracts Market Revenue (Million) Forecast, by Application 2020 & 2033
- Table 96: Saudi Arabia Black Tea Extracts Market Volume (K Tons) Forecast, by Application 2020 & 2033
- Table 97: Rest of Middle East Black Tea Extracts Market Revenue (Million) Forecast, by Application 2020 & 2033
- Table 98: Rest of Middle East Black Tea Extracts Market Volume (K Tons) Forecast, by Application 2020 & 2033
Frequently Asked Questions
1. What is the projected Compound Annual Growth Rate (CAGR) of the Black Tea Extracts Market?
The projected CAGR is approximately 4.50%.
2. Which companies are prominent players in the Black Tea Extracts Market?
Key companies in the market include Phyto Life Sciences P Ltd, Blueberry Agro Products Pvt Ltd *List Not Exhaustive, AVT Naturals, Martin Bauer Group, James Finlay Limited, Amax NutraSource Inc, Synthite Industries, Teawolf LLC, Cymbio Pharma Pvt Ltd.
3. What are the main segments of the Black Tea Extracts Market?
The market segments include Form, Type, Application.
4. Can you provide details about the market size?
The market size is estimated to be USD XX Million as of 2022.
5. What are some drivers contributing to market growth?
Awareness Of Health Benefits Of Oleoresins; Rise Of Clean Label Products.
6. What are the notable trends driving market growth?
Growing Demand for Functional Food.
7. Are there any restraints impacting market growth?
Supply Chain Volatility and Availability Of Other Flavor Ingredients.
8. Can you provide examples of recent developments in the market?
N/A
9. What pricing options are available for accessing the report?
Pricing options include single-user, multi-user, and enterprise licenses priced at USD 4750, USD 5250, and USD 8750 respectively.
10. Is the market size provided in terms of value or volume?
The market size is provided in terms of value, measured in Million and volume, measured in K Tons.
11. Are there any specific market keywords associated with the report?
Yes, the market keyword associated with the report is "Black Tea Extracts Market," which aids in identifying and referencing the specific market segment covered.
12. How do I determine which pricing option suits my needs best?
The pricing options vary based on user requirements and access needs. Individual users may opt for single-user licenses, while businesses requiring broader access may choose multi-user or enterprise licenses for cost-effective access to the report.
13. Are there any additional resources or data provided in the Black Tea Extracts Market report?
While the report offers comprehensive insights, it's advisable to review the specific contents or supplementary materials provided to ascertain if additional resources or data are available.
14. How can I stay updated on further developments or reports in the Black Tea Extracts Market?
To stay informed about further developments, trends, and reports in the Black Tea Extracts Market, consider subscribing to industry newsletters, following relevant companies and organizations, or regularly checking reputable industry news sources and publications.
Methodology
Step 1 - Identification of Relevant Samples Size from Population Database


Step 2 - Approaches for Defining Global Market Size (Value, Volume* & Price*)

Note*: In applicable scenarios
Step 3 - Data Sources
Primary Research
- Web Analytics
- Survey Reports
- Research Institute
- Latest Research Reports
- Opinion Leaders
Secondary Research
- Annual Reports
- White Paper
- Latest Press Release
- Industry Association
- Paid Database
- Investor Presentations

Step 4 - Data Triangulation
Involves using different sources of information in order to increase the validity of a study
These sources are likely to be stakeholders in a program - participants, other researchers, program staff, other community members, and so on.
Then we put all data in single framework & apply various statistical tools to find out the dynamic on the market.
During the analysis stage, feedback from the stakeholder groups would be compared to determine areas of agreement as well as areas of divergence