

Key Insights
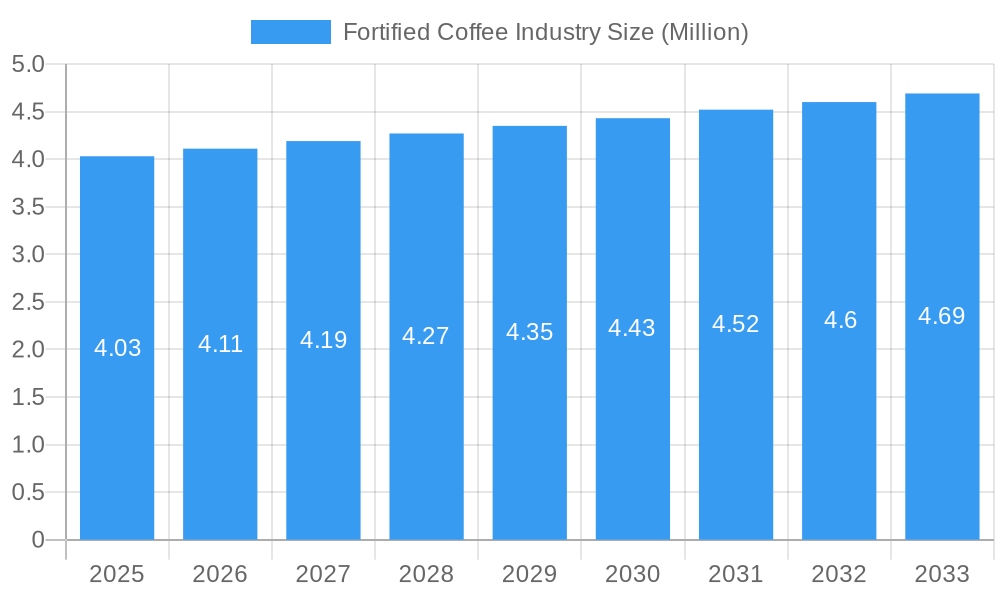
The global fortified coffee market is projected to reach a substantial size of approximately USD 4.03 million, demonstrating a steady Compound Annual Growth Rate (CAGR) of around 2.03% over the study period of 2019-2033. This growth trajectory is underpinned by several compelling market drivers, primarily the increasing consumer demand for functional beverages that offer health benefits beyond basic hydration and energy. As awareness of the potential advantages of ingredients like vitamins, minerals, and adaptogens found in fortified coffee continues to rise, consumers are actively seeking out products that align with their wellness goals. Furthermore, the evolving lifestyle trends, including a greater emphasis on preventative healthcare and busy schedules that necessitate convenient, health-conscious beverage options, are also fueling market expansion. The convenience offered by ready-to-drink (RTD) fortified coffee formats, coupled with innovative product development by leading companies, is further contributing to market penetration and accessibility.
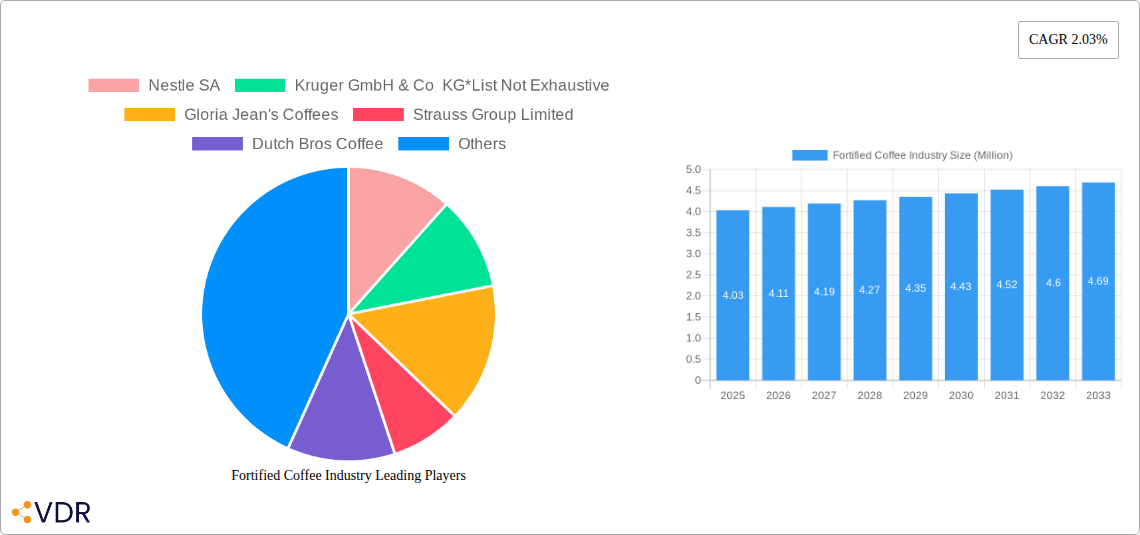
Fortified Coffee Industry Market Size (In Million)
The market's expansion is also influenced by shifts in distribution channels, with online stores and supermarkets/hypermarkets playing an increasingly significant role in reaching a wider consumer base. While the market presents robust growth opportunities, certain restraints, such as the higher price point of fortified coffee compared to conventional varieties and potential consumer skepticism regarding the efficacy and taste of added ingredients, need to be addressed by manufacturers. Nevertheless, the diversified product segmentation, encompassing whole bean, ground coffee, and RTD options, caters to a broad spectrum of consumer preferences. Major players like Nestle SA, Starbucks Corporation, and Tata Coffee are actively investing in research and development and strategic collaborations to innovate and expand their product portfolios, capitalizing on the growing health and wellness trend within the coffee industry and driving the market towards continued positive performance.
Fortified Coffee Industry Company Market Share
This in-depth report offers a definitive analysis of the global fortified coffee market, a rapidly expanding segment within the broader beverage industry. Leveraging extensive data from 2019-2024 (historical) and projections for 2025-2033 (forecast period), with 2025 as the base and estimated year, this report delves into the intricate market dynamics, identifies key growth drivers, and outlines strategic opportunities for stakeholders. We provide detailed quantitative and qualitative insights, covering market size evolution, adoption rates, technological disruptions, and shifting consumer behaviors. The report is structured to deliver actionable intelligence for industry professionals, manufacturers, investors, and policymakers navigating this dynamic landscape. Key segments analyzed include Product Type (Whole Bean, Ground Coffee, RTD Coffee) and Distribution Channel (Supermarket/Hypermarket, Cafes and Foodservice, Convenience Stores, Online Stores, Other Distribution Channels).
Fortified Coffee Industry Market Dynamics & Structure
The fortified coffee market, while still maturing, exhibits a growing level of concentration driven by strategic investments and market consolidation. Key industry players are actively innovating to capture market share, with technological advancements in ingredient fortification and processing playing a pivotal role. Regulatory frameworks surrounding health claims and functional ingredients are evolving, influencing product development and marketing strategies. The competitive landscape features a mix of established coffee giants and emerging functional beverage brands, with significant pressure from competitive product substitutes like fortified teas and other functional beverages. End-user demographics are expanding beyond traditional coffee drinkers to include health-conscious consumers, millennials, and Gen Z seeking convenient, health-enhancing beverages. Merger and acquisition (M&A) trends are on the rise as larger companies seek to acquire innovative startups and expand their fortified product portfolios. For instance, the volume of M&A deals related to functional beverages has seen a XX% increase year-on-year in the last three years. Barriers to innovation include the cost of research and development for novel fortification technologies and the challenge of consumer education regarding the benefits of fortified coffee.
- Market Concentration: Moderate to High, with key players investing in R&D and market expansion.
- Technological Innovation: Driven by advancements in bioavailability of nutrients, shelf-stability of fortified products, and novel ingredient incorporation (e.g., adaptogens, nootropics).
- Regulatory Frameworks: Evolving regulations on health claims, ingredient sourcing, and labeling are critical considerations.
- Competitive Product Substitutes: Fortified teas, functional water, energy drinks, and other health-focused beverages.
- End-User Demographics: Health-conscious individuals, millennials, Gen Z, and consumers seeking enhanced cognitive function or specific health benefits.
- M&A Trends: Increasing M&A activity as companies seek to expand their functional product offerings and market reach.
Fortified Coffee Industry Growth Trends & Insights
The fortified coffee market is poised for substantial growth, projected to expand at a robust CAGR of XX% from 2025 to 2033. This expansion is fueled by an escalating consumer demand for beverages that offer more than just a caffeine boost. The market size evolution indicates a significant upward trajectory, with the global market valued at an estimated USD XXXX million units in 2025, expected to reach USD XXXX million units by 2033. Adoption rates are steadily increasing as awareness of the health benefits associated with added vitamins, minerals, and functional ingredients grows. Technological disruptions are central to this growth, with innovations in encapsulation techniques improving the stability and efficacy of added nutrients, and novel ingredient blends catering to specific health needs such as enhanced cognitive function, immune support, and stress reduction. Consumer behavior shifts are profoundly impacting the market; individuals are increasingly proactive about their well-being, seeking convenient ways to incorporate health-promoting products into their daily routines. This has led to a surge in the popularity of RTD (Ready-to-Drink) fortified coffees, which offer on-the-go convenience. Market penetration is still in its early stages in many regions, presenting significant untapped potential. The rise of "wellness" culture and the growing acceptance of functional foods and beverages are key drivers underpinning these positive trends. For example, the penetration of fortified coffee in developed markets has reached XX% by 2024, and is projected to grow to XX% by 2033.
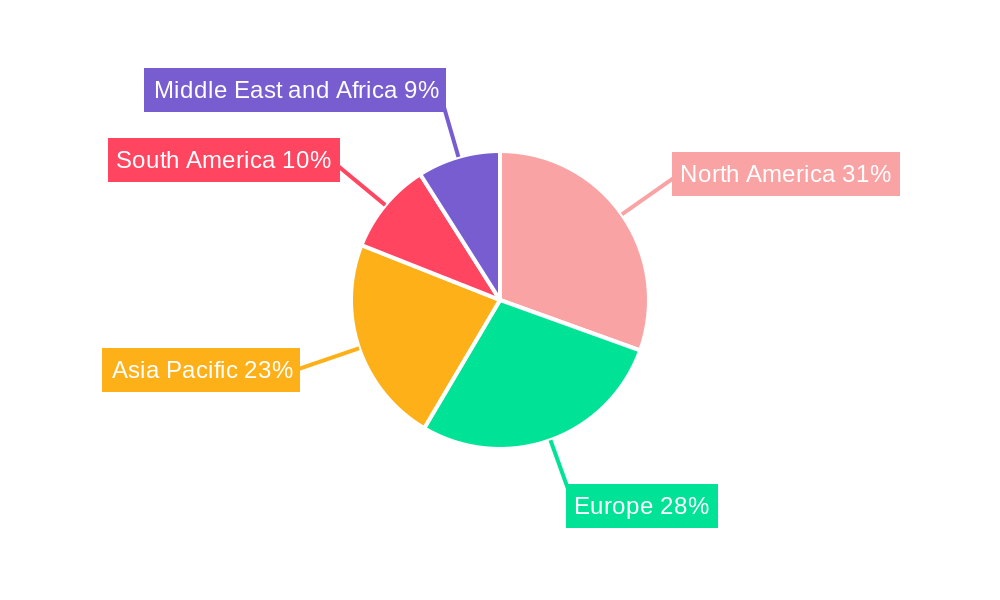
Dominant Regions, Countries, or Segments in Fortified Coffee Industry
North America currently dominates the fortified coffee industry, driven by a highly health-conscious consumer base, strong economic policies supporting innovation, and a well-developed distribution infrastructure. The United States, in particular, is a powerhouse, accounting for an estimated XX% of the global fortified coffee market share in 2025. This dominance is further amplified by the robust presence of key players and a receptive market for functional foods and beverages. Within the Product Type segment, RTD Coffee is experiencing accelerated growth, driven by convenience and the increasing preference for ready-to-consume beverages, projected to capture XX% of the market by 2033. Supermarkets/Hypermarkets remain the leading distribution channel, facilitating widespread product accessibility and accounting for approximately XX% of sales in 2025. However, Online Stores are emerging as a significant growth driver, with an anticipated CAGR of XX% during the forecast period, catering to the evolving purchasing habits of consumers. The foodservice channel, including cafes and specialized coffee shops, is also crucial for introducing premium and niche fortified coffee products. Economic policies in North America, such as tax incentives for health and wellness product development, and robust intellectual property protection for innovative formulations, contribute to the region's leadership. The high disposable income and a strong inclination towards proactive health management further solidify North America's position.
- Dominant Region: North America (especially the USA).
- Key Drivers in North America: High health consciousness, strong disposable income, advanced distribution networks, supportive economic policies.
- Leading Product Type Segment: RTD Coffee.
- Leading Distribution Channel: Supermarket/Hypermarket.
- Fastest Growing Distribution Channel: Online Stores.
- Growth Potential: Significant untapped market potential in emerging economies across Asia-Pacific and Latin America.
Fortified Coffee Industry Product Landscape
The fortified coffee product landscape is characterized by a wave of innovation aimed at enhancing both taste and functionality. Companies are increasingly developing blends that incorporate a diverse range of beneficial ingredients, including vitamins (e.g., Vitamin D), minerals (e.g., Iron), adaptogens (e.g., Ashwagandha), and nootropics (e.g., L-Theanine). Unique selling propositions often revolve around targeted health benefits, such as improved focus, stress reduction, immune support, and enhanced energy levels without the jitters. Technological advancements in ingredient sourcing, formulation, and processing ensure the stability, bioavailability, and palatability of these fortified offerings. The market is witnessing a rise in specialized product lines catering to specific dietary needs, like plant-based fortified coffees and low-sugar options.
Key Drivers, Barriers & Challenges in Fortified Coffee Industry
Key Drivers:
- Rising Health and Wellness Consciousness: Consumers are actively seeking products that contribute to their overall well-being.
- Demand for Convenience: The growing preference for on-the-go, functional beverages aligns perfectly with RTD fortified coffee.
- Technological Advancements: Innovations in ingredient fortification and formulation enhance product efficacy and appeal.
- Product Diversification: A wider range of flavors and functional benefits cater to diverse consumer preferences.
Barriers & Challenges:
- Consumer Education and Awareness: Overcoming skepticism and educating consumers about the benefits of fortified coffee remains a hurdle.
- Regulatory Compliance: Navigating complex and evolving regulations regarding health claims and ingredient approvals can be challenging.
- Cost of Ingredients and Production: Sourcing high-quality functional ingredients and advanced processing can increase production costs.
- Competition from Traditional Coffee and Other Beverages: Established players and a crowded beverage market present significant competitive pressure.
- Supply Chain Volatility: Ensuring a consistent and reliable supply of specialized fortified ingredients can be problematic.
Emerging Opportunities in Fortified Coffee Industry
Untapped markets in developing economies represent a significant opportunity, driven by increasing disposable incomes and a growing awareness of health and wellness trends. Innovative applications are emerging, including fortified coffee for specific athletic performance enhancement and cognitive function support targeted at students and professionals. Evolving consumer preferences for natural, clean-label ingredients and sustainable sourcing present opportunities for brands that can authentically meet these demands. The development of personalized fortified coffee formulations based on individual health needs is another promising frontier.
Growth Accelerators in the Fortified Coffee Industry Industry
Long-term growth will be propelled by continued technological breakthroughs in nutrient delivery systems, ensuring higher bioavailability and efficacy. Strategic partnerships between coffee manufacturers, ingredient suppliers, and health and wellness brands will foster innovation and expand market reach. Aggressive market expansion strategies targeting emerging economies, coupled with targeted marketing campaigns to educate consumers about the unique benefits of fortified coffee, will be crucial growth accelerators. The increasing adoption of e-commerce platforms will also significantly boost accessibility and drive sales.
Key Players Shaping the Fortified Coffee Industry Market
- Nestle SA
- Kruger GmbH & Co KG
- Gloria Jean's Coffees
- Strauss Group Limited
- Dutch Bros Coffee
- Ingenuity Beverages
- Starbucks Corporation
- Eight O' Clock Coffee Company
- Tata Coffee
- Luigi Lavazza SpA
- Bulletproof 360 Inc
Notable Milestones in Fortified Coffee Industry Sector
- August 2022: Herbalife Nutrition launched its first functional coffee mix, High Protein Premix Coffee, in the Malaysian market, designed for consumers seeking to reduce calories, fat, and sugar.
- June 2022: Cecors, Inc. (PsyKey) introduced a premium functional mushroom-infused coffee line in the US Market, formulating four functional mushroom-infused coffees with 100% fairtrade organic Arabic coffee beans.
- June 2021: Laird Superfood announced the expansion of its functional coffee range with the launch of Soothe Coffee, featuring botanicals like marshmallow root, cardamom, and blueberries, alongside other functional blends like Boost coffee, providing 15% of an individual's daily vitamin D.
In-Depth Fortified Coffee Industry Market Outlook
The fortified coffee industry is set for a period of sustained and dynamic growth, fueled by an unprecedented convergence of evolving consumer demands and technological advancements. Future market potential lies in further segmentation and specialization, with opportunities to develop fortified coffee tailored for specific demographics and lifestyle needs, such as enhanced focus for students or recovery support for athletes. Strategic opportunities will arise from innovative ingredient collaborations, novel product formats, and expansion into underserved geographical markets. The report's outlook is highly optimistic, predicting that companies that can effectively communicate the health benefits, ensure product quality and taste, and adapt to the ever-changing consumer landscape will be well-positioned for significant success in this burgeoning market.
Fortified Coffee Industry Segmentation
-
1. Product Type
- 1.1. Whole Bean
- 1.2. Ground Coffee
- 1.3. RTD Coffee
-
2. Distribution Channel
- 2.1. Supermarket/Hypermarket
- 2.2. Cafes and Foodservice
- 2.3. Convenience Stores
- 2.4. Online Stores
- 2.5. Other Distribution Channels
Fortified Coffee Industry Segmentation By Geography
-
1. North America
- 1.1. United States
- 1.2. Canada
- 1.3. Mexico
- 1.4. Rest of North America
-
2. Europe
- 2.1. United Kingdom
- 2.2. Germany
- 2.3. France
- 2.4. Russia
- 2.5. Italy
- 2.6. Spain
- 2.7. Rest of Europe
-
3. Asia Pacific
- 3.1. India
- 3.2. China
- 3.3. Japan
- 3.4. Australia
- 3.5. Rest of Asia Pacific
-
4. South America
- 4.1. Brazil
- 4.2. Argentina
- 4.3. Rest of South America
-
5. Middle East and Africa
- 5.1. South Africa
- 5.2. Saudi Arabia
- 5.3. Rest of Middle East and Africa
Fortified Coffee Industry Regional Market Share
Geographic Coverage of Fortified Coffee Industry
Fortified Coffee Industry REPORT HIGHLIGHTS
| Aspects | Details |
|---|---|
| Study Period | 2020-2034 |
| Base Year | 2025 |
| Estimated Year | 2026 |
| Forecast Period | 2026-2034 |
| Historical Period | 2020-2025 |
| Growth Rate | CAGR of 2.03% from 2020-2034 |
| Segmentation |
|
Table of Contents
- 1. Introduction
- 1.1. Research Scope
- 1.2. Market Segmentation
- 1.3. Research Objective
- 1.4. Definitions and Assumptions
- 2. Executive Summary
- 2.1. Market Snapshot
- 3. Market Dynamics
- 3.1. Market Drivers
- 3.2. Market Restrains
- 3.3. Market Trends
- 3.4. Market Opportunities
- 4. Market Factor Analysis
- 4.1. Porters Five Forces
- 4.1.1. Bargaining Power of Suppliers
- 4.1.2. Bargaining Power of Buyers
- 4.1.3. Threat of New Entrants
- 4.1.4. Threat of Substitutes
- 4.1.5. Competitive Rivalry
- 4.2. PESTEL analysis
- 4.3. BCG Analysis
- 4.3.1. Stars (High Growth, High Market Share)
- 4.3.2. Cash Cows (Low Growth, High Market Share)
- 4.3.3. Question Mark (High Growth, Low Market Share)
- 4.3.4. Dogs (Low Growth, Low Market Share)
- 4.4. Ansoff Matrix Analysis
- 4.5. Supply Chain Analysis
- 4.6. Regulatory Landscape
- 4.7. Current Market Potential and Opportunity Assessment (TAM–SAM–SOM Framework)
- 4.8. VDR Analyst Note
- 4.1. Porters Five Forces
- 5. Market Analysis, Insights and Forecast 2021-2033
- 5.1. Market Analysis, Insights and Forecast - by Product Type
- 5.1.1. Whole Bean
- 5.1.2. Ground Coffee
- 5.1.3. RTD Coffee
- 5.2. Market Analysis, Insights and Forecast - by Distribution Channel
- 5.2.1. Supermarket/Hypermarket
- 5.2.2. Cafes and Foodservice
- 5.2.3. Convenience Stores
- 5.2.4. Online Stores
- 5.2.5. Other Distribution Channels
- 5.3. Market Analysis, Insights and Forecast - by Region
- 5.3.1. North America
- 5.3.2. Europe
- 5.3.3. Asia Pacific
- 5.3.4. South America
- 5.3.5. Middle East and Africa
- 5.1. Market Analysis, Insights and Forecast - by Product Type
- 6. Global Fortified Coffee Industry Analysis, Insights and Forecast, 2021-2033
- 6.1. Market Analysis, Insights and Forecast - by Product Type
- 6.1.1. Whole Bean
- 6.1.2. Ground Coffee
- 6.1.3. RTD Coffee
- 6.2. Market Analysis, Insights and Forecast - by Distribution Channel
- 6.2.1. Supermarket/Hypermarket
- 6.2.2. Cafes and Foodservice
- 6.2.3. Convenience Stores
- 6.2.4. Online Stores
- 6.2.5. Other Distribution Channels
- 6.1. Market Analysis, Insights and Forecast - by Product Type
- 7. North America Fortified Coffee Industry Analysis, Insights and Forecast, 2021-2033
- 7.1. Market Analysis, Insights and Forecast - by Product Type
- 7.1.1. Whole Bean
- 7.1.2. Ground Coffee
- 7.1.3. RTD Coffee
- 7.2. Market Analysis, Insights and Forecast - by Distribution Channel
- 7.2.1. Supermarket/Hypermarket
- 7.2.2. Cafes and Foodservice
- 7.2.3. Convenience Stores
- 7.2.4. Online Stores
- 7.2.5. Other Distribution Channels
- 7.1. Market Analysis, Insights and Forecast - by Product Type
- 8. Europe Fortified Coffee Industry Analysis, Insights and Forecast, 2021-2033
- 8.1. Market Analysis, Insights and Forecast - by Product Type
- 8.1.1. Whole Bean
- 8.1.2. Ground Coffee
- 8.1.3. RTD Coffee
- 8.2. Market Analysis, Insights and Forecast - by Distribution Channel
- 8.2.1. Supermarket/Hypermarket
- 8.2.2. Cafes and Foodservice
- 8.2.3. Convenience Stores
- 8.2.4. Online Stores
- 8.2.5. Other Distribution Channels
- 8.1. Market Analysis, Insights and Forecast - by Product Type
- 9. Asia Pacific Fortified Coffee Industry Analysis, Insights and Forecast, 2021-2033
- 9.1. Market Analysis, Insights and Forecast - by Product Type
- 9.1.1. Whole Bean
- 9.1.2. Ground Coffee
- 9.1.3. RTD Coffee
- 9.2. Market Analysis, Insights and Forecast - by Distribution Channel
- 9.2.1. Supermarket/Hypermarket
- 9.2.2. Cafes and Foodservice
- 9.2.3. Convenience Stores
- 9.2.4. Online Stores
- 9.2.5. Other Distribution Channels
- 9.1. Market Analysis, Insights and Forecast - by Product Type
- 10. South America Fortified Coffee Industry Analysis, Insights and Forecast, 2021-2033
- 10.1. Market Analysis, Insights and Forecast - by Product Type
- 10.1.1. Whole Bean
- 10.1.2. Ground Coffee
- 10.1.3. RTD Coffee
- 10.2. Market Analysis, Insights and Forecast - by Distribution Channel
- 10.2.1. Supermarket/Hypermarket
- 10.2.2. Cafes and Foodservice
- 10.2.3. Convenience Stores
- 10.2.4. Online Stores
- 10.2.5. Other Distribution Channels
- 10.1. Market Analysis, Insights and Forecast - by Product Type
- 11. Middle East and Africa Fortified Coffee Industry Analysis, Insights and Forecast, 2021-2033
- 11.1. Market Analysis, Insights and Forecast - by Product Type
- 11.1.1. Whole Bean
- 11.1.2. Ground Coffee
- 11.1.3. RTD Coffee
- 11.2. Market Analysis, Insights and Forecast - by Distribution Channel
- 11.2.1. Supermarket/Hypermarket
- 11.2.2. Cafes and Foodservice
- 11.2.3. Convenience Stores
- 11.2.4. Online Stores
- 11.2.5. Other Distribution Channels
- 11.1. Market Analysis, Insights and Forecast - by Product Type
- 12. Competitive Analysis
- 12.1. Company Profiles
- 12.1.1 Nestle SA
- 12.1.1.1. Company Overview
- 12.1.1.2. Products
- 12.1.1.3. Company Financials
- 12.1.1.4. SWOT Analysis
- 12.1.2 Kruger GmbH & Co KG*List Not Exhaustive
- 12.1.2.1. Company Overview
- 12.1.2.2. Products
- 12.1.2.3. Company Financials
- 12.1.2.4. SWOT Analysis
- 12.1.3 Gloria Jean's Coffees
- 12.1.3.1. Company Overview
- 12.1.3.2. Products
- 12.1.3.3. Company Financials
- 12.1.3.4. SWOT Analysis
- 12.1.4 Strauss Group Limited
- 12.1.4.1. Company Overview
- 12.1.4.2. Products
- 12.1.4.3. Company Financials
- 12.1.4.4. SWOT Analysis
- 12.1.5 Dutch Bros Coffee
- 12.1.5.1. Company Overview
- 12.1.5.2. Products
- 12.1.5.3. Company Financials
- 12.1.5.4. SWOT Analysis
- 12.1.6 Ingenuity Beverages
- 12.1.6.1. Company Overview
- 12.1.6.2. Products
- 12.1.6.3. Company Financials
- 12.1.6.4. SWOT Analysis
- 12.1.7 Starbucks Corporation
- 12.1.7.1. Company Overview
- 12.1.7.2. Products
- 12.1.7.3. Company Financials
- 12.1.7.4. SWOT Analysis
- 12.1.8 Eight O' Clock Coffee Company
- 12.1.8.1. Company Overview
- 12.1.8.2. Products
- 12.1.8.3. Company Financials
- 12.1.8.4. SWOT Analysis
- 12.1.9 Tata Coffee
- 12.1.9.1. Company Overview
- 12.1.9.2. Products
- 12.1.9.3. Company Financials
- 12.1.9.4. SWOT Analysis
- 12.1.10 Luigi Lavazza SpA
- 12.1.10.1. Company Overview
- 12.1.10.2. Products
- 12.1.10.3. Company Financials
- 12.1.10.4. SWOT Analysis
- 12.1.11 Bulletproof 360 Inc
- 12.1.11.1. Company Overview
- 12.1.11.2. Products
- 12.1.11.3. Company Financials
- 12.1.11.4. SWOT Analysis
- 12.1.1 Nestle SA
- 12.2. Market Entropy
- 12.2.1 Company's Key Areas Served
- 12.2.2 Recent Developments
- 12.3. Company Market Share Analysis 2025
- 12.3.1 Top 5 Companies Market Share Analysis
- 12.3.2 Top 3 Companies Market Share Analysis
- 12.4. List of Potential Customers
- 13. Research Methodology
List of Figures
- Figure 1: Global Fortified Coffee Industry Revenue Breakdown (Million, %) by Region 2025 & 2033
- Figure 2: North America Fortified Coffee Industry Revenue (Million), by Product Type 2025 & 2033
- Figure 3: North America Fortified Coffee Industry Revenue Share (%), by Product Type 2025 & 2033
- Figure 4: North America Fortified Coffee Industry Revenue (Million), by Distribution Channel 2025 & 2033
- Figure 5: North America Fortified Coffee Industry Revenue Share (%), by Distribution Channel 2025 & 2033
- Figure 6: North America Fortified Coffee Industry Revenue (Million), by Country 2025 & 2033
- Figure 7: North America Fortified Coffee Industry Revenue Share (%), by Country 2025 & 2033
- Figure 8: Europe Fortified Coffee Industry Revenue (Million), by Product Type 2025 & 2033
- Figure 9: Europe Fortified Coffee Industry Revenue Share (%), by Product Type 2025 & 2033
- Figure 10: Europe Fortified Coffee Industry Revenue (Million), by Distribution Channel 2025 & 2033
- Figure 11: Europe Fortified Coffee Industry Revenue Share (%), by Distribution Channel 2025 & 2033
- Figure 12: Europe Fortified Coffee Industry Revenue (Million), by Country 2025 & 2033
- Figure 13: Europe Fortified Coffee Industry Revenue Share (%), by Country 2025 & 2033
- Figure 14: Asia Pacific Fortified Coffee Industry Revenue (Million), by Product Type 2025 & 2033
- Figure 15: Asia Pacific Fortified Coffee Industry Revenue Share (%), by Product Type 2025 & 2033
- Figure 16: Asia Pacific Fortified Coffee Industry Revenue (Million), by Distribution Channel 2025 & 2033
- Figure 17: Asia Pacific Fortified Coffee Industry Revenue Share (%), by Distribution Channel 2025 & 2033
- Figure 18: Asia Pacific Fortified Coffee Industry Revenue (Million), by Country 2025 & 2033
- Figure 19: Asia Pacific Fortified Coffee Industry Revenue Share (%), by Country 2025 & 2033
- Figure 20: South America Fortified Coffee Industry Revenue (Million), by Product Type 2025 & 2033
- Figure 21: South America Fortified Coffee Industry Revenue Share (%), by Product Type 2025 & 2033
- Figure 22: South America Fortified Coffee Industry Revenue (Million), by Distribution Channel 2025 & 2033
- Figure 23: South America Fortified Coffee Industry Revenue Share (%), by Distribution Channel 2025 & 2033
- Figure 24: South America Fortified Coffee Industry Revenue (Million), by Country 2025 & 2033
- Figure 25: South America Fortified Coffee Industry Revenue Share (%), by Country 2025 & 2033
- Figure 26: Middle East and Africa Fortified Coffee Industry Revenue (Million), by Product Type 2025 & 2033
- Figure 27: Middle East and Africa Fortified Coffee Industry Revenue Share (%), by Product Type 2025 & 2033
- Figure 28: Middle East and Africa Fortified Coffee Industry Revenue (Million), by Distribution Channel 2025 & 2033
- Figure 29: Middle East and Africa Fortified Coffee Industry Revenue Share (%), by Distribution Channel 2025 & 2033
- Figure 30: Middle East and Africa Fortified Coffee Industry Revenue (Million), by Country 2025 & 2033
- Figure 31: Middle East and Africa Fortified Coffee Industry Revenue Share (%), by Country 2025 & 2033
List of Tables
- Table 1: Global Fortified Coffee Industry Revenue Million Forecast, by Product Type 2020 & 2033
- Table 2: Global Fortified Coffee Industry Revenue Million Forecast, by Distribution Channel 2020 & 2033
- Table 3: Global Fortified Coffee Industry Revenue Million Forecast, by Region 2020 & 2033
- Table 4: Global Fortified Coffee Industry Revenue Million Forecast, by Product Type 2020 & 2033
- Table 5: Global Fortified Coffee Industry Revenue Million Forecast, by Distribution Channel 2020 & 2033
- Table 6: Global Fortified Coffee Industry Revenue Million Forecast, by Country 2020 & 2033
- Table 7: United States Fortified Coffee Industry Revenue (Million) Forecast, by Application 2020 & 2033
- Table 8: Canada Fortified Coffee Industry Revenue (Million) Forecast, by Application 2020 & 2033
- Table 9: Mexico Fortified Coffee Industry Revenue (Million) Forecast, by Application 2020 & 2033
- Table 10: Rest of North America Fortified Coffee Industry Revenue (Million) Forecast, by Application 2020 & 2033
- Table 11: Global Fortified Coffee Industry Revenue Million Forecast, by Product Type 2020 & 2033
- Table 12: Global Fortified Coffee Industry Revenue Million Forecast, by Distribution Channel 2020 & 2033
- Table 13: Global Fortified Coffee Industry Revenue Million Forecast, by Country 2020 & 2033
- Table 14: United Kingdom Fortified Coffee Industry Revenue (Million) Forecast, by Application 2020 & 2033
- Table 15: Germany Fortified Coffee Industry Revenue (Million) Forecast, by Application 2020 & 2033
- Table 16: France Fortified Coffee Industry Revenue (Million) Forecast, by Application 2020 & 2033
- Table 17: Russia Fortified Coffee Industry Revenue (Million) Forecast, by Application 2020 & 2033
- Table 18: Italy Fortified Coffee Industry Revenue (Million) Forecast, by Application 2020 & 2033
- Table 19: Spain Fortified Coffee Industry Revenue (Million) Forecast, by Application 2020 & 2033
- Table 20: Rest of Europe Fortified Coffee Industry Revenue (Million) Forecast, by Application 2020 & 2033
- Table 21: Global Fortified Coffee Industry Revenue Million Forecast, by Product Type 2020 & 2033
- Table 22: Global Fortified Coffee Industry Revenue Million Forecast, by Distribution Channel 2020 & 2033
- Table 23: Global Fortified Coffee Industry Revenue Million Forecast, by Country 2020 & 2033
- Table 24: India Fortified Coffee Industry Revenue (Million) Forecast, by Application 2020 & 2033
- Table 25: China Fortified Coffee Industry Revenue (Million) Forecast, by Application 2020 & 2033
- Table 26: Japan Fortified Coffee Industry Revenue (Million) Forecast, by Application 2020 & 2033
- Table 27: Australia Fortified Coffee Industry Revenue (Million) Forecast, by Application 2020 & 2033
- Table 28: Rest of Asia Pacific Fortified Coffee Industry Revenue (Million) Forecast, by Application 2020 & 2033
- Table 29: Global Fortified Coffee Industry Revenue Million Forecast, by Product Type 2020 & 2033
- Table 30: Global Fortified Coffee Industry Revenue Million Forecast, by Distribution Channel 2020 & 2033
- Table 31: Global Fortified Coffee Industry Revenue Million Forecast, by Country 2020 & 2033
- Table 32: Brazil Fortified Coffee Industry Revenue (Million) Forecast, by Application 2020 & 2033
- Table 33: Argentina Fortified Coffee Industry Revenue (Million) Forecast, by Application 2020 & 2033
- Table 34: Rest of South America Fortified Coffee Industry Revenue (Million) Forecast, by Application 2020 & 2033
- Table 35: Global Fortified Coffee Industry Revenue Million Forecast, by Product Type 2020 & 2033
- Table 36: Global Fortified Coffee Industry Revenue Million Forecast, by Distribution Channel 2020 & 2033
- Table 37: Global Fortified Coffee Industry Revenue Million Forecast, by Country 2020 & 2033
- Table 38: South Africa Fortified Coffee Industry Revenue (Million) Forecast, by Application 2020 & 2033
- Table 39: Saudi Arabia Fortified Coffee Industry Revenue (Million) Forecast, by Application 2020 & 2033
- Table 40: Rest of Middle East and Africa Fortified Coffee Industry Revenue (Million) Forecast, by Application 2020 & 2033
Frequently Asked Questions
1. What is the projected Compound Annual Growth Rate (CAGR) of the Fortified Coffee Industry?
The projected CAGR is approximately 2.03%.
2. Which companies are prominent players in the Fortified Coffee Industry?
Key companies in the market include Nestle SA, Kruger GmbH & Co KG*List Not Exhaustive, Gloria Jean's Coffees, Strauss Group Limited, Dutch Bros Coffee, Ingenuity Beverages, Starbucks Corporation, Eight O' Clock Coffee Company, Tata Coffee, Luigi Lavazza SpA, Bulletproof 360 Inc.
3. What are the main segments of the Fortified Coffee Industry?
The market segments include Product Type, Distribution Channel.
4. Can you provide details about the market size?
The market size is estimated to be USD 4.03 Million as of 2022.
5. What are some drivers contributing to market growth?
Escalating Concern for Quality Drinking Water; Strategic Investment by the Key Players.
6. What are the notable trends driving market growth?
Growing Demand for Healthy Hydration.
7. Are there any restraints impacting market growth?
Need for Stringent Regulatory Landscape.
8. Can you provide examples of recent developments in the market?
August 2022: Herbalife Nutrition launched its first functional coffee mix, High Protein Premix Coffee, in the Malaysian market. According to the company statement, the high-protein premix coffee was designed for consumers who want to reduce calories, fat, and sugar.
9. What pricing options are available for accessing the report?
Pricing options include single-user, multi-user, and enterprise licenses priced at USD 4750, USD 5250, and USD 8750 respectively.
10. Is the market size provided in terms of value or volume?
The market size is provided in terms of value, measured in Million.
11. Are there any specific market keywords associated with the report?
Yes, the market keyword associated with the report is "Fortified Coffee Industry," which aids in identifying and referencing the specific market segment covered.
12. How do I determine which pricing option suits my needs best?
The pricing options vary based on user requirements and access needs. Individual users may opt for single-user licenses, while businesses requiring broader access may choose multi-user or enterprise licenses for cost-effective access to the report.
13. Are there any additional resources or data provided in the Fortified Coffee Industry report?
While the report offers comprehensive insights, it's advisable to review the specific contents or supplementary materials provided to ascertain if additional resources or data are available.
14. How can I stay updated on further developments or reports in the Fortified Coffee Industry?
To stay informed about further developments, trends, and reports in the Fortified Coffee Industry, consider subscribing to industry newsletters, following relevant companies and organizations, or regularly checking reputable industry news sources and publications.
Methodology
Step 1 - Identification of Relevant Samples Size from Population Database


Step 2 - Approaches for Defining Global Market Size (Value, Volume* & Price*)

Note*: In applicable scenarios
Step 3 - Data Sources
Primary Research
- Web Analytics
- Survey Reports
- Research Institute
- Latest Research Reports
- Opinion Leaders
Secondary Research
- Annual Reports
- White Paper
- Latest Press Release
- Industry Association
- Paid Database
- Investor Presentations

Step 4 - Data Triangulation
Involves using different sources of information in order to increase the validity of a study
These sources are likely to be stakeholders in a program - participants, other researchers, program staff, other community members, and so on.
Then we put all data in single framework & apply various statistical tools to find out the dynamic on the market.
During the analysis stage, feedback from the stakeholder groups would be compared to determine areas of agreement as well as areas of divergence