
Key Insights
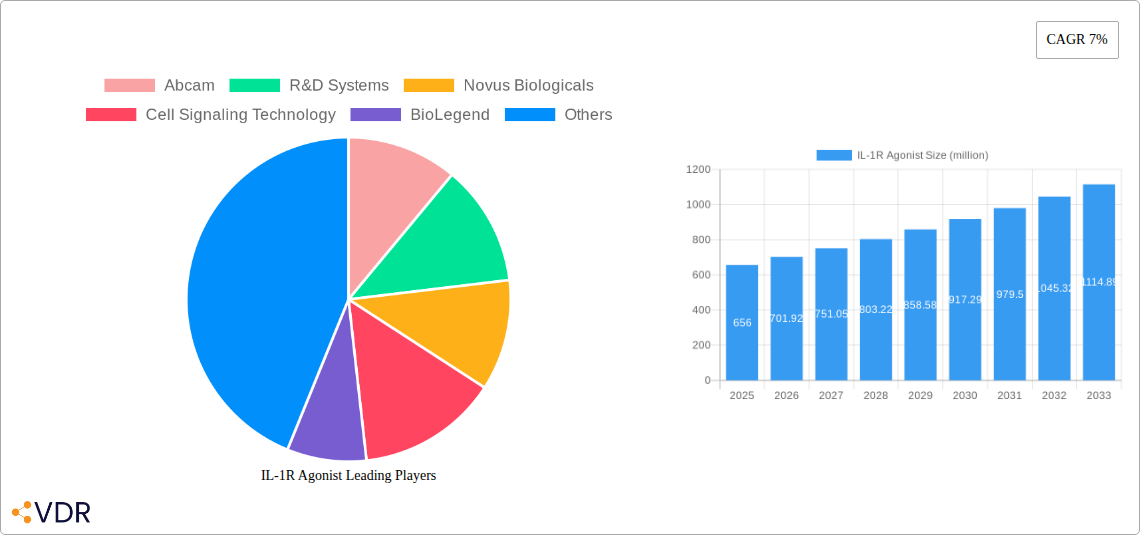
The global Interleukin-1 Receptor (IL-1R) Agonist market is poised for substantial growth, with an estimated market size of $656 million in 2025 and a projected Compound Annual Growth Rate (CAGR) of 7% over the forecast period of 2025-2033. This robust expansion is primarily driven by the escalating prevalence of inflammatory diseases, an increasing focus on immunology research, and significant advancements in cancer therapies that leverage IL-1R signaling pathways. The Biomedical Industry is a key consumer, utilizing these agonists in drug development and diagnostic tools. Within research applications, Immunology and Cancer Research represent the dominant segments, reflecting the critical role of IL-1 in modulating immune responses and tumor progression. Naturally extracted IL-1R agonists are anticipated to maintain a significant share due to their well-established therapeutic profiles, while synthetic agonists are expected to witness accelerated growth owing to their enhanced specificity, scalability, and potential for novel drug design.
The market's growth trajectory is further bolstered by emerging trends such as the development of highly targeted IL-1R therapies for autoimmune disorders and chronic inflammatory conditions, alongside their increasing application in personalized medicine. However, certain restraints, including the high cost of research and development for novel agonists and stringent regulatory hurdles for new drug approvals, could temper the market's pace. Geographically, North America and Europe are expected to lead the market, driven by advanced healthcare infrastructure, substantial R&D investments, and a high incidence of inflammatory diseases. The Asia Pacific region is anticipated to exhibit the fastest growth, fueled by a growing healthcare expenditure, increasing R&D activities, and a large patient pool. Key players like Abcam, R&D Systems, Novus Biologicals, Cell Signaling Technology, BioLegend, Merck, Thermo Fisher Scientific, Cayman Chemical, PeproTech, and BGI Genomics are actively involved in innovation and strategic collaborations to capitalize on these market dynamics.
This in-depth report provides an exhaustive analysis of the global IL-1R Agonist market, offering critical insights into its present landscape and future trajectory. Covering the period from 2019 to 2033, with a base year of 2025 and a detailed forecast period of 2025–2033, this study is indispensable for stakeholders seeking to understand market dynamics, growth drivers, and competitive strategies within the biomedical, immunology, and cancer research sectors. We meticulously dissect market concentration, technological advancements, regulatory influences, product substitutes, end-user demographics, and M&A activities. The report further explores evolving market sizes, adoption rates, disruptive technologies, and shifts in consumer behavior, all underpinned by robust quantitative data and qualitative analysis.
IL-1R Agonist Market Dynamics & Structure
The IL-1R agonist market exhibits a moderate to high concentration, with key players like Thermo Fisher Scientific, Merck, and Abcam holding significant shares. Technological innovation is a primary driver, fueled by advancements in recombinant protein production, antibody engineering, and high-throughput screening technologies, enabling the development of more potent and specific IL-1R agonists. Regulatory frameworks, while evolving, generally support research and therapeutic development, although stringent approval processes for potential therapeutics can present barriers. Competitive product substitutes include other cytokine modulators and small molecule inhibitors targeting the IL-1 pathway, with their effectiveness and specificity often dictating market share. End-user demographics are predominantly research institutions, pharmaceutical companies, and contract research organizations (CROs) focused on inflammatory diseases, autoimmune disorders, and oncology. Mergers and acquisitions (M&A) activity is a notable trend, with larger entities acquiring smaller biotechs with promising pipelines to consolidate market position and accelerate drug development.
- Market Concentration: Dominated by a few key players, but with emerging opportunities for smaller, specialized firms.
- Technological Innovation Drivers: Advancements in biologics manufacturing, gene editing, and assay development.
- Regulatory Frameworks: Evolving but generally supportive for research; rigorous for therapeutic applications.
- Competitive Product Substitutes: Alternative immunomodulatory agents and targeted therapies.
- End-User Demographics: Academic research labs, pharmaceutical R&D, and biopharmaceutical companies.
- M&A Trends: Strategic acquisitions to gain access to novel compounds and expand product portfolios.
IL-1R Agonist Growth Trends & Insights
The IL-1R agonist market is poised for substantial growth, projected to expand at a Compound Annual Growth Rate (CAGR) of approximately 7.5% during the forecast period. This expansion is largely driven by the escalating prevalence of inflammatory and autoimmune diseases globally, including rheumatoid arthritis, inflammatory bowel disease, and psoriasis, where IL-1 signaling plays a critical pathogenic role. Research into the IL-1 pathway's involvement in cancer progression and response to immunotherapy is also significantly contributing to market demand, particularly within the oncology research segment.
Naturally extracted IL-1R agonists, while historically important, are seeing their market share gradually cede to synthetic counterparts. Synthetic agonists offer greater control over purity, consistency, and scalability, which are crucial for both research reproducibility and potential therapeutic development. The estimated market size for IL-1R agonists is projected to reach approximately $1,500 million units by 2033, up from an estimated $750 million units in 2025.
Technological disruptions are a constant feature. The development of novel delivery systems and targeted delivery mechanisms for IL-1R agonists is enhancing their efficacy and reducing off-target effects. Furthermore, advances in omics technologies, such as transcriptomics and proteomics, are enabling researchers to better understand the intricate role of IL-1 signaling in various disease states, thereby fueling the demand for highly specific IL-1R agonists for research purposes.
Consumer behavior shifts are evident in the increasing demand for customized and highly characterized reagents. Researchers are seeking agonists with defined activity profiles, low batch-to-batch variability, and comprehensive validation data. This has led to companies investing heavily in quality control and characterization technologies. The expanding role of personalized medicine is also influencing the market, as scientists investigate IL-1R agonists' potential in combination therapies tailored to individual patient profiles. The increasing availability of IL-1R agonist research tools and potential therapeutic candidates through collaborations between academic institutions and pharmaceutical giants is also accelerating market penetration.

Dominant Regions, Countries, or Segments in IL-1R Agonist
North America currently dominates the IL-1R agonist market, driven by its robust biomedical research infrastructure, significant investment in pharmaceutical R&D, and a high prevalence of inflammatory and autoimmune diseases. The United States, in particular, accounts for a substantial portion of the global market share, propelled by leading academic institutions, numerous biotechnology companies, and substantial government funding for scientific research through agencies like the National Institutes of Health (NIH). The presence of major biopharmaceutical companies actively engaged in drug discovery and development targeting the IL-1 pathway further solidifies North America's leading position.
Within the application segments, the Immunology Research segment commands the largest market share. This dominance is attributed to the fundamental role of IL-1 cytokines in orchestrating immune responses, making IL-1R agonists indispensable tools for unraveling complex immunological mechanisms. Researchers utilize these agonists to study inflammatory pathways, immune cell activation, and the development of autoimmune and infectious diseases. The Biomedical Industry as a broader segment also shows significant growth, encompassing drug discovery, preclinical studies, and the development of diagnostic tools.
The Cancer Research segment, while historically smaller than immunology research, is experiencing rapid expansion. The growing understanding of IL-1's pro-tumorigenic and immunosuppressive roles in the tumor microenvironment, as well as its influence on the efficacy of cancer immunotherapies, is driving increased demand for IL-1R agonists. This segment is expected to witness the highest CAGR over the forecast period.
Regarding product types, the Synthetic segment is the primary growth driver and holds the largest market share. Synthetic IL-1R agonists offer superior control over purity, consistency, and scalability compared to naturally extracted variants. This precision is critical for reproducible research outcomes and the development of standardized therapeutic agents. Companies are increasingly focusing on developing highly specific and potent synthetic agonists with well-defined pharmacological profiles. While Naturally Extracted IL-1R agonists still find niche applications, their market share is gradually declining due to the inherent variability and potential for impurities associated with natural sources.
IL-1R Agonist Product Landscape
The IL-1R agonist product landscape is characterized by a dynamic array of recombinant proteins, synthetic small molecules, and antibody-based agonists. Leading companies like R&D Systems and PeproTech offer a wide range of highly purified recombinant human and murine IL-1 receptor agonists (e.g., IL-1 alpha, IL-1 beta) crucial for in vitro and in vivo studies. These products are distinguished by their high biological activity and validated performance in various immunological assays. Cayman Chemical and Cell Signaling Technology are prominent for their provision of both agonists and antagonist antibodies, enabling comprehensive pathway analysis. The ongoing development focuses on enhancing specificity, reducing off-target effects, and improving pharmacokinetic profiles for potential therapeutic applications.
Key Drivers, Barriers & Challenges in IL-1R Agonist
Key Drivers:
- Growing Burden of Inflammatory and Autoimmune Diseases: The increasing incidence of conditions like rheumatoid arthritis, Crohn's disease, and psoriasis directly fuels demand for research tools and potential therapeutics targeting the IL-1 pathway.
- Advancements in Cancer Immunotherapy: The role of IL-1 in modulating the tumor microenvironment and influencing treatment response is a significant driver for IL-1R agonist research in oncology.
- Technological Innovations in Biologics and Drug Discovery: Improved recombinant protein production, high-throughput screening, and targeted delivery systems enhance the development and utility of IL-1R agonists.
- Robust Funding for Biomedical Research: Government and private sector investments in immunology and cancer research create sustained demand for research reagents.
Barriers & Challenges:
- Complexity of the IL-1 Signaling Pathway: The intricate network of interactions involving IL-1 receptors and downstream signaling molecules can make it challenging to develop highly specific agonists with predictable outcomes.
- Regulatory Hurdles for Therapeutic Development: The stringent approval processes for novel drugs, particularly biologics, pose significant financial and time-related challenges.
- High Cost of Production and Purification: Manufacturing highly pure and biologically active IL-1R agonists, especially recombinant proteins, can be resource-intensive.
- Potential for Off-Target Effects and Immunogenicity: Developing agonists that specifically target the desired receptor without eliciting unwanted immune responses or affecting other cellular functions remains a persistent challenge.
- Competition from Alternative Therapies: The availability of other immunomodulatory drugs and targeted therapies for inflammatory and autoimmune diseases creates competitive pressure.
Emerging Opportunities in IL-1R Agonist
Emerging opportunities lie in the development of novel IL-1R agonist conjugates for targeted drug delivery, potentially enhancing efficacy and reducing systemic toxicity in cancer therapy and autoimmune disease management. The exploration of IL-1's role in neuroinflammation and neurodegenerative diseases presents a nascent but promising avenue for IL-1R agonist research. Furthermore, the growing interest in personalized medicine is creating opportunities for diagnostic tools and companion diagnostics that can predict patient response to IL-1-targeted therapies, thereby guiding the development and application of specific IL-1R agonists.
Growth Accelerators in the IL-1R Agonist Industry
Growth accelerators for the IL-1R agonist industry include the increasing number of clinical trials investigating IL-1-targeted therapies for various inflammatory conditions and cancers, which will necessitate greater quantities of research-grade agonists. Strategic partnerships and collaborations between academic research institutions and pharmaceutical companies are accelerating the translation of basic research findings into potential therapeutic candidates. Moreover, the expanding adoption of high-content screening platforms and AI-driven drug discovery tools are speeding up the identification and optimization of novel IL-1R agonists, thereby driving market expansion.
Key Players Shaping the IL-1R Agonist Market
- Abcam
- R&D Systems
- Novus Biologicals
- Cell Signaling Technology
- BioLegend
- Merck
- Thermo Fisher Scientific
- Cayman Chemical
- PeproTech
- BGI Genomics
Notable Milestones in IL-1R Agonist Sector
- 2019: Increased publication of research detailing IL-1's role in tumor immune evasion, boosting oncology research demand.
- 2020: Launch of new, highly specific IL-1 beta agonists by several key suppliers, enhancing research precision.
- 2021: Significant growth in M&A activity, with larger biopharma companies acquiring smaller biotechs with IL-1 pathway inhibitors.
- 2022: Advancements in recombinant protein expression technologies leading to more cost-effective production of IL-1 receptor agonists.
- 2023: Growing interest in IL-1 receptor antagonist antibodies as complementary research tools alongside agonists.
- 2024: Introduction of novel assay kits for high-throughput screening of IL-1R agonist activity.
In-Depth IL-1R Agonist Market Outlook
The future market outlook for IL-1R agonists is exceptionally bright, propelled by the relentless pursuit of innovative treatments for debilitating diseases. Growth accelerators will continue to be driven by breakthroughs in understanding IL-1's complex roles in immunity and disease, leading to the development of more targeted and effective therapeutic interventions. Strategic alliances between industry leaders and emerging biotechs will foster the rapid advancement of promising drug candidates through the development pipeline. The increasing sophistication of research technologies, coupled with a growing global health burden of inflammatory and oncological conditions, ensures sustained demand for high-quality IL-1R agonists, positioning the market for significant expansion and impact.
IL-1R Agonist Segmentation
-
1. Application
- 1.1. Biomedical Industry
- 1.2. Immunology Research
- 1.3. Cancer Research
-
2. Types
- 2.1. Naturally Extracted
- 2.2. Synthetic
IL-1R Agonist Segmentation By Geography
-
1. North America
- 1.1. United States
- 1.2. Canada
- 1.3. Mexico
-
2. South America
- 2.1. Brazil
- 2.2. Argentina
- 2.3. Rest of South America
-
3. Europe
- 3.1. United Kingdom
- 3.2. Germany
- 3.3. France
- 3.4. Italy
- 3.5. Spain
- 3.6. Russia
- 3.7. Benelux
- 3.8. Nordics
- 3.9. Rest of Europe
-
4. Middle East & Africa
- 4.1. Turkey
- 4.2. Israel
- 4.3. GCC
- 4.4. North Africa
- 4.5. South Africa
- 4.6. Rest of Middle East & Africa
-
5. Asia Pacific
- 5.1. China
- 5.2. India
- 5.3. Japan
- 5.4. South Korea
- 5.5. ASEAN
- 5.6. Oceania
- 5.7. Rest of Asia Pacific

IL-1R Agonist REPORT HIGHLIGHTS
| Aspects | Details |
|---|---|
| Study Period | 2019-2033 |
| Base Year | 2024 |
| Estimated Year | 2025 |
| Forecast Period | 2025-2033 |
| Historical Period | 2019-2024 |
| Growth Rate | CAGR of 7% from 2019-2033 |
| Segmentation |
|
Table of Contents
- 1. Introduction
- 1.1. Research Scope
- 1.2. Market Segmentation
- 1.3. Research Methodology
- 1.4. Definitions and Assumptions
- 2. Executive Summary
- 2.1. Introduction
- 3. Market Dynamics
- 3.1. Introduction
- 3.2. Market Drivers
- 3.3. Market Restrains
- 3.4. Market Trends
- 4. Market Factor Analysis
- 4.1. Porters Five Forces
- 4.2. Supply/Value Chain
- 4.3. PESTEL analysis
- 4.4. Market Entropy
- 4.5. Patent/Trademark Analysis
- 5. Global IL-1R Agonist Analysis, Insights and Forecast, 2019-2031
- 5.1. Market Analysis, Insights and Forecast - by Application
- 5.1.1. Biomedical Industry
- 5.1.2. Immunology Research
- 5.1.3. Cancer Research
- 5.2. Market Analysis, Insights and Forecast - by Types
- 5.2.1. Naturally Extracted
- 5.2.2. Synthetic
- 5.3. Market Analysis, Insights and Forecast - by Region
- 5.3.1. North America
- 5.3.2. South America
- 5.3.3. Europe
- 5.3.4. Middle East & Africa
- 5.3.5. Asia Pacific
- 5.1. Market Analysis, Insights and Forecast - by Application
- 6. North America IL-1R Agonist Analysis, Insights and Forecast, 2019-2031
- 6.1. Market Analysis, Insights and Forecast - by Application
- 6.1.1. Biomedical Industry
- 6.1.2. Immunology Research
- 6.1.3. Cancer Research
- 6.2. Market Analysis, Insights and Forecast - by Types
- 6.2.1. Naturally Extracted
- 6.2.2. Synthetic
- 6.1. Market Analysis, Insights and Forecast - by Application
- 7. South America IL-1R Agonist Analysis, Insights and Forecast, 2019-2031
- 7.1. Market Analysis, Insights and Forecast - by Application
- 7.1.1. Biomedical Industry
- 7.1.2. Immunology Research
- 7.1.3. Cancer Research
- 7.2. Market Analysis, Insights and Forecast - by Types
- 7.2.1. Naturally Extracted
- 7.2.2. Synthetic
- 7.1. Market Analysis, Insights and Forecast - by Application
- 8. Europe IL-1R Agonist Analysis, Insights and Forecast, 2019-2031
- 8.1. Market Analysis, Insights and Forecast - by Application
- 8.1.1. Biomedical Industry
- 8.1.2. Immunology Research
- 8.1.3. Cancer Research
- 8.2. Market Analysis, Insights and Forecast - by Types
- 8.2.1. Naturally Extracted
- 8.2.2. Synthetic
- 8.1. Market Analysis, Insights and Forecast - by Application
- 9. Middle East & Africa IL-1R Agonist Analysis, Insights and Forecast, 2019-2031
- 9.1. Market Analysis, Insights and Forecast - by Application
- 9.1.1. Biomedical Industry
- 9.1.2. Immunology Research
- 9.1.3. Cancer Research
- 9.2. Market Analysis, Insights and Forecast - by Types
- 9.2.1. Naturally Extracted
- 9.2.2. Synthetic
- 9.1. Market Analysis, Insights and Forecast - by Application
- 10. Asia Pacific IL-1R Agonist Analysis, Insights and Forecast, 2019-2031
- 10.1. Market Analysis, Insights and Forecast - by Application
- 10.1.1. Biomedical Industry
- 10.1.2. Immunology Research
- 10.1.3. Cancer Research
- 10.2. Market Analysis, Insights and Forecast - by Types
- 10.2.1. Naturally Extracted
- 10.2.2. Synthetic
- 10.1. Market Analysis, Insights and Forecast - by Application
- 11. Competitive Analysis
- 11.1. Global Market Share Analysis 2024
- 11.2. Company Profiles
- 11.2.1 Abcam
- 11.2.1.1. Overview
- 11.2.1.2. Products
- 11.2.1.3. SWOT Analysis
- 11.2.1.4. Recent Developments
- 11.2.1.5. Financials (Based on Availability)
- 11.2.2 R&D Systems
- 11.2.2.1. Overview
- 11.2.2.2. Products
- 11.2.2.3. SWOT Analysis
- 11.2.2.4. Recent Developments
- 11.2.2.5. Financials (Based on Availability)
- 11.2.3 Novus Biologicals
- 11.2.3.1. Overview
- 11.2.3.2. Products
- 11.2.3.3. SWOT Analysis
- 11.2.3.4. Recent Developments
- 11.2.3.5. Financials (Based on Availability)
- 11.2.4 Cell Signaling Technology
- 11.2.4.1. Overview
- 11.2.4.2. Products
- 11.2.4.3. SWOT Analysis
- 11.2.4.4. Recent Developments
- 11.2.4.5. Financials (Based on Availability)
- 11.2.5 BioLegend
- 11.2.5.1. Overview
- 11.2.5.2. Products
- 11.2.5.3. SWOT Analysis
- 11.2.5.4. Recent Developments
- 11.2.5.5. Financials (Based on Availability)
- 11.2.6 Merck
- 11.2.6.1. Overview
- 11.2.6.2. Products
- 11.2.6.3. SWOT Analysis
- 11.2.6.4. Recent Developments
- 11.2.6.5. Financials (Based on Availability)
- 11.2.7 Thermo Fisher Scientific
- 11.2.7.1. Overview
- 11.2.7.2. Products
- 11.2.7.3. SWOT Analysis
- 11.2.7.4. Recent Developments
- 11.2.7.5. Financials (Based on Availability)
- 11.2.8 Cayman Chemical
- 11.2.8.1. Overview
- 11.2.8.2. Products
- 11.2.8.3. SWOT Analysis
- 11.2.8.4. Recent Developments
- 11.2.8.5. Financials (Based on Availability)
- 11.2.9 PeproTech
- 11.2.9.1. Overview
- 11.2.9.2. Products
- 11.2.9.3. SWOT Analysis
- 11.2.9.4. Recent Developments
- 11.2.9.5. Financials (Based on Availability)
- 11.2.10 BGI Genomics
- 11.2.10.1. Overview
- 11.2.10.2. Products
- 11.2.10.3. SWOT Analysis
- 11.2.10.4. Recent Developments
- 11.2.10.5. Financials (Based on Availability)
- 11.2.1 Abcam
List of Figures
- Figure 1: Global IL-1R Agonist Revenue Breakdown (million, %) by Region 2024 & 2032
- Figure 2: Global IL-1R Agonist Volume Breakdown (K, %) by Region 2024 & 2032
- Figure 3: North America IL-1R Agonist Revenue (million), by Application 2024 & 2032
- Figure 4: North America IL-1R Agonist Volume (K), by Application 2024 & 2032
- Figure 5: North America IL-1R Agonist Revenue Share (%), by Application 2024 & 2032
- Figure 6: North America IL-1R Agonist Volume Share (%), by Application 2024 & 2032
- Figure 7: North America IL-1R Agonist Revenue (million), by Types 2024 & 2032
- Figure 8: North America IL-1R Agonist Volume (K), by Types 2024 & 2032
- Figure 9: North America IL-1R Agonist Revenue Share (%), by Types 2024 & 2032
- Figure 10: North America IL-1R Agonist Volume Share (%), by Types 2024 & 2032
- Figure 11: North America IL-1R Agonist Revenue (million), by Country 2024 & 2032
- Figure 12: North America IL-1R Agonist Volume (K), by Country 2024 & 2032
- Figure 13: North America IL-1R Agonist Revenue Share (%), by Country 2024 & 2032
- Figure 14: North America IL-1R Agonist Volume Share (%), by Country 2024 & 2032
- Figure 15: South America IL-1R Agonist Revenue (million), by Application 2024 & 2032
- Figure 16: South America IL-1R Agonist Volume (K), by Application 2024 & 2032
- Figure 17: South America IL-1R Agonist Revenue Share (%), by Application 2024 & 2032
- Figure 18: South America IL-1R Agonist Volume Share (%), by Application 2024 & 2032
- Figure 19: South America IL-1R Agonist Revenue (million), by Types 2024 & 2032
- Figure 20: South America IL-1R Agonist Volume (K), by Types 2024 & 2032
- Figure 21: South America IL-1R Agonist Revenue Share (%), by Types 2024 & 2032
- Figure 22: South America IL-1R Agonist Volume Share (%), by Types 2024 & 2032
- Figure 23: South America IL-1R Agonist Revenue (million), by Country 2024 & 2032
- Figure 24: South America IL-1R Agonist Volume (K), by Country 2024 & 2032
- Figure 25: South America IL-1R Agonist Revenue Share (%), by Country 2024 & 2032
- Figure 26: South America IL-1R Agonist Volume Share (%), by Country 2024 & 2032
- Figure 27: Europe IL-1R Agonist Revenue (million), by Application 2024 & 2032
- Figure 28: Europe IL-1R Agonist Volume (K), by Application 2024 & 2032
- Figure 29: Europe IL-1R Agonist Revenue Share (%), by Application 2024 & 2032
- Figure 30: Europe IL-1R Agonist Volume Share (%), by Application 2024 & 2032
- Figure 31: Europe IL-1R Agonist Revenue (million), by Types 2024 & 2032
- Figure 32: Europe IL-1R Agonist Volume (K), by Types 2024 & 2032
- Figure 33: Europe IL-1R Agonist Revenue Share (%), by Types 2024 & 2032
- Figure 34: Europe IL-1R Agonist Volume Share (%), by Types 2024 & 2032
- Figure 35: Europe IL-1R Agonist Revenue (million), by Country 2024 & 2032
- Figure 36: Europe IL-1R Agonist Volume (K), by Country 2024 & 2032
- Figure 37: Europe IL-1R Agonist Revenue Share (%), by Country 2024 & 2032
- Figure 38: Europe IL-1R Agonist Volume Share (%), by Country 2024 & 2032
- Figure 39: Middle East & Africa IL-1R Agonist Revenue (million), by Application 2024 & 2032
- Figure 40: Middle East & Africa IL-1R Agonist Volume (K), by Application 2024 & 2032
- Figure 41: Middle East & Africa IL-1R Agonist Revenue Share (%), by Application 2024 & 2032
- Figure 42: Middle East & Africa IL-1R Agonist Volume Share (%), by Application 2024 & 2032
- Figure 43: Middle East & Africa IL-1R Agonist Revenue (million), by Types 2024 & 2032
- Figure 44: Middle East & Africa IL-1R Agonist Volume (K), by Types 2024 & 2032
- Figure 45: Middle East & Africa IL-1R Agonist Revenue Share (%), by Types 2024 & 2032
- Figure 46: Middle East & Africa IL-1R Agonist Volume Share (%), by Types 2024 & 2032
- Figure 47: Middle East & Africa IL-1R Agonist Revenue (million), by Country 2024 & 2032
- Figure 48: Middle East & Africa IL-1R Agonist Volume (K), by Country 2024 & 2032
- Figure 49: Middle East & Africa IL-1R Agonist Revenue Share (%), by Country 2024 & 2032
- Figure 50: Middle East & Africa IL-1R Agonist Volume Share (%), by Country 2024 & 2032
- Figure 51: Asia Pacific IL-1R Agonist Revenue (million), by Application 2024 & 2032
- Figure 52: Asia Pacific IL-1R Agonist Volume (K), by Application 2024 & 2032
- Figure 53: Asia Pacific IL-1R Agonist Revenue Share (%), by Application 2024 & 2032
- Figure 54: Asia Pacific IL-1R Agonist Volume Share (%), by Application 2024 & 2032
- Figure 55: Asia Pacific IL-1R Agonist Revenue (million), by Types 2024 & 2032
- Figure 56: Asia Pacific IL-1R Agonist Volume (K), by Types 2024 & 2032
- Figure 57: Asia Pacific IL-1R Agonist Revenue Share (%), by Types 2024 & 2032
- Figure 58: Asia Pacific IL-1R Agonist Volume Share (%), by Types 2024 & 2032
- Figure 59: Asia Pacific IL-1R Agonist Revenue (million), by Country 2024 & 2032
- Figure 60: Asia Pacific IL-1R Agonist Volume (K), by Country 2024 & 2032
- Figure 61: Asia Pacific IL-1R Agonist Revenue Share (%), by Country 2024 & 2032
- Figure 62: Asia Pacific IL-1R Agonist Volume Share (%), by Country 2024 & 2032
List of Tables
- Table 1: Global IL-1R Agonist Revenue million Forecast, by Region 2019 & 2032
- Table 2: Global IL-1R Agonist Volume K Forecast, by Region 2019 & 2032
- Table 3: Global IL-1R Agonist Revenue million Forecast, by Application 2019 & 2032
- Table 4: Global IL-1R Agonist Volume K Forecast, by Application 2019 & 2032
- Table 5: Global IL-1R Agonist Revenue million Forecast, by Types 2019 & 2032
- Table 6: Global IL-1R Agonist Volume K Forecast, by Types 2019 & 2032
- Table 7: Global IL-1R Agonist Revenue million Forecast, by Region 2019 & 2032
- Table 8: Global IL-1R Agonist Volume K Forecast, by Region 2019 & 2032
- Table 9: Global IL-1R Agonist Revenue million Forecast, by Application 2019 & 2032
- Table 10: Global IL-1R Agonist Volume K Forecast, by Application 2019 & 2032
- Table 11: Global IL-1R Agonist Revenue million Forecast, by Types 2019 & 2032
- Table 12: Global IL-1R Agonist Volume K Forecast, by Types 2019 & 2032
- Table 13: Global IL-1R Agonist Revenue million Forecast, by Country 2019 & 2032
- Table 14: Global IL-1R Agonist Volume K Forecast, by Country 2019 & 2032
- Table 15: United States IL-1R Agonist Revenue (million) Forecast, by Application 2019 & 2032
- Table 16: United States IL-1R Agonist Volume (K) Forecast, by Application 2019 & 2032
- Table 17: Canada IL-1R Agonist Revenue (million) Forecast, by Application 2019 & 2032
- Table 18: Canada IL-1R Agonist Volume (K) Forecast, by Application 2019 & 2032
- Table 19: Mexico IL-1R Agonist Revenue (million) Forecast, by Application 2019 & 2032
- Table 20: Mexico IL-1R Agonist Volume (K) Forecast, by Application 2019 & 2032
- Table 21: Global IL-1R Agonist Revenue million Forecast, by Application 2019 & 2032
- Table 22: Global IL-1R Agonist Volume K Forecast, by Application 2019 & 2032
- Table 23: Global IL-1R Agonist Revenue million Forecast, by Types 2019 & 2032
- Table 24: Global IL-1R Agonist Volume K Forecast, by Types 2019 & 2032
- Table 25: Global IL-1R Agonist Revenue million Forecast, by Country 2019 & 2032
- Table 26: Global IL-1R Agonist Volume K Forecast, by Country 2019 & 2032
- Table 27: Brazil IL-1R Agonist Revenue (million) Forecast, by Application 2019 & 2032
- Table 28: Brazil IL-1R Agonist Volume (K) Forecast, by Application 2019 & 2032
- Table 29: Argentina IL-1R Agonist Revenue (million) Forecast, by Application 2019 & 2032
- Table 30: Argentina IL-1R Agonist Volume (K) Forecast, by Application 2019 & 2032
- Table 31: Rest of South America IL-1R Agonist Revenue (million) Forecast, by Application 2019 & 2032
- Table 32: Rest of South America IL-1R Agonist Volume (K) Forecast, by Application 2019 & 2032
- Table 33: Global IL-1R Agonist Revenue million Forecast, by Application 2019 & 2032
- Table 34: Global IL-1R Agonist Volume K Forecast, by Application 2019 & 2032
- Table 35: Global IL-1R Agonist Revenue million Forecast, by Types 2019 & 2032
- Table 36: Global IL-1R Agonist Volume K Forecast, by Types 2019 & 2032
- Table 37: Global IL-1R Agonist Revenue million Forecast, by Country 2019 & 2032
- Table 38: Global IL-1R Agonist Volume K Forecast, by Country 2019 & 2032
- Table 39: United Kingdom IL-1R Agonist Revenue (million) Forecast, by Application 2019 & 2032
- Table 40: United Kingdom IL-1R Agonist Volume (K) Forecast, by Application 2019 & 2032
- Table 41: Germany IL-1R Agonist Revenue (million) Forecast, by Application 2019 & 2032
- Table 42: Germany IL-1R Agonist Volume (K) Forecast, by Application 2019 & 2032
- Table 43: France IL-1R Agonist Revenue (million) Forecast, by Application 2019 & 2032
- Table 44: France IL-1R Agonist Volume (K) Forecast, by Application 2019 & 2032
- Table 45: Italy IL-1R Agonist Revenue (million) Forecast, by Application 2019 & 2032
- Table 46: Italy IL-1R Agonist Volume (K) Forecast, by Application 2019 & 2032
- Table 47: Spain IL-1R Agonist Revenue (million) Forecast, by Application 2019 & 2032
- Table 48: Spain IL-1R Agonist Volume (K) Forecast, by Application 2019 & 2032
- Table 49: Russia IL-1R Agonist Revenue (million) Forecast, by Application 2019 & 2032
- Table 50: Russia IL-1R Agonist Volume (K) Forecast, by Application 2019 & 2032
- Table 51: Benelux IL-1R Agonist Revenue (million) Forecast, by Application 2019 & 2032
- Table 52: Benelux IL-1R Agonist Volume (K) Forecast, by Application 2019 & 2032
- Table 53: Nordics IL-1R Agonist Revenue (million) Forecast, by Application 2019 & 2032
- Table 54: Nordics IL-1R Agonist Volume (K) Forecast, by Application 2019 & 2032
- Table 55: Rest of Europe IL-1R Agonist Revenue (million) Forecast, by Application 2019 & 2032
- Table 56: Rest of Europe IL-1R Agonist Volume (K) Forecast, by Application 2019 & 2032
- Table 57: Global IL-1R Agonist Revenue million Forecast, by Application 2019 & 2032
- Table 58: Global IL-1R Agonist Volume K Forecast, by Application 2019 & 2032
- Table 59: Global IL-1R Agonist Revenue million Forecast, by Types 2019 & 2032
- Table 60: Global IL-1R Agonist Volume K Forecast, by Types 2019 & 2032
- Table 61: Global IL-1R Agonist Revenue million Forecast, by Country 2019 & 2032
- Table 62: Global IL-1R Agonist Volume K Forecast, by Country 2019 & 2032
- Table 63: Turkey IL-1R Agonist Revenue (million) Forecast, by Application 2019 & 2032
- Table 64: Turkey IL-1R Agonist Volume (K) Forecast, by Application 2019 & 2032
- Table 65: Israel IL-1R Agonist Revenue (million) Forecast, by Application 2019 & 2032
- Table 66: Israel IL-1R Agonist Volume (K) Forecast, by Application 2019 & 2032
- Table 67: GCC IL-1R Agonist Revenue (million) Forecast, by Application 2019 & 2032
- Table 68: GCC IL-1R Agonist Volume (K) Forecast, by Application 2019 & 2032
- Table 69: North Africa IL-1R Agonist Revenue (million) Forecast, by Application 2019 & 2032
- Table 70: North Africa IL-1R Agonist Volume (K) Forecast, by Application 2019 & 2032
- Table 71: South Africa IL-1R Agonist Revenue (million) Forecast, by Application 2019 & 2032
- Table 72: South Africa IL-1R Agonist Volume (K) Forecast, by Application 2019 & 2032
- Table 73: Rest of Middle East & Africa IL-1R Agonist Revenue (million) Forecast, by Application 2019 & 2032
- Table 74: Rest of Middle East & Africa IL-1R Agonist Volume (K) Forecast, by Application 2019 & 2032
- Table 75: Global IL-1R Agonist Revenue million Forecast, by Application 2019 & 2032
- Table 76: Global IL-1R Agonist Volume K Forecast, by Application 2019 & 2032
- Table 77: Global IL-1R Agonist Revenue million Forecast, by Types 2019 & 2032
- Table 78: Global IL-1R Agonist Volume K Forecast, by Types 2019 & 2032
- Table 79: Global IL-1R Agonist Revenue million Forecast, by Country 2019 & 2032
- Table 80: Global IL-1R Agonist Volume K Forecast, by Country 2019 & 2032
- Table 81: China IL-1R Agonist Revenue (million) Forecast, by Application 2019 & 2032
- Table 82: China IL-1R Agonist Volume (K) Forecast, by Application 2019 & 2032
- Table 83: India IL-1R Agonist Revenue (million) Forecast, by Application 2019 & 2032
- Table 84: India IL-1R Agonist Volume (K) Forecast, by Application 2019 & 2032
- Table 85: Japan IL-1R Agonist Revenue (million) Forecast, by Application 2019 & 2032
- Table 86: Japan IL-1R Agonist Volume (K) Forecast, by Application 2019 & 2032
- Table 87: South Korea IL-1R Agonist Revenue (million) Forecast, by Application 2019 & 2032
- Table 88: South Korea IL-1R Agonist Volume (K) Forecast, by Application 2019 & 2032
- Table 89: ASEAN IL-1R Agonist Revenue (million) Forecast, by Application 2019 & 2032
- Table 90: ASEAN IL-1R Agonist Volume (K) Forecast, by Application 2019 & 2032
- Table 91: Oceania IL-1R Agonist Revenue (million) Forecast, by Application 2019 & 2032
- Table 92: Oceania IL-1R Agonist Volume (K) Forecast, by Application 2019 & 2032
- Table 93: Rest of Asia Pacific IL-1R Agonist Revenue (million) Forecast, by Application 2019 & 2032
- Table 94: Rest of Asia Pacific IL-1R Agonist Volume (K) Forecast, by Application 2019 & 2032
Frequently Asked Questions
1. What is the projected Compound Annual Growth Rate (CAGR) of the IL-1R Agonist?
The projected CAGR is approximately 7%.
2. Which companies are prominent players in the IL-1R Agonist?
Key companies in the market include Abcam, R&D Systems, Novus Biologicals, Cell Signaling Technology, BioLegend, Merck, Thermo Fisher Scientific, Cayman Chemical, PeproTech, BGI Genomics.
3. What are the main segments of the IL-1R Agonist?
The market segments include Application, Types.
4. Can you provide details about the market size?
The market size is estimated to be USD 656 million as of 2022.
5. What are some drivers contributing to market growth?
N/A
6. What are the notable trends driving market growth?
N/A
7. Are there any restraints impacting market growth?
N/A
8. Can you provide examples of recent developments in the market?
N/A
9. What pricing options are available for accessing the report?
Pricing options include single-user, multi-user, and enterprise licenses priced at USD 3950.00, USD 5925.00, and USD 7900.00 respectively.
10. Is the market size provided in terms of value or volume?
The market size is provided in terms of value, measured in million and volume, measured in K.
11. Are there any specific market keywords associated with the report?
Yes, the market keyword associated with the report is "IL-1R Agonist," which aids in identifying and referencing the specific market segment covered.
12. How do I determine which pricing option suits my needs best?
The pricing options vary based on user requirements and access needs. Individual users may opt for single-user licenses, while businesses requiring broader access may choose multi-user or enterprise licenses for cost-effective access to the report.
13. Are there any additional resources or data provided in the IL-1R Agonist report?
While the report offers comprehensive insights, it's advisable to review the specific contents or supplementary materials provided to ascertain if additional resources or data are available.
14. How can I stay updated on further developments or reports in the IL-1R Agonist?
To stay informed about further developments, trends, and reports in the IL-1R Agonist, consider subscribing to industry newsletters, following relevant companies and organizations, or regularly checking reputable industry news sources and publications.
Methodology
Step 1 - Identification of Relevant Samples Size from Population Database


Step 2 - Approaches for Defining Global Market Size (Value, Volume* & Price*)

Note*: In applicable scenarios
Step 3 - Data Sources
Primary Research
- Web Analytics
- Survey Reports
- Research Institute
- Latest Research Reports
- Opinion Leaders
Secondary Research
- Annual Reports
- White Paper
- Latest Press Release
- Industry Association
- Paid Database
- Investor Presentations

Step 4 - Data Triangulation
Involves using different sources of information in order to increase the validity of a study
These sources are likely to be stakeholders in a program - participants, other researchers, program staff, other community members, and so on.
Then we put all data in single framework & apply various statistical tools to find out the dynamic on the market.
During the analysis stage, feedback from the stakeholder groups would be compared to determine areas of agreement as well as areas of divergence


