
Key Insights
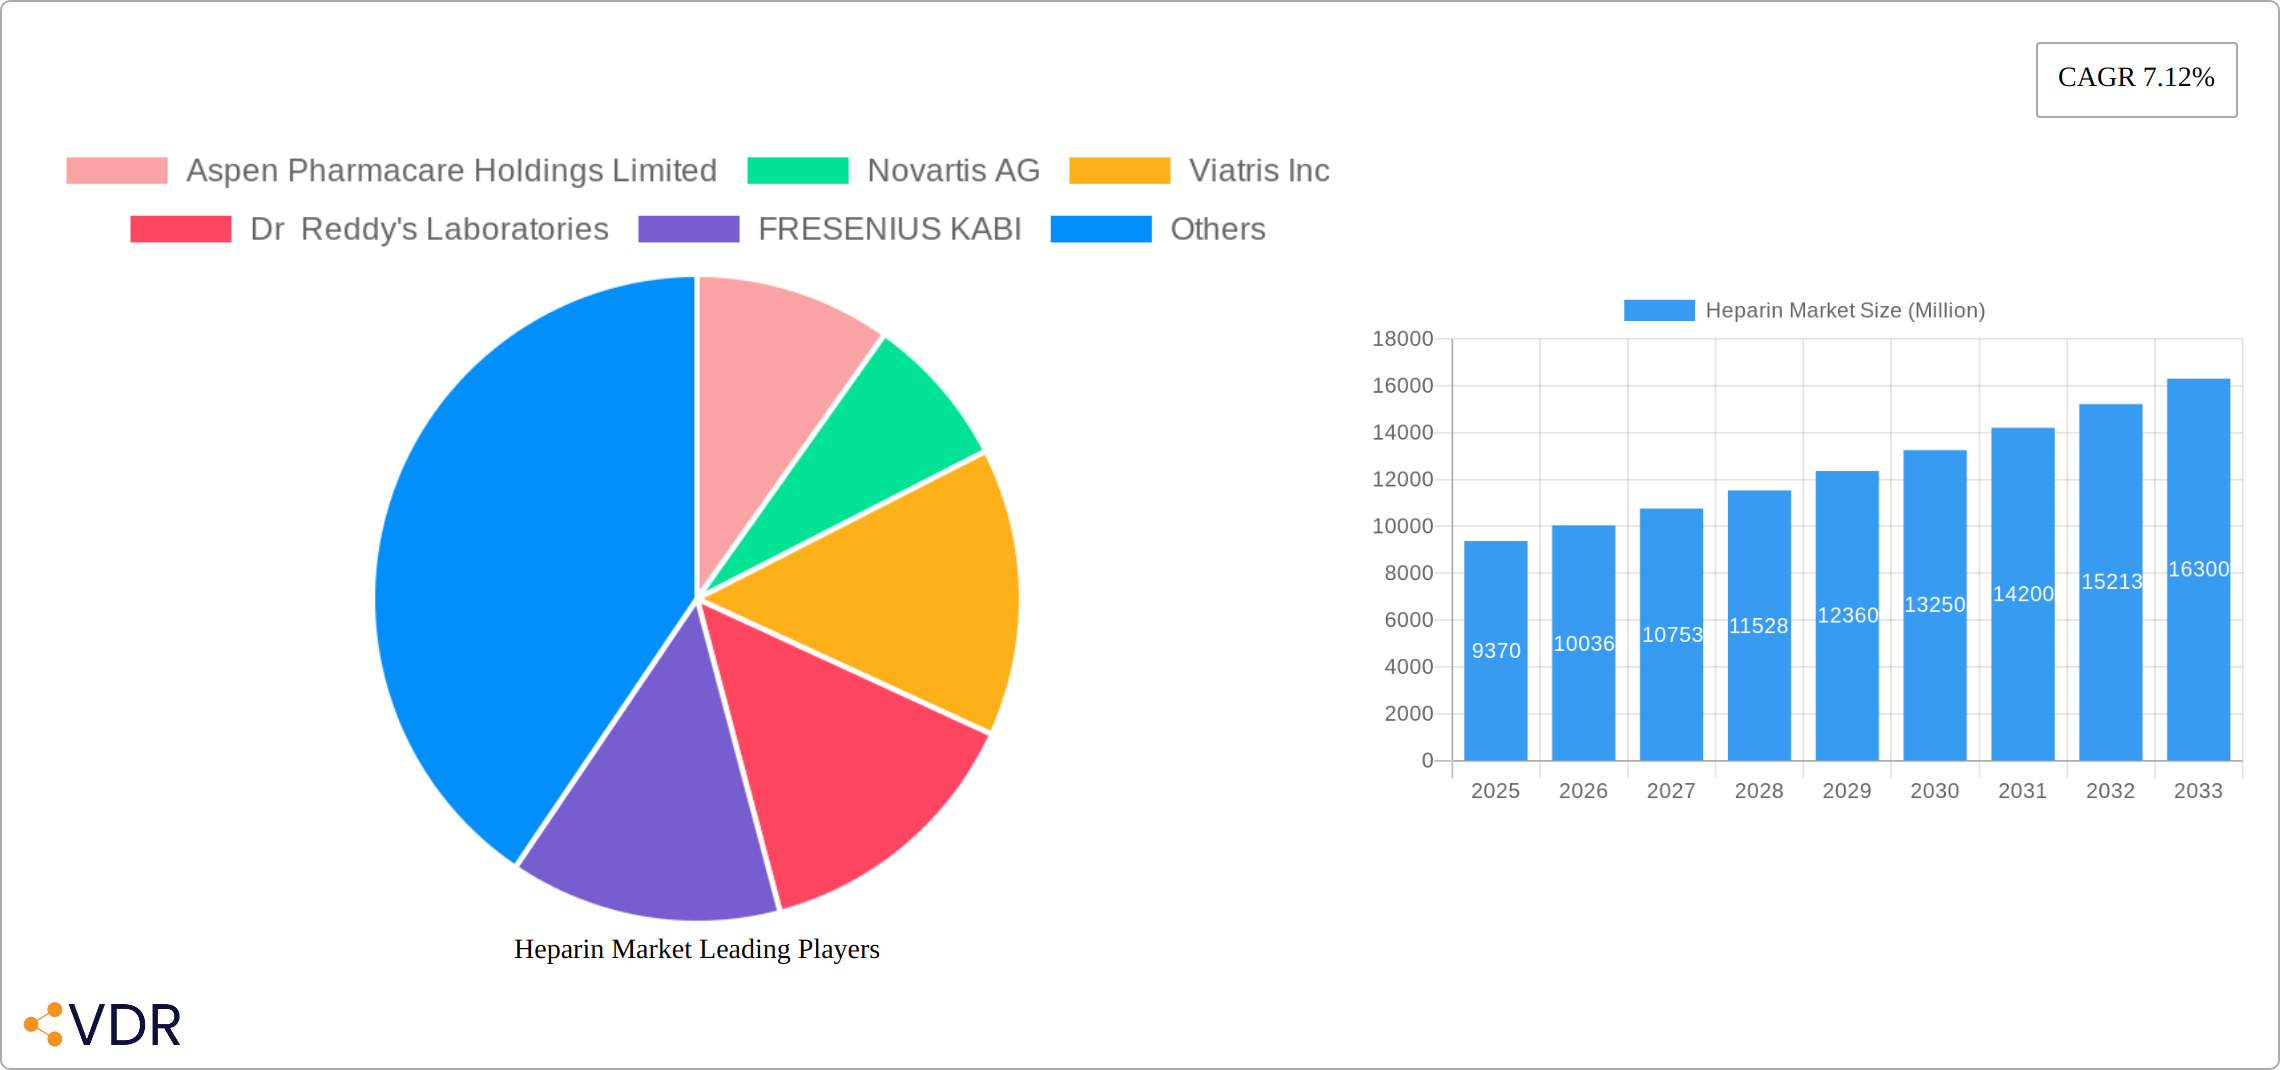
The global heparin market, valued at $9.37 billion in 2025, is projected to experience robust growth, driven by a compound annual growth rate (CAGR) of 7.12% from 2025 to 2033. This expansion is fueled by several key factors. The increasing prevalence of cardiovascular diseases, such as deep vein thrombosis (DVT), atrial fibrillation, and coronary artery disease, necessitates widespread heparin usage for anticoagulation. Furthermore, advancements in heparin formulations, including the development of ultra-low molecular weight heparin (ULMWH), are contributing to improved patient outcomes and wider adoption. The growing geriatric population, susceptible to thromboembolic events, further bolsters market demand. Geographical expansion, particularly in emerging economies with rising healthcare infrastructure and awareness, presents significant opportunities. However, challenges such as the inherent risks associated with heparin administration, including heparin-induced thrombocytopenia (HIT), and the fluctuating cost of raw materials (bovine and porcine sources) act as market restraints. The market segmentation reveals that LMWH and ULMWH are gaining traction over unfractionated heparin due to their improved safety profiles and convenience. Boehringer Ingelheim and Sanofi are significant players, along with other established pharmaceutical companies across different geographical regions (North America maintains a leading market share due to high healthcare expenditure and advanced healthcare infrastructure).
The competitive landscape is characterized by the presence of both large multinational pharmaceutical companies and smaller specialty manufacturers. Strategic partnerships, mergers and acquisitions, and the introduction of innovative products are key competitive strategies. The forecast period (2025-2033) will witness continued market expansion, influenced by ongoing research and development efforts focused on safer and more effective heparin derivatives, alongside expanding market penetration in under-served regions. Future growth will likely be shaped by the evolving regulatory landscape, the introduction of biosimilars, and the increasing focus on personalized medicine approaches to anticoagulation therapy. The market's trajectory suggests continued growth, despite challenges, driven by unmet clinical needs and advancements in the field.
Heparin Market: A Comprehensive Market Report (2019-2033)
This comprehensive report provides a detailed analysis of the global Heparin market, encompassing its dynamics, growth trends, regional segmentation, product landscape, key players, and future outlook. The study period covers 2019-2033, with 2025 as the base year and a forecast period of 2025-2033. The report is invaluable for industry professionals, investors, and strategic decision-makers seeking a deep understanding of this vital pharmaceutical sector. The parent market is the anticoagulant drugs market and the child market is the specific Heparin segment within it.
Heparin Market Dynamics & Structure
The global Heparin market exhibits a moderately consolidated structure, with several key players controlling a significant portion of the market share. The market is driven by technological innovations aimed at improving the efficacy and safety of Heparin products, alongside increasing prevalence of cardiovascular diseases and thromboembolic disorders. Stringent regulatory frameworks govern the manufacturing and distribution of Heparin, impacting market dynamics. Competitive product substitutes, such as direct thrombin inhibitors and factor Xa inhibitors, exert pressure on market growth. The end-user demographics primarily comprise hospitals, clinics, and ambulatory surgical centers. M&A activity in the market remains moderate, with a projected xx deals in the past five years, resulting in a xx% increase in market concentration.
- Market Concentration: Moderately consolidated, with top 5 players holding approximately xx% market share in 2024.
- Technological Innovation: Focus on developing synthetic Heparin to address supply chain vulnerabilities and cost optimization.
- Regulatory Framework: Stringent regulations regarding purity, safety, and efficacy of Heparin products.
- Competitive Substitutes: Direct thrombin inhibitors and Factor Xa inhibitors pose competitive pressure.
- End-User Demographics: Hospitals (xx%), Clinics (xx%), Ambulatory Surgical Centers (xx%).
- M&A Activity: xx deals in the past five years, leading to a xx% increase in market concentration.
Heparin Market Growth Trends & Insights
The global heparin market is experiencing robust growth, fueled by the escalating incidence of cardiovascular diseases, thromboembolic disorders, and a globally aging population. Market valuation in 2024 reached xx Million units and is projected to attain xx Million units by 2033, demonstrating a CAGR of xx% throughout the forecast period. This growth is significantly driven by the increasing preference for Low Molecular Weight Heparin (LMWH) and Ultra-Low Molecular Weight Heparin (ULMWH) over unfractionated heparin, owing to their superior safety profiles and ease of administration. Furthermore, ongoing technological advancements in drug delivery systems, including targeted therapies and personalized medicine approaches, are poised to further accelerate market expansion. A notable shift in consumer behavior reflects a growing demand for convenient and safer anticoagulant therapies.
- Market Size Evolution: A substantial increase from xx Million units in 2019 to xx Million units in 2024, with projections reaching xx Million units by 2033.
- Adoption Rates: LMWH and ULMWH are witnessing considerably higher adoption rates compared to unfractionated heparin, reflecting a market trend towards improved safety and efficacy.
- Technological Disruptions: Significant advancements in synthetic production methods, including bioengineered alternatives, and innovative targeted drug delivery systems are reshaping the market landscape.
- Consumer Behavior Shifts: Patients and healthcare providers increasingly prioritize convenient, safer, and more effective anticoagulation therapies, driving demand for LMWH and ULMWH.
Dominant Regions, Countries, or Segments in Heparin Market
North America currently dominates the Heparin market, driven by high healthcare expenditure, advanced healthcare infrastructure, and a large patient population with cardiovascular diseases. Within product segments, LMWH holds the largest market share due to its superior efficacy and safety profile. The porcine source segment dominates due to its availability and cost-effectiveness. Deep vein thrombosis (DVT) remains the largest application segment. Europe follows North America in terms of market size, while the Asia-Pacific region is exhibiting the fastest growth rate due to rising healthcare awareness and increasing prevalence of cardiovascular diseases.
- Leading Region: North America (xx% market share)
- Fastest-Growing Region: Asia-Pacific (xx% CAGR)
- Dominant Product Segment: LMWH (xx% market share)
- Dominant Source Segment: Porcine (xx% market share)
- Largest Application Segment: Deep Vein Thrombosis (DVT) (xx% market share)
Heparin Market Product Landscape
The Heparin market offers a range of products, including unfractionated Heparin, LMWH, and ULMWH, each with unique properties and applications. Recent innovations focus on improving the purity and consistency of Heparin, minimizing the risk of adverse events. Technological advancements encompass novel drug delivery systems, such as pre-filled syringes and auto-injectors, enhancing patient convenience and compliance. The unique selling propositions (USPs) of various products hinge on efficacy, safety, and ease of administration.
Key Drivers, Barriers & Challenges in Heparin Market
Key Drivers:
- The persistently rising prevalence of cardiovascular diseases and thromboembolic disorders globally.
- The growing demand for convenient, safer, and more effective anticoagulant options, particularly among elderly populations.
- Continuous technological advancements in drug delivery and production methods, leading to improved efficacy and reduced side effects.
- Increased investment in research and development of novel heparin derivatives and alternatives.
Key Challenges and Restraints:
- Ongoing concerns regarding heparin contamination and the need for robust quality control measures throughout the supply chain.
- Stringent regulatory requirements and approvals processes for new heparin products and manufacturing facilities.
- Intense price competition and cost pressures affecting profitability within the market.
- Potential supply chain disruptions and their impact on product availability and pricing volatility.
- The emergence of competitive anticoagulant therapies impacting market share.
Emerging Opportunities in Heparin Market
- Development of novel Heparin derivatives with enhanced efficacy and reduced side effects.
- Expansion into emerging markets with growing healthcare infrastructure.
- Exploration of new therapeutic applications for Heparin.
- Personalized medicine approaches for optimizing Heparin therapy.
Growth Accelerators in the Heparin Market Industry
Sustained long-term growth in the heparin market is projected to be significantly accelerated by strategic collaborations between pharmaceutical companies and research institutions focused on developing innovative heparin products. Expansion into emerging markets, particularly in developing countries experiencing rising healthcare expenditure, presents significant opportunities for growth. Further advancements in synthetic heparin production aim to achieve cost reductions, enhance supply chain reliability, and improve the overall quality and safety of available products.
Key Players Shaping the Heparin Market Market
- Aspen Pharmacare Holdings Limited
- Novartis AG
- Viatris Inc
- Dr Reddy's Laboratories
- FRESENIUS KABI
- Leo Pharma AS
- HIKMA PHARMACEUTICALS
- Opocrin SpA
- GLAND PHARMA
- Techdow USA
- Smiths Medical
- B Braun Melsungen AG
- Hebei Changshan Biochemical Pharmaceutical
- Baxter International Inc
- Pfizer Inc
Notable Milestones in Heparin Market Sector
- February 2022: Techdow USA Inc. launched Heparin Sodium Injection in the United States market. This launch expanded market competition and increased product availability.
- January 2022: Optimvia Pharmaceuticals announced a synthetic method for Heparin production, potentially improving supply chain stability and cost-effectiveness. This development could significantly impact future market dynamics.
In-Depth Heparin Market Market Outlook
The heparin market is poised for continued and substantial growth, propelled by technological advancements leading to safer and more effective products, the rising prevalence of cardiovascular and thromboembolic diseases, and market expansion into new geographical regions. Strategic partnerships, substantial investments in research and development, and the development of novel heparin derivatives and biosimilars represent significant opportunities for market players. The long-term market potential is substantial, particularly in regions with expanding healthcare infrastructure and a rapidly aging population. However, addressing concerns regarding safety, contamination, and supply chain stability will be crucial for sustained market growth.
Heparin Market Segmentation
-
1. Product
- 1.1. Unfractionated Heparin
- 1.2. Low Molecular Weight Heparin (LMWH)
- 1.3. Ultra-low Molecular Weight Heparin (ULMWH)
-
2. Source
- 2.1. Bovine
- 2.2. Porcine
-
3. Application
- 3.1. Deep Vein Thrombosis (DVT)
- 3.2. Atrial Fibrillation and Heart Attack
- 3.3. Coronery Artery Disease
- 3.4. Other Applications
Heparin Market Segmentation By Geography
-
1. North America
- 1.1. United States
- 1.2. Canada
- 1.3. Mexico
-
2. Europe
- 2.1. Germany
- 2.2. United Kingdom
- 2.3. France
- 2.4. Italy
- 2.5. Spain
- 2.6. Rest of Europe
-
3. Asia Pacific
- 3.1. China
- 3.2. Japan
- 3.3. India
- 3.4. Australia
- 3.5. South Korea
- 3.6. Rest of Asia Pacific
-
4. Middle East and Africa
- 4.1. GCC
- 4.2. South Africa
- 4.3. Rest of Middle East and Africa
-
5. South America
- 5.1. Brazil
- 5.2. Argentina
- 5.3. Rest of South America

Heparin Market REPORT HIGHLIGHTS
| Aspects | Details |
|---|---|
| Study Period | 2019-2033 |
| Base Year | 2024 |
| Estimated Year | 2025 |
| Forecast Period | 2025-2033 |
| Historical Period | 2019-2024 |
| Growth Rate | CAGR of 7.12% from 2019-2033 |
| Segmentation |
|
Table of Contents
- 1. Introduction
- 1.1. Research Scope
- 1.2. Market Segmentation
- 1.3. Research Methodology
- 1.4. Definitions and Assumptions
- 2. Executive Summary
- 2.1. Introduction
- 3. Market Dynamics
- 3.1. Introduction
- 3.2. Market Drivers
- 3.2.1. Increasing Prevalence of Chronic Diseases; Rise in Geriatric Population
- 3.3. Market Restrains
- 3.3.1. Side Effects of Heparin and Emergence of Oral Coagulants
- 3.4. Market Trends
- 3.4.1. Low Molecular Weight Heparin (LMWH) is Expected to Hold a Significant Share in the Heparin Market During the Forecast Period
- 4. Market Factor Analysis
- 4.1. Porters Five Forces
- 4.2. Supply/Value Chain
- 4.3. PESTEL analysis
- 4.4. Market Entropy
- 4.5. Patent/Trademark Analysis
- 5. Global Heparin Market Analysis, Insights and Forecast, 2019-2031
- 5.1. Market Analysis, Insights and Forecast - by Product
- 5.1.1. Unfractionated Heparin
- 5.1.2. Low Molecular Weight Heparin (LMWH)
- 5.1.3. Ultra-low Molecular Weight Heparin (ULMWH)
- 5.2. Market Analysis, Insights and Forecast - by Source
- 5.2.1. Bovine
- 5.2.2. Porcine
- 5.3. Market Analysis, Insights and Forecast - by Application
- 5.3.1. Deep Vein Thrombosis (DVT)
- 5.3.2. Atrial Fibrillation and Heart Attack
- 5.3.3. Coronery Artery Disease
- 5.3.4. Other Applications
- 5.4. Market Analysis, Insights and Forecast - by Region
- 5.4.1. North America
- 5.4.2. Europe
- 5.4.3. Asia Pacific
- 5.4.4. Middle East and Africa
- 5.4.5. South America
- 5.1. Market Analysis, Insights and Forecast - by Product
- 6. North America Heparin Market Analysis, Insights and Forecast, 2019-2031
- 6.1. Market Analysis, Insights and Forecast - by Product
- 6.1.1. Unfractionated Heparin
- 6.1.2. Low Molecular Weight Heparin (LMWH)
- 6.1.3. Ultra-low Molecular Weight Heparin (ULMWH)
- 6.2. Market Analysis, Insights and Forecast - by Source
- 6.2.1. Bovine
- 6.2.2. Porcine
- 6.3. Market Analysis, Insights and Forecast - by Application
- 6.3.1. Deep Vein Thrombosis (DVT)
- 6.3.2. Atrial Fibrillation and Heart Attack
- 6.3.3. Coronery Artery Disease
- 6.3.4. Other Applications
- 6.1. Market Analysis, Insights and Forecast - by Product
- 7. Europe Heparin Market Analysis, Insights and Forecast, 2019-2031
- 7.1. Market Analysis, Insights and Forecast - by Product
- 7.1.1. Unfractionated Heparin
- 7.1.2. Low Molecular Weight Heparin (LMWH)
- 7.1.3. Ultra-low Molecular Weight Heparin (ULMWH)
- 7.2. Market Analysis, Insights and Forecast - by Source
- 7.2.1. Bovine
- 7.2.2. Porcine
- 7.3. Market Analysis, Insights and Forecast - by Application
- 7.3.1. Deep Vein Thrombosis (DVT)
- 7.3.2. Atrial Fibrillation and Heart Attack
- 7.3.3. Coronery Artery Disease
- 7.3.4. Other Applications
- 7.1. Market Analysis, Insights and Forecast - by Product
- 8. Asia Pacific Heparin Market Analysis, Insights and Forecast, 2019-2031
- 8.1. Market Analysis, Insights and Forecast - by Product
- 8.1.1. Unfractionated Heparin
- 8.1.2. Low Molecular Weight Heparin (LMWH)
- 8.1.3. Ultra-low Molecular Weight Heparin (ULMWH)
- 8.2. Market Analysis, Insights and Forecast - by Source
- 8.2.1. Bovine
- 8.2.2. Porcine
- 8.3. Market Analysis, Insights and Forecast - by Application
- 8.3.1. Deep Vein Thrombosis (DVT)
- 8.3.2. Atrial Fibrillation and Heart Attack
- 8.3.3. Coronery Artery Disease
- 8.3.4. Other Applications
- 8.1. Market Analysis, Insights and Forecast - by Product
- 9. Middle East and Africa Heparin Market Analysis, Insights and Forecast, 2019-2031
- 9.1. Market Analysis, Insights and Forecast - by Product
- 9.1.1. Unfractionated Heparin
- 9.1.2. Low Molecular Weight Heparin (LMWH)
- 9.1.3. Ultra-low Molecular Weight Heparin (ULMWH)
- 9.2. Market Analysis, Insights and Forecast - by Source
- 9.2.1. Bovine
- 9.2.2. Porcine
- 9.3. Market Analysis, Insights and Forecast - by Application
- 9.3.1. Deep Vein Thrombosis (DVT)
- 9.3.2. Atrial Fibrillation and Heart Attack
- 9.3.3. Coronery Artery Disease
- 9.3.4. Other Applications
- 9.1. Market Analysis, Insights and Forecast - by Product
- 10. South America Heparin Market Analysis, Insights and Forecast, 2019-2031
- 10.1. Market Analysis, Insights and Forecast - by Product
- 10.1.1. Unfractionated Heparin
- 10.1.2. Low Molecular Weight Heparin (LMWH)
- 10.1.3. Ultra-low Molecular Weight Heparin (ULMWH)
- 10.2. Market Analysis, Insights and Forecast - by Source
- 10.2.1. Bovine
- 10.2.2. Porcine
- 10.3. Market Analysis, Insights and Forecast - by Application
- 10.3.1. Deep Vein Thrombosis (DVT)
- 10.3.2. Atrial Fibrillation and Heart Attack
- 10.3.3. Coronery Artery Disease
- 10.3.4. Other Applications
- 10.1. Market Analysis, Insights and Forecast - by Product
- 11. North America Heparin Market Analysis, Insights and Forecast, 2019-2031
- 11.1. Market Analysis, Insights and Forecast - By Country/Sub-region
- 11.1.1. undefined
- 12. Europe Heparin Market Analysis, Insights and Forecast, 2019-2031
- 12.1. Market Analysis, Insights and Forecast - By Country/Sub-region
- 12.1.1. undefined
- 13. Asia Pacific Heparin Market Analysis, Insights and Forecast, 2019-2031
- 13.1. Market Analysis, Insights and Forecast - By Country/Sub-region
- 13.1.1. undefined
- 14. Middle East and Africa Heparin Market Analysis, Insights and Forecast, 2019-2031
- 14.1. Market Analysis, Insights and Forecast - By Country/Sub-region
- 14.1.1. undefined
- 15. South America Heparin Market Analysis, Insights and Forecast, 2019-2031
- 15.1. Market Analysis, Insights and Forecast - By Country/Sub-region
- 15.1.1. undefined
- 16. Competitive Analysis
- 16.1. Global Market Share Analysis 2024
- 16.2. Company Profiles
- 16.2.1 Aspen Pharmacare Holdings Limited
- 16.2.1.1. Overview
- 16.2.1.2. Products
- 16.2.1.3. SWOT Analysis
- 16.2.1.4. Recent Developments
- 16.2.1.5. Financials (Based on Availability)
- 16.2.2 Novartis AG
- 16.2.2.1. Overview
- 16.2.2.2. Products
- 16.2.2.3. SWOT Analysis
- 16.2.2.4. Recent Developments
- 16.2.2.5. Financials (Based on Availability)
- 16.2.3 Viatris Inc
- 16.2.3.1. Overview
- 16.2.3.2. Products
- 16.2.3.3. SWOT Analysis
- 16.2.3.4. Recent Developments
- 16.2.3.5. Financials (Based on Availability)
- 16.2.4 Dr Reddy's Laboratories
- 16.2.4.1. Overview
- 16.2.4.2. Products
- 16.2.4.3. SWOT Analysis
- 16.2.4.4. Recent Developments
- 16.2.4.5. Financials (Based on Availability)
- 16.2.5 FRESENIUS KABI
- 16.2.5.1. Overview
- 16.2.5.2. Products
- 16.2.5.3. SWOT Analysis
- 16.2.5.4. Recent Developments
- 16.2.5.5. Financials (Based on Availability)
- 16.2.6 Leo Pharma AS
- 16.2.6.1. Overview
- 16.2.6.2. Products
- 16.2.6.3. SWOT Analysis
- 16.2.6.4. Recent Developments
- 16.2.6.5. Financials (Based on Availability)
- 16.2.7 HIKMA PHARMACEUTICALS
- 16.2.7.1. Overview
- 16.2.7.2. Products
- 16.2.7.3. SWOT Analysis
- 16.2.7.4. Recent Developments
- 16.2.7.5. Financials (Based on Availability)
- 16.2.8 Opocrin SpA
- 16.2.8.1. Overview
- 16.2.8.2. Products
- 16.2.8.3. SWOT Analysis
- 16.2.8.4. Recent Developments
- 16.2.8.5. Financials (Based on Availability)
- 16.2.9 GLAND PHARMA
- 16.2.9.1. Overview
- 16.2.9.2. Products
- 16.2.9.3. SWOT Analysis
- 16.2.9.4. Recent Developments
- 16.2.9.5. Financials (Based on Availability)
- 16.2.10 Techdow USA
- 16.2.10.1. Overview
- 16.2.10.2. Products
- 16.2.10.3. SWOT Analysis
- 16.2.10.4. Recent Developments
- 16.2.10.5. Financials (Based on Availability)
- 16.2.11 Smiths Medical
- 16.2.11.1. Overview
- 16.2.11.2. Products
- 16.2.11.3. SWOT Analysis
- 16.2.11.4. Recent Developments
- 16.2.11.5. Financials (Based on Availability)
- 16.2.12 B Braun Melsungen AG
- 16.2.12.1. Overview
- 16.2.12.2. Products
- 16.2.12.3. SWOT Analysis
- 16.2.12.4. Recent Developments
- 16.2.12.5. Financials (Based on Availability)
- 16.2.13 Hebei Changshan Biochemical Pharmaceutical
- 16.2.13.1. Overview
- 16.2.13.2. Products
- 16.2.13.3. SWOT Analysis
- 16.2.13.4. Recent Developments
- 16.2.13.5. Financials (Based on Availability)
- 16.2.14 Baxter International Inc
- 16.2.14.1. Overview
- 16.2.14.2. Products
- 16.2.14.3. SWOT Analysis
- 16.2.14.4. Recent Developments
- 16.2.14.5. Financials (Based on Availability)
- 16.2.15 Pfizer Inc
- 16.2.15.1. Overview
- 16.2.15.2. Products
- 16.2.15.3. SWOT Analysis
- 16.2.15.4. Recent Developments
- 16.2.15.5. Financials (Based on Availability)
- 16.2.1 Aspen Pharmacare Holdings Limited
List of Figures
- Figure 1: Global Heparin Market Revenue Breakdown (Million, %) by Region 2024 & 2032
- Figure 2: Global Heparin Market Volume Breakdown (K Unit, %) by Region 2024 & 2032
- Figure 3: North America Heparin Market Revenue (Million), by Country 2024 & 2032
- Figure 4: North America Heparin Market Volume (K Unit), by Country 2024 & 2032
- Figure 5: North America Heparin Market Revenue Share (%), by Country 2024 & 2032
- Figure 6: North America Heparin Market Volume Share (%), by Country 2024 & 2032
- Figure 7: Europe Heparin Market Revenue (Million), by Country 2024 & 2032
- Figure 8: Europe Heparin Market Volume (K Unit), by Country 2024 & 2032
- Figure 9: Europe Heparin Market Revenue Share (%), by Country 2024 & 2032
- Figure 10: Europe Heparin Market Volume Share (%), by Country 2024 & 2032
- Figure 11: Asia Pacific Heparin Market Revenue (Million), by Country 2024 & 2032
- Figure 12: Asia Pacific Heparin Market Volume (K Unit), by Country 2024 & 2032
- Figure 13: Asia Pacific Heparin Market Revenue Share (%), by Country 2024 & 2032
- Figure 14: Asia Pacific Heparin Market Volume Share (%), by Country 2024 & 2032
- Figure 15: Middle East and Africa Heparin Market Revenue (Million), by Country 2024 & 2032
- Figure 16: Middle East and Africa Heparin Market Volume (K Unit), by Country 2024 & 2032
- Figure 17: Middle East and Africa Heparin Market Revenue Share (%), by Country 2024 & 2032
- Figure 18: Middle East and Africa Heparin Market Volume Share (%), by Country 2024 & 2032
- Figure 19: South America Heparin Market Revenue (Million), by Country 2024 & 2032
- Figure 20: South America Heparin Market Volume (K Unit), by Country 2024 & 2032
- Figure 21: South America Heparin Market Revenue Share (%), by Country 2024 & 2032
- Figure 22: South America Heparin Market Volume Share (%), by Country 2024 & 2032
- Figure 23: North America Heparin Market Revenue (Million), by Product 2024 & 2032
- Figure 24: North America Heparin Market Volume (K Unit), by Product 2024 & 2032
- Figure 25: North America Heparin Market Revenue Share (%), by Product 2024 & 2032
- Figure 26: North America Heparin Market Volume Share (%), by Product 2024 & 2032
- Figure 27: North America Heparin Market Revenue (Million), by Source 2024 & 2032
- Figure 28: North America Heparin Market Volume (K Unit), by Source 2024 & 2032
- Figure 29: North America Heparin Market Revenue Share (%), by Source 2024 & 2032
- Figure 30: North America Heparin Market Volume Share (%), by Source 2024 & 2032
- Figure 31: North America Heparin Market Revenue (Million), by Application 2024 & 2032
- Figure 32: North America Heparin Market Volume (K Unit), by Application 2024 & 2032
- Figure 33: North America Heparin Market Revenue Share (%), by Application 2024 & 2032
- Figure 34: North America Heparin Market Volume Share (%), by Application 2024 & 2032
- Figure 35: North America Heparin Market Revenue (Million), by Country 2024 & 2032
- Figure 36: North America Heparin Market Volume (K Unit), by Country 2024 & 2032
- Figure 37: North America Heparin Market Revenue Share (%), by Country 2024 & 2032
- Figure 38: North America Heparin Market Volume Share (%), by Country 2024 & 2032
- Figure 39: Europe Heparin Market Revenue (Million), by Product 2024 & 2032
- Figure 40: Europe Heparin Market Volume (K Unit), by Product 2024 & 2032
- Figure 41: Europe Heparin Market Revenue Share (%), by Product 2024 & 2032
- Figure 42: Europe Heparin Market Volume Share (%), by Product 2024 & 2032
- Figure 43: Europe Heparin Market Revenue (Million), by Source 2024 & 2032
- Figure 44: Europe Heparin Market Volume (K Unit), by Source 2024 & 2032
- Figure 45: Europe Heparin Market Revenue Share (%), by Source 2024 & 2032
- Figure 46: Europe Heparin Market Volume Share (%), by Source 2024 & 2032
- Figure 47: Europe Heparin Market Revenue (Million), by Application 2024 & 2032
- Figure 48: Europe Heparin Market Volume (K Unit), by Application 2024 & 2032
- Figure 49: Europe Heparin Market Revenue Share (%), by Application 2024 & 2032
- Figure 50: Europe Heparin Market Volume Share (%), by Application 2024 & 2032
- Figure 51: Europe Heparin Market Revenue (Million), by Country 2024 & 2032
- Figure 52: Europe Heparin Market Volume (K Unit), by Country 2024 & 2032
- Figure 53: Europe Heparin Market Revenue Share (%), by Country 2024 & 2032
- Figure 54: Europe Heparin Market Volume Share (%), by Country 2024 & 2032
- Figure 55: Asia Pacific Heparin Market Revenue (Million), by Product 2024 & 2032
- Figure 56: Asia Pacific Heparin Market Volume (K Unit), by Product 2024 & 2032
- Figure 57: Asia Pacific Heparin Market Revenue Share (%), by Product 2024 & 2032
- Figure 58: Asia Pacific Heparin Market Volume Share (%), by Product 2024 & 2032
- Figure 59: Asia Pacific Heparin Market Revenue (Million), by Source 2024 & 2032
- Figure 60: Asia Pacific Heparin Market Volume (K Unit), by Source 2024 & 2032
- Figure 61: Asia Pacific Heparin Market Revenue Share (%), by Source 2024 & 2032
- Figure 62: Asia Pacific Heparin Market Volume Share (%), by Source 2024 & 2032
- Figure 63: Asia Pacific Heparin Market Revenue (Million), by Application 2024 & 2032
- Figure 64: Asia Pacific Heparin Market Volume (K Unit), by Application 2024 & 2032
- Figure 65: Asia Pacific Heparin Market Revenue Share (%), by Application 2024 & 2032
- Figure 66: Asia Pacific Heparin Market Volume Share (%), by Application 2024 & 2032
- Figure 67: Asia Pacific Heparin Market Revenue (Million), by Country 2024 & 2032
- Figure 68: Asia Pacific Heparin Market Volume (K Unit), by Country 2024 & 2032
- Figure 69: Asia Pacific Heparin Market Revenue Share (%), by Country 2024 & 2032
- Figure 70: Asia Pacific Heparin Market Volume Share (%), by Country 2024 & 2032
- Figure 71: Middle East and Africa Heparin Market Revenue (Million), by Product 2024 & 2032
- Figure 72: Middle East and Africa Heparin Market Volume (K Unit), by Product 2024 & 2032
- Figure 73: Middle East and Africa Heparin Market Revenue Share (%), by Product 2024 & 2032
- Figure 74: Middle East and Africa Heparin Market Volume Share (%), by Product 2024 & 2032
- Figure 75: Middle East and Africa Heparin Market Revenue (Million), by Source 2024 & 2032
- Figure 76: Middle East and Africa Heparin Market Volume (K Unit), by Source 2024 & 2032
- Figure 77: Middle East and Africa Heparin Market Revenue Share (%), by Source 2024 & 2032
- Figure 78: Middle East and Africa Heparin Market Volume Share (%), by Source 2024 & 2032
- Figure 79: Middle East and Africa Heparin Market Revenue (Million), by Application 2024 & 2032
- Figure 80: Middle East and Africa Heparin Market Volume (K Unit), by Application 2024 & 2032
- Figure 81: Middle East and Africa Heparin Market Revenue Share (%), by Application 2024 & 2032
- Figure 82: Middle East and Africa Heparin Market Volume Share (%), by Application 2024 & 2032
- Figure 83: Middle East and Africa Heparin Market Revenue (Million), by Country 2024 & 2032
- Figure 84: Middle East and Africa Heparin Market Volume (K Unit), by Country 2024 & 2032
- Figure 85: Middle East and Africa Heparin Market Revenue Share (%), by Country 2024 & 2032
- Figure 86: Middle East and Africa Heparin Market Volume Share (%), by Country 2024 & 2032
- Figure 87: South America Heparin Market Revenue (Million), by Product 2024 & 2032
- Figure 88: South America Heparin Market Volume (K Unit), by Product 2024 & 2032
- Figure 89: South America Heparin Market Revenue Share (%), by Product 2024 & 2032
- Figure 90: South America Heparin Market Volume Share (%), by Product 2024 & 2032
- Figure 91: South America Heparin Market Revenue (Million), by Source 2024 & 2032
- Figure 92: South America Heparin Market Volume (K Unit), by Source 2024 & 2032
- Figure 93: South America Heparin Market Revenue Share (%), by Source 2024 & 2032
- Figure 94: South America Heparin Market Volume Share (%), by Source 2024 & 2032
- Figure 95: South America Heparin Market Revenue (Million), by Application 2024 & 2032
- Figure 96: South America Heparin Market Volume (K Unit), by Application 2024 & 2032
- Figure 97: South America Heparin Market Revenue Share (%), by Application 2024 & 2032
- Figure 98: South America Heparin Market Volume Share (%), by Application 2024 & 2032
- Figure 99: South America Heparin Market Revenue (Million), by Country 2024 & 2032
- Figure 100: South America Heparin Market Volume (K Unit), by Country 2024 & 2032
- Figure 101: South America Heparin Market Revenue Share (%), by Country 2024 & 2032
- Figure 102: South America Heparin Market Volume Share (%), by Country 2024 & 2032
List of Tables
- Table 1: Global Heparin Market Revenue Million Forecast, by Region 2019 & 2032
- Table 2: Global Heparin Market Volume K Unit Forecast, by Region 2019 & 2032
- Table 3: Global Heparin Market Revenue Million Forecast, by Product 2019 & 2032
- Table 4: Global Heparin Market Volume K Unit Forecast, by Product 2019 & 2032
- Table 5: Global Heparin Market Revenue Million Forecast, by Source 2019 & 2032
- Table 6: Global Heparin Market Volume K Unit Forecast, by Source 2019 & 2032
- Table 7: Global Heparin Market Revenue Million Forecast, by Application 2019 & 2032
- Table 8: Global Heparin Market Volume K Unit Forecast, by Application 2019 & 2032
- Table 9: Global Heparin Market Revenue Million Forecast, by Region 2019 & 2032
- Table 10: Global Heparin Market Volume K Unit Forecast, by Region 2019 & 2032
- Table 11: Global Heparin Market Revenue Million Forecast, by Country 2019 & 2032
- Table 12: Global Heparin Market Volume K Unit Forecast, by Country 2019 & 2032
- Table 13: Global Heparin Market Revenue Million Forecast, by Country 2019 & 2032
- Table 14: Global Heparin Market Volume K Unit Forecast, by Country 2019 & 2032
- Table 15: Global Heparin Market Revenue Million Forecast, by Country 2019 & 2032
- Table 16: Global Heparin Market Volume K Unit Forecast, by Country 2019 & 2032
- Table 17: Global Heparin Market Revenue Million Forecast, by Country 2019 & 2032
- Table 18: Global Heparin Market Volume K Unit Forecast, by Country 2019 & 2032
- Table 19: Global Heparin Market Revenue Million Forecast, by Country 2019 & 2032
- Table 20: Global Heparin Market Volume K Unit Forecast, by Country 2019 & 2032
- Table 21: Global Heparin Market Revenue Million Forecast, by Product 2019 & 2032
- Table 22: Global Heparin Market Volume K Unit Forecast, by Product 2019 & 2032
- Table 23: Global Heparin Market Revenue Million Forecast, by Source 2019 & 2032
- Table 24: Global Heparin Market Volume K Unit Forecast, by Source 2019 & 2032
- Table 25: Global Heparin Market Revenue Million Forecast, by Application 2019 & 2032
- Table 26: Global Heparin Market Volume K Unit Forecast, by Application 2019 & 2032
- Table 27: Global Heparin Market Revenue Million Forecast, by Country 2019 & 2032
- Table 28: Global Heparin Market Volume K Unit Forecast, by Country 2019 & 2032
- Table 29: United States Heparin Market Revenue (Million) Forecast, by Application 2019 & 2032
- Table 30: United States Heparin Market Volume (K Unit) Forecast, by Application 2019 & 2032
- Table 31: Canada Heparin Market Revenue (Million) Forecast, by Application 2019 & 2032
- Table 32: Canada Heparin Market Volume (K Unit) Forecast, by Application 2019 & 2032
- Table 33: Mexico Heparin Market Revenue (Million) Forecast, by Application 2019 & 2032
- Table 34: Mexico Heparin Market Volume (K Unit) Forecast, by Application 2019 & 2032
- Table 35: Global Heparin Market Revenue Million Forecast, by Product 2019 & 2032
- Table 36: Global Heparin Market Volume K Unit Forecast, by Product 2019 & 2032
- Table 37: Global Heparin Market Revenue Million Forecast, by Source 2019 & 2032
- Table 38: Global Heparin Market Volume K Unit Forecast, by Source 2019 & 2032
- Table 39: Global Heparin Market Revenue Million Forecast, by Application 2019 & 2032
- Table 40: Global Heparin Market Volume K Unit Forecast, by Application 2019 & 2032
- Table 41: Global Heparin Market Revenue Million Forecast, by Country 2019 & 2032
- Table 42: Global Heparin Market Volume K Unit Forecast, by Country 2019 & 2032
- Table 43: Germany Heparin Market Revenue (Million) Forecast, by Application 2019 & 2032
- Table 44: Germany Heparin Market Volume (K Unit) Forecast, by Application 2019 & 2032
- Table 45: United Kingdom Heparin Market Revenue (Million) Forecast, by Application 2019 & 2032
- Table 46: United Kingdom Heparin Market Volume (K Unit) Forecast, by Application 2019 & 2032
- Table 47: France Heparin Market Revenue (Million) Forecast, by Application 2019 & 2032
- Table 48: France Heparin Market Volume (K Unit) Forecast, by Application 2019 & 2032
- Table 49: Italy Heparin Market Revenue (Million) Forecast, by Application 2019 & 2032
- Table 50: Italy Heparin Market Volume (K Unit) Forecast, by Application 2019 & 2032
- Table 51: Spain Heparin Market Revenue (Million) Forecast, by Application 2019 & 2032
- Table 52: Spain Heparin Market Volume (K Unit) Forecast, by Application 2019 & 2032
- Table 53: Rest of Europe Heparin Market Revenue (Million) Forecast, by Application 2019 & 2032
- Table 54: Rest of Europe Heparin Market Volume (K Unit) Forecast, by Application 2019 & 2032
- Table 55: Global Heparin Market Revenue Million Forecast, by Product 2019 & 2032
- Table 56: Global Heparin Market Volume K Unit Forecast, by Product 2019 & 2032
- Table 57: Global Heparin Market Revenue Million Forecast, by Source 2019 & 2032
- Table 58: Global Heparin Market Volume K Unit Forecast, by Source 2019 & 2032
- Table 59: Global Heparin Market Revenue Million Forecast, by Application 2019 & 2032
- Table 60: Global Heparin Market Volume K Unit Forecast, by Application 2019 & 2032
- Table 61: Global Heparin Market Revenue Million Forecast, by Country 2019 & 2032
- Table 62: Global Heparin Market Volume K Unit Forecast, by Country 2019 & 2032
- Table 63: China Heparin Market Revenue (Million) Forecast, by Application 2019 & 2032
- Table 64: China Heparin Market Volume (K Unit) Forecast, by Application 2019 & 2032
- Table 65: Japan Heparin Market Revenue (Million) Forecast, by Application 2019 & 2032
- Table 66: Japan Heparin Market Volume (K Unit) Forecast, by Application 2019 & 2032
- Table 67: India Heparin Market Revenue (Million) Forecast, by Application 2019 & 2032
- Table 68: India Heparin Market Volume (K Unit) Forecast, by Application 2019 & 2032
- Table 69: Australia Heparin Market Revenue (Million) Forecast, by Application 2019 & 2032
- Table 70: Australia Heparin Market Volume (K Unit) Forecast, by Application 2019 & 2032
- Table 71: South Korea Heparin Market Revenue (Million) Forecast, by Application 2019 & 2032
- Table 72: South Korea Heparin Market Volume (K Unit) Forecast, by Application 2019 & 2032
- Table 73: Rest of Asia Pacific Heparin Market Revenue (Million) Forecast, by Application 2019 & 2032
- Table 74: Rest of Asia Pacific Heparin Market Volume (K Unit) Forecast, by Application 2019 & 2032
- Table 75: Global Heparin Market Revenue Million Forecast, by Product 2019 & 2032
- Table 76: Global Heparin Market Volume K Unit Forecast, by Product 2019 & 2032
- Table 77: Global Heparin Market Revenue Million Forecast, by Source 2019 & 2032
- Table 78: Global Heparin Market Volume K Unit Forecast, by Source 2019 & 2032
- Table 79: Global Heparin Market Revenue Million Forecast, by Application 2019 & 2032
- Table 80: Global Heparin Market Volume K Unit Forecast, by Application 2019 & 2032
- Table 81: Global Heparin Market Revenue Million Forecast, by Country 2019 & 2032
- Table 82: Global Heparin Market Volume K Unit Forecast, by Country 2019 & 2032
- Table 83: GCC Heparin Market Revenue (Million) Forecast, by Application 2019 & 2032
- Table 84: GCC Heparin Market Volume (K Unit) Forecast, by Application 2019 & 2032
- Table 85: South Africa Heparin Market Revenue (Million) Forecast, by Application 2019 & 2032
- Table 86: South Africa Heparin Market Volume (K Unit) Forecast, by Application 2019 & 2032
- Table 87: Rest of Middle East and Africa Heparin Market Revenue (Million) Forecast, by Application 2019 & 2032
- Table 88: Rest of Middle East and Africa Heparin Market Volume (K Unit) Forecast, by Application 2019 & 2032
- Table 89: Global Heparin Market Revenue Million Forecast, by Product 2019 & 2032
- Table 90: Global Heparin Market Volume K Unit Forecast, by Product 2019 & 2032
- Table 91: Global Heparin Market Revenue Million Forecast, by Source 2019 & 2032
- Table 92: Global Heparin Market Volume K Unit Forecast, by Source 2019 & 2032
- Table 93: Global Heparin Market Revenue Million Forecast, by Application 2019 & 2032
- Table 94: Global Heparin Market Volume K Unit Forecast, by Application 2019 & 2032
- Table 95: Global Heparin Market Revenue Million Forecast, by Country 2019 & 2032
- Table 96: Global Heparin Market Volume K Unit Forecast, by Country 2019 & 2032
- Table 97: Brazil Heparin Market Revenue (Million) Forecast, by Application 2019 & 2032
- Table 98: Brazil Heparin Market Volume (K Unit) Forecast, by Application 2019 & 2032
- Table 99: Argentina Heparin Market Revenue (Million) Forecast, by Application 2019 & 2032
- Table 100: Argentina Heparin Market Volume (K Unit) Forecast, by Application 2019 & 2032
- Table 101: Rest of South America Heparin Market Revenue (Million) Forecast, by Application 2019 & 2032
- Table 102: Rest of South America Heparin Market Volume (K Unit) Forecast, by Application 2019 & 2032
Frequently Asked Questions
1. What is the projected Compound Annual Growth Rate (CAGR) of the Heparin Market?
The projected CAGR is approximately 7.12%.
2. Which companies are prominent players in the Heparin Market?
Key companies in the market include Aspen Pharmacare Holdings Limited, Novartis AG, Viatris Inc, Dr Reddy's Laboratories, FRESENIUS KABI, Leo Pharma AS, HIKMA PHARMACEUTICALS, Opocrin SpA, GLAND PHARMA, Techdow USA, Smiths Medical, B Braun Melsungen AG, Hebei Changshan Biochemical Pharmaceutical, Baxter International Inc, Pfizer Inc.
3. What are the main segments of the Heparin Market?
The market segments include Product, Source, Application.
4. Can you provide details about the market size?
The market size is estimated to be USD 9.37 Million as of 2022.
5. What are some drivers contributing to market growth?
Increasing Prevalence of Chronic Diseases; Rise in Geriatric Population.
6. What are the notable trends driving market growth?
Low Molecular Weight Heparin (LMWH) is Expected to Hold a Significant Share in the Heparin Market During the Forecast Period.
7. Are there any restraints impacting market growth?
Side Effects of Heparin and Emergence of Oral Coagulants.
8. Can you provide examples of recent developments in the market?
February 2022 : Techdow USA Inc. launched Heparin Sodium Injection in the United States market.
9. What pricing options are available for accessing the report?
Pricing options include single-user, multi-user, and enterprise licenses priced at USD 4750, USD 5250, and USD 8750 respectively.
10. Is the market size provided in terms of value or volume?
The market size is provided in terms of value, measured in Million and volume, measured in K Unit.
11. Are there any specific market keywords associated with the report?
Yes, the market keyword associated with the report is "Heparin Market," which aids in identifying and referencing the specific market segment covered.
12. How do I determine which pricing option suits my needs best?
The pricing options vary based on user requirements and access needs. Individual users may opt for single-user licenses, while businesses requiring broader access may choose multi-user or enterprise licenses for cost-effective access to the report.
13. Are there any additional resources or data provided in the Heparin Market report?
While the report offers comprehensive insights, it's advisable to review the specific contents or supplementary materials provided to ascertain if additional resources or data are available.
14. How can I stay updated on further developments or reports in the Heparin Market?
To stay informed about further developments, trends, and reports in the Heparin Market, consider subscribing to industry newsletters, following relevant companies and organizations, or regularly checking reputable industry news sources and publications.
Methodology
Step 1 - Identification of Relevant Samples Size from Population Database


Step 2 - Approaches for Defining Global Market Size (Value, Volume* & Price*)

Note*: In applicable scenarios
Step 3 - Data Sources
Primary Research
- Web Analytics
- Survey Reports
- Research Institute
- Latest Research Reports
- Opinion Leaders
Secondary Research
- Annual Reports
- White Paper
- Latest Press Release
- Industry Association
- Paid Database
- Investor Presentations

Step 4 - Data Triangulation
Involves using different sources of information in order to increase the validity of a study
These sources are likely to be stakeholders in a program - participants, other researchers, program staff, other community members, and so on.
Then we put all data in single framework & apply various statistical tools to find out the dynamic on the market.
During the analysis stage, feedback from the stakeholder groups would be compared to determine areas of agreement as well as areas of divergence


