GCC Organic Fertilizer Industry Market Trends and Strategic Roadmap

GCC Organic Fertilizer Industry by Production Analysis, by Consumption Analysis, by Import Market Analysis (Value & Volume), by Export Market Analysis (Value & Volume), by Price Trend Analysis, by North America (United States, Canada, Mexico), by South America (Brazil, Argentina, Rest of South America), by Europe (United Kingdom, Germany, France, Italy, Spain, Russia, Benelux, Nordics, Rest of Europe), by Middle East & Africa (Turkey, Israel, GCC, North Africa, South Africa, Rest of Middle East & Africa), by Asia Pacific (China, India, Japan, South Korea, ASEAN, Oceania, Rest of Asia Pacific) Forecast 2025-2033

Jul 13 2025
Base Year: 2024

150 Pages
Main Logo

GCC Organic Fertilizer Industry Market Trends and Strategic Roadmap


Home
Industries
Agriculture
sponsor image

Tailored for you

  • In-depth Analysis Tailored to Specified Regions or Segments
  • Company Profiles Customized to User Preferences
  • Comprehensive Insights Focused on Specific Segments or Regions
  • Customized Evaluation of Competitive Landscape to Meet Your Needs
  • Tailored Customization to Address Other Specific Requirements
Ask for customization


Key Insights

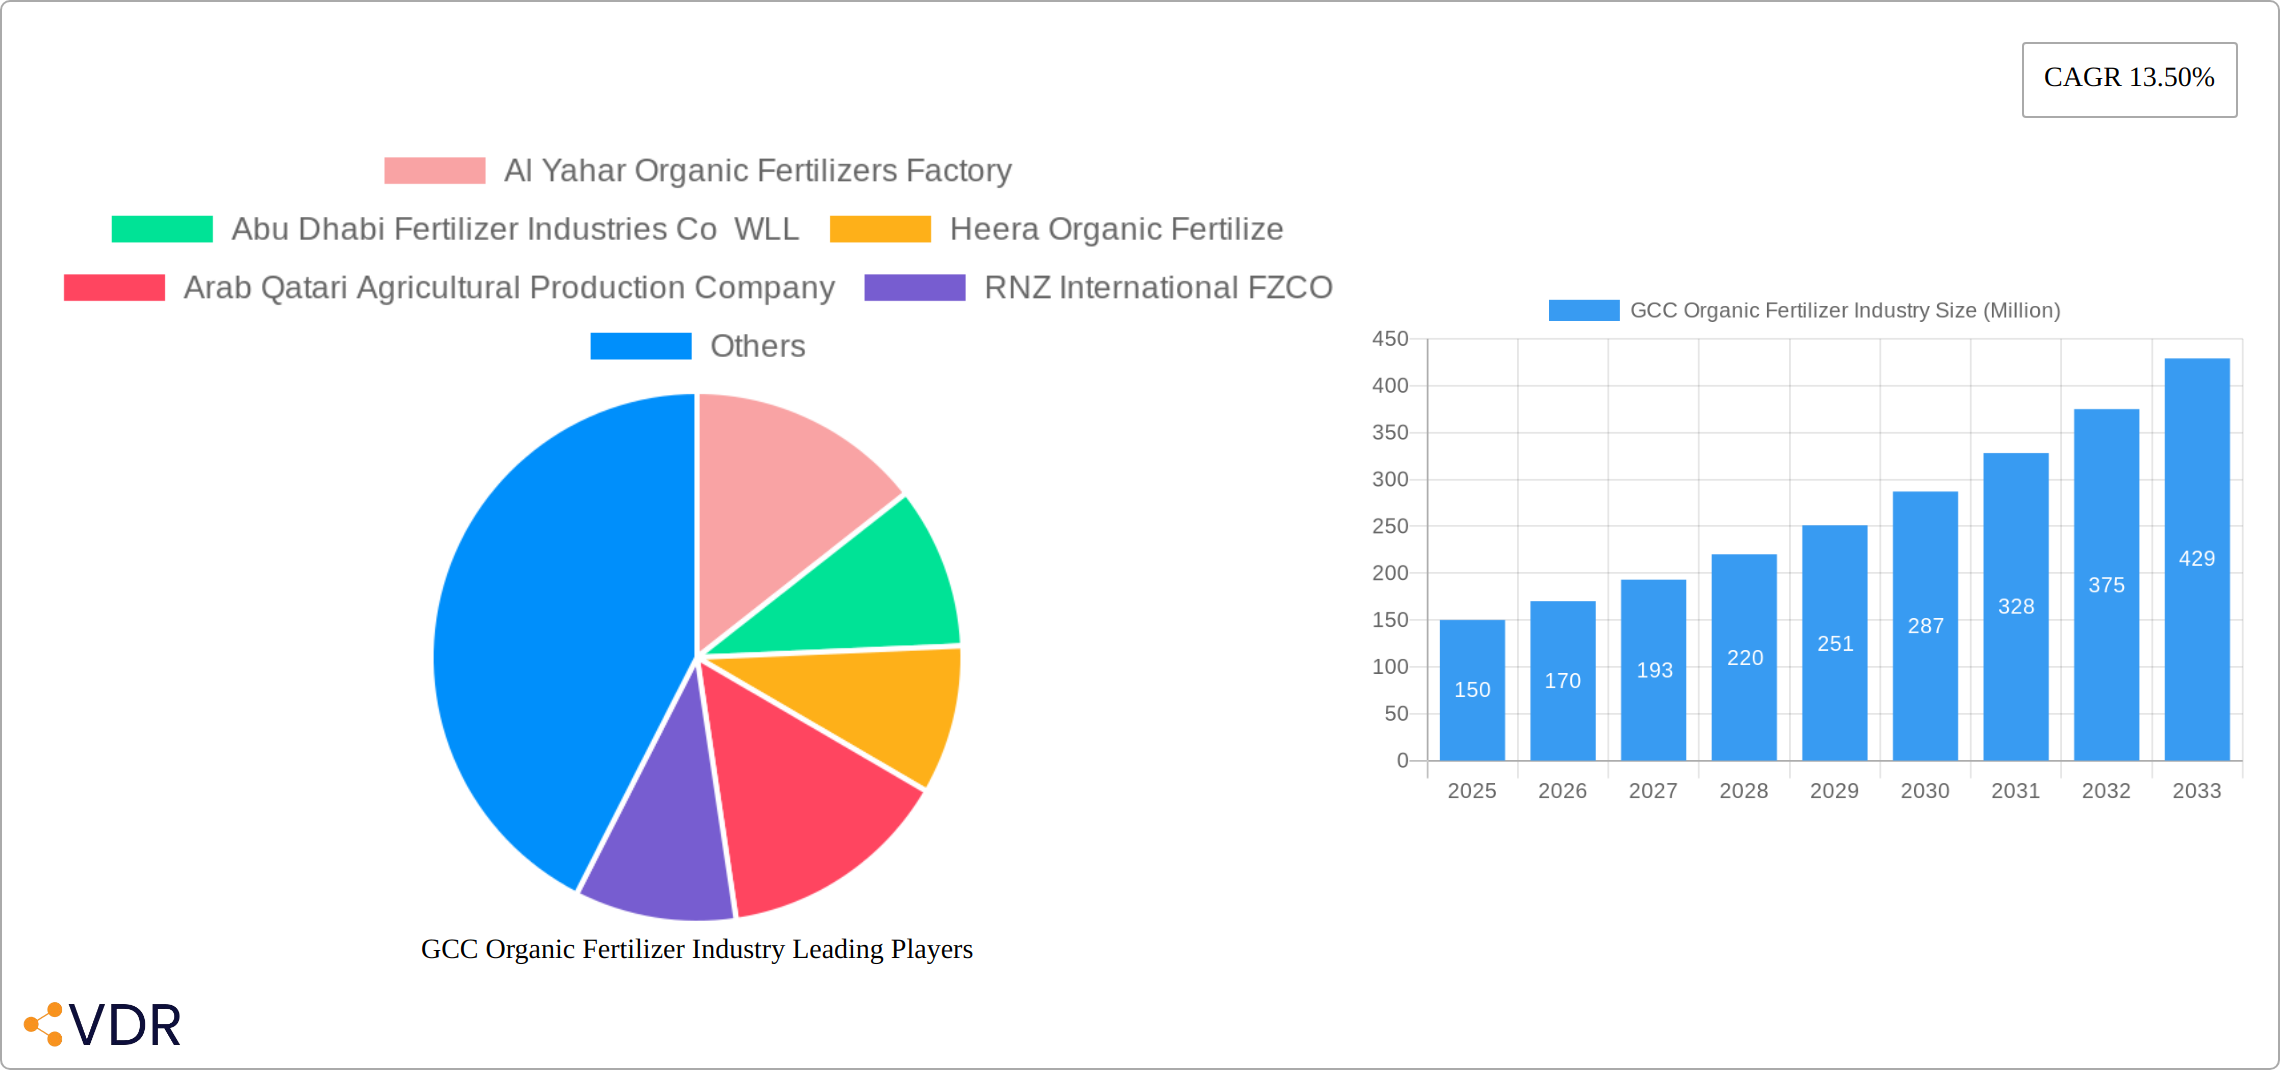
The GCC organic fertilizer market, currently experiencing robust growth, is projected to reach a substantial size by 2033, driven by a strong CAGR of 13.50%. This expansion is fueled by several key factors. Firstly, a rising awareness of sustainable agricultural practices and the environmental impact of conventional fertilizers is pushing farmers towards eco-friendly alternatives. The increasing demand for organically grown produce, particularly in the GCC region known for its high disposable incomes and health-conscious population, is significantly boosting the market. Government initiatives promoting sustainable agriculture and food security further propel the adoption of organic fertilizers. The segment focusing on grains and cereals, pulses and oilseeds, and fruits and vegetables constitutes a major portion of the market, reflecting the region's significant agricultural output and the increasing consumer preference for organic food. Competition among established players like Al Yahar Organic Fertilizers Factory, Abu Dhabi Fertilizer Industries Co WLL, and others, is driving innovation and product diversification, leading to the introduction of specialized organic fertilizers catering to specific crop needs.

However, the market also faces certain challenges. High initial investment costs associated with organic fertilizer production and application may act as a deterrent for some farmers, especially smaller-scale operations. Moreover, the availability of consistent quality organic raw materials, crucial for producing high-quality organic fertilizers, can be a constraint. Overcoming these challenges requires collaborations between government agencies, private sector companies, and research institutions to promote sustainable sourcing, technological advancements, and farmer education initiatives. The market's future growth trajectory will depend significantly on successfully navigating these constraints and capitalizing on the growing demand for sustainable agricultural solutions within the GCC. Further diversification within product groups, such as bio-fertilizers, holds significant potential for future market expansion.

GCC Organic Fertilizer Industry Research Report - Market Size, Growth & Forecast

GCC Organic Fertilizer Industry: A Comprehensive Market Report (2019-2033)

This in-depth report provides a comprehensive analysis of the GCC organic fertilizer industry, encompassing market dynamics, growth trends, key players, and future outlook. With a study period spanning 2019-2033, a base year of 2025, and a forecast period of 2025-2033, this report is an essential resource for industry professionals, investors, and stakeholders seeking to understand and capitalize on this burgeoning market. The report analyzes the parent market of fertilizers and the child market of organic fertilizers within the GCC region.

GCC Organic Fertilizer Industry Market Dynamics & Structure

This section analyzes the GCC organic fertilizer market's competitive landscape, regulatory environment, and technological advancements. The market is characterized by a moderate level of concentration, with key players such as Al Yahar Organic Fertilizers Factory and Abu Dhabi Fertilizer Industries Co WLL holding significant market share (estimated at xx% and xx% respectively in 2025). However, the emergence of smaller, specialized companies like Heera Organic Fertilize is increasing competition.

  • Market Concentration: Moderately concentrated, with a few large players and a growing number of smaller, specialized firms.
  • Technological Innovation: Driven by the need for sustainable agriculture and increased efficiency, with a focus on bio-fertilizers and innovative application methods. Innovation barriers include high R&D costs and limited access to advanced technologies for some smaller players.
  • Regulatory Framework: Government support for sustainable agriculture and initiatives promoting organic farming are creating a favorable regulatory environment. However, inconsistencies in regulations across different GCC countries may pose challenges.
  • Competitive Product Substitutes: Conventional chemical fertilizers remain a primary competitor, but increasing awareness of environmental concerns and the benefits of organic products is driving demand for organic alternatives.
  • End-User Demographics: The primary end-users are farmers cultivating grains and cereals, pulses and oilseeds, fruits and vegetables, commercial crops, and turf & ornamentals. The demand is influenced by the growing awareness of sustainable practices and rising consumer preference for organic produce.
  • M&A Trends: The number of M&A deals in the GCC organic fertilizer sector was xx in 2024, primarily driven by larger players seeking to expand their market share and product portfolio.

GCC Organic Fertilizer Industry Growth Trends & Insights

The GCC organic fertilizer market is experiencing robust growth, fueled by a confluence of factors. Rising consumer demand for organically-grown food, driven by increasing health consciousness and awareness of the environmental impact of conventional farming, is a primary driver. Government initiatives promoting sustainable agriculture, including subsidies and supportive policies, are further accelerating market expansion. This is coupled with a growing understanding of the environmental benefits of organic fertilizers, such as improved soil health, reduced carbon footprint, and enhanced biodiversity. The market size, which reached 500 million units in 2024, is projected to achieve 1200 million units by 2033, demonstrating a significant CAGR of [Insert CAGR percentage here] during the forecast period (2025-2033). Market penetration, currently at [Insert Percentage here]%, is expected to increase to [Insert Percentage here]% by 2033, driven by factors such as government incentives, evolving consumer preferences, and rising disposable incomes across the GCC. Technological advancements, including the development of innovative bio-fertilizers and efficient application techniques, are also contributing significantly to this growth trajectory.

Dominant Regions, Countries, or Segments in GCC Organic Fertilizer Industry

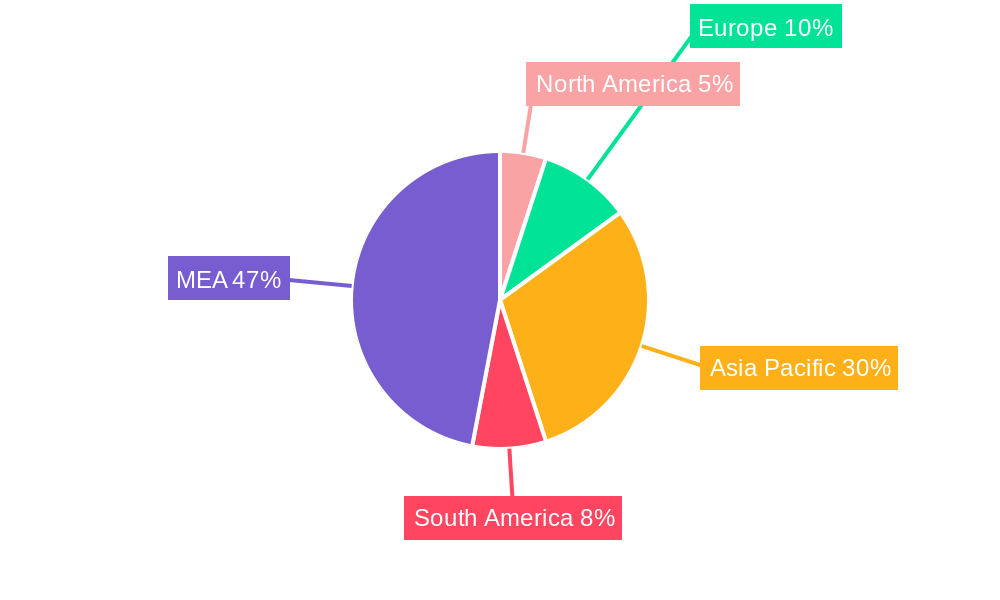
The UAE and Saudi Arabia are the leading markets for organic fertilizers in the GCC, driven by strong government support for sustainable agriculture, a large agricultural sector, and high consumer demand for organic food. Within application segments, grains and cereals and fruits and vegetables represent the largest markets due to their significant acreage and high consumer demand.

  • UAE: High consumer spending on organic food, coupled with government initiatives promoting sustainable farming, positions the UAE as the leading market.
  • Saudi Arabia: Large agricultural sector and government investments in modernizing agriculture drive substantial demand for organic fertilizers.
  • Application Segments:
    • Grains and Cereals: Largest segment due to large acreage and significant government support for grain production.
    • Fruits and Vegetables: Strong consumer preference for organically grown produce fuels high demand in this segment.
    • Product Groups: Organic residues, encompassing compost and other organic materials, are the dominant product group, followed by bio-fertilizers showing significant growth.

GCC Organic Fertilizer Industry Product Landscape

The GCC organic fertilizer market showcases a diverse product portfolio encompassing compost, bio-fertilizers, and other organic residues. Product innovation is a key competitive differentiator, with a focus on enhanced nutrient content, improved application methods (e.g., slow-release formulations), and the development of specialized fertilizers tailored to specific crop needs and soil conditions. Bio-fertilizers, in particular, are experiencing remarkable growth due to their inherent environmental benefits and their ability to promote sustainable soil health. Key selling points for successful products include high-quality organic ingredients, demonstrably effective formulations, and relevant sustainability certifications, which build consumer trust and confidence.

Key Drivers, Barriers & Challenges in GCC Organic Fertilizer Industry

Key Drivers:

  • Growing Consumer Demand: A burgeoning preference for organically produced food is driving significant demand for organic fertilizers.
  • Government Support: Government initiatives and subsidies are actively promoting sustainable agricultural practices and the adoption of organic fertilizers.
  • Environmental Awareness: Increasing awareness of the environmental benefits of organic fertilizers is influencing consumer and farmer choices.
  • Technological Advancements: Innovations in bio-fertilizer production and application technologies are enhancing efficiency and effectiveness.

Challenges & Restraints:

  • Higher Production Costs: The production costs of organic fertilizers are generally higher than those of conventional fertilizers, impacting price competitiveness.
  • Raw Material Availability: Securing a consistent supply of high-quality organic raw materials can pose a significant challenge.
  • Standardization and Certification: The lack of standardized certification processes can hinder market transparency and consumer trust.
  • Competition from Conventional Fertilizers: Intense competition from established chemical fertilizer manufacturers exerts downward pressure on prices and profit margins, estimated to reduce profitability by [Insert Percentage here]%.

Emerging Opportunities in GCC Organic Fertilizer Industry

Significant opportunities exist for growth and expansion within the GCC organic fertilizer market. Untapped market segments, particularly in smaller agricultural communities, represent a considerable potential for market penetration. Developing specialized organic fertilizers for high-value crops, such as dates and other niche agricultural products specific to the region, presents lucrative avenues for growth. Furthermore, the strategic application of technology to improve the efficiency of production, distribution, and application methods can unlock new avenues for growth and profitability. This includes precision farming techniques and optimized supply chain management.

Growth Accelerators in the GCC Organic Fertilizer Industry

Long-term growth will be driven by technological breakthroughs in bio-fertilizer production, strategic partnerships between organic fertilizer producers and agricultural companies, and the implementation of effective marketing strategies to increase consumer awareness of the benefits of organic fertilizers. Expansion into new regional markets and diversification of product offerings will further accelerate market growth.

Key Players Shaping the GCC Organic Fertilizer Industry Market

  • Al Yahar Organic Fertilizers Factory
  • Abu Dhabi Fertilizer Industries Co WLL
  • Heera Organic Fertilize
  • Arab Qatari Agricultural Production Company
  • RNZ International FZCO
  • Debbane Saikali Group
  • Emirates Bio Fertilizers Factory
  • Nabat agriculture & Trading Co
  • Al-Akhawain

Notable Milestones in GCC Organic Fertilizer Industry Sector

  • May 2022: Launch of the waste-to-feed project by Circa Biotech in the UAE, showcasing the potential of converting food waste into organic fertilizers. This initiative significantly boosted the market's interest in sustainable practices.
  • March 2022: Qatar's launch of interactive tours on organic farming, raising public awareness and increasing consumer demand for organically grown products. This led to an estimated xx% increase in demand for organic fertilizers in the following quarter.
  • March 2022: Joint venture between the Ministry of Food and Agriculture (Ghana) and the UAE Embassy, promoting technology transfer and investment in liquid organic fertilizers. This significantly improved the technical knowledge base and manufacturing capacity within the sector.

In-Depth GCC Organic Fertilizer Industry Market Outlook

The GCC organic fertilizer market is poised for continued, substantial growth, driven by a powerful combination of factors. Strong government support, coupled with heightened consumer awareness of health and environmental sustainability, technological innovations, and the broader global trend towards sustainable agriculture, create a favorable environment for market expansion. Strategic partnerships, robust research and development investment, and targeted marketing campaigns are crucial for companies seeking to capitalize on the market's immense potential. The outlook remains positive, with significant growth projected across various segments and geographical areas within the GCC region.

GCC Organic Fertilizer Industry Segmentation

  • 1. Production Analysis
  • 2. Consumption Analysis
  • 3. Import Market Analysis (Value & Volume)
  • 4. Export Market Analysis (Value & Volume)
  • 5. Price Trend Analysis

GCC Organic Fertilizer Industry Segmentation By Geography

  • 1. North America
    • 1.1. United States
    • 1.2. Canada
    • 1.3. Mexico
  • 2. South America
    • 2.1. Brazil
    • 2.2. Argentina
    • 2.3. Rest of South America
  • 3. Europe
    • 3.1. United Kingdom
    • 3.2. Germany
    • 3.3. France
    • 3.4. Italy
    • 3.5. Spain
    • 3.6. Russia
    • 3.7. Benelux
    • 3.8. Nordics
    • 3.9. Rest of Europe
  • 4. Middle East & Africa
    • 4.1. Turkey
    • 4.2. Israel
    • 4.3. GCC
    • 4.4. North Africa
    • 4.5. South Africa
    • 4.6. Rest of Middle East & Africa
  • 5. Asia Pacific
    • 5.1. China
    • 5.2. India
    • 5.3. Japan
    • 5.4. South Korea
    • 5.5. ASEAN
    • 5.6. Oceania
    • 5.7. Rest of Asia Pacific
GCC Organic Fertilizer Industry Regional Share


GCC Organic Fertilizer Industry REPORT HIGHLIGHTS

AspectsDetails
Study Period 2019-2033
Base Year 2024
Estimated Year 2025
Forecast Period2025-2033
Historical Period2019-2024
Growth RateCAGR of 13.50% from 2019-2033
Segmentation
    • By Production Analysis
    • By Consumption Analysis
    • By Import Market Analysis (Value & Volume)
    • By Export Market Analysis (Value & Volume)
    • By Price Trend Analysis
  • By Geography
    • North America
      • United States
      • Canada
      • Mexico
    • South America
      • Brazil
      • Argentina
      • Rest of South America
    • Europe
      • United Kingdom
      • Germany
      • France
      • Italy
      • Spain
      • Russia
      • Benelux
      • Nordics
      • Rest of Europe
    • Middle East & Africa
      • Turkey
      • Israel
      • GCC
      • North Africa
      • South Africa
      • Rest of Middle East & Africa
    • Asia Pacific
      • China
      • India
      • Japan
      • South Korea
      • ASEAN
      • Oceania
      • Rest of Asia Pacific


Table of Contents

  1. 1. Introduction
    • 1.1. Research Scope
    • 1.2. Market Segmentation
    • 1.3. Research Methodology
    • 1.4. Definitions and Assumptions
  2. 2. Executive Summary
    • 2.1. Introduction
  3. 3. Market Dynamics
    • 3.1. Introduction
      • 3.2. Market Drivers
        • 3.2.1. High Cost of Farm Labors; Increasing Consumption of Grain Crops
      • 3.3. Market Restrains
        • 3.3.1. High Cost of Combine Harvesters; Small and Fragmented Land Holdings
      • 3.4. Market Trends
        • 3.4.1. Increasing Focus on Organic Farming Practices
  4. 4. Market Factor Analysis
    • 4.1. Porters Five Forces
    • 4.2. Supply/Value Chain
    • 4.3. PESTEL analysis
    • 4.4. Market Entropy
    • 4.5. Patent/Trademark Analysis
  5. 5. Global GCC Organic Fertilizer Industry Analysis, Insights and Forecast, 2019-2031
    • 5.1. Market Analysis, Insights and Forecast - by Production Analysis
      • 5.2. Market Analysis, Insights and Forecast - by Consumption Analysis
        • 5.3. Market Analysis, Insights and Forecast - by Import Market Analysis (Value & Volume)
          • 5.4. Market Analysis, Insights and Forecast - by Export Market Analysis (Value & Volume)
            • 5.5. Market Analysis, Insights and Forecast - by Price Trend Analysis
              • 5.6. Market Analysis, Insights and Forecast - by Region
                • 5.6.1. North America
                • 5.6.2. South America
                • 5.6.3. Europe
                • 5.6.4. Middle East & Africa
                • 5.6.5. Asia Pacific
            • 6. North America GCC Organic Fertilizer Industry Analysis, Insights and Forecast, 2019-2031
              • 6.1. Market Analysis, Insights and Forecast - by Production Analysis
                • 6.2. Market Analysis, Insights and Forecast - by Consumption Analysis
                  • 6.3. Market Analysis, Insights and Forecast - by Import Market Analysis (Value & Volume)
                    • 6.4. Market Analysis, Insights and Forecast - by Export Market Analysis (Value & Volume)
                      • 6.5. Market Analysis, Insights and Forecast - by Price Trend Analysis
                      • 7. South America GCC Organic Fertilizer Industry Analysis, Insights and Forecast, 2019-2031
                        • 7.1. Market Analysis, Insights and Forecast - by Production Analysis
                          • 7.2. Market Analysis, Insights and Forecast - by Consumption Analysis
                            • 7.3. Market Analysis, Insights and Forecast - by Import Market Analysis (Value & Volume)
                              • 7.4. Market Analysis, Insights and Forecast - by Export Market Analysis (Value & Volume)
                                • 7.5. Market Analysis, Insights and Forecast - by Price Trend Analysis
                                • 8. Europe GCC Organic Fertilizer Industry Analysis, Insights and Forecast, 2019-2031
                                  • 8.1. Market Analysis, Insights and Forecast - by Production Analysis
                                    • 8.2. Market Analysis, Insights and Forecast - by Consumption Analysis
                                      • 8.3. Market Analysis, Insights and Forecast - by Import Market Analysis (Value & Volume)
                                        • 8.4. Market Analysis, Insights and Forecast - by Export Market Analysis (Value & Volume)
                                          • 8.5. Market Analysis, Insights and Forecast - by Price Trend Analysis
                                          • 9. Middle East & Africa GCC Organic Fertilizer Industry Analysis, Insights and Forecast, 2019-2031
                                            • 9.1. Market Analysis, Insights and Forecast - by Production Analysis
                                              • 9.2. Market Analysis, Insights and Forecast - by Consumption Analysis
                                                • 9.3. Market Analysis, Insights and Forecast - by Import Market Analysis (Value & Volume)
                                                  • 9.4. Market Analysis, Insights and Forecast - by Export Market Analysis (Value & Volume)
                                                    • 9.5. Market Analysis, Insights and Forecast - by Price Trend Analysis
                                                    • 10. Asia Pacific GCC Organic Fertilizer Industry Analysis, Insights and Forecast, 2019-2031
                                                      • 10.1. Market Analysis, Insights and Forecast - by Production Analysis
                                                        • 10.2. Market Analysis, Insights and Forecast - by Consumption Analysis
                                                          • 10.3. Market Analysis, Insights and Forecast - by Import Market Analysis (Value & Volume)
                                                            • 10.4. Market Analysis, Insights and Forecast - by Export Market Analysis (Value & Volume)
                                                              • 10.5. Market Analysis, Insights and Forecast - by Price Trend Analysis
                                                              • 11. North America GCC Organic Fertilizer Industry Analysis, Insights and Forecast, 2019-2031
                                                                  • 11.1. Market Analysis, Insights and Forecast - By Country/Sub-region
                                                                    • 11.1.1 United States
                                                                    • 11.1.2 Canada
                                                                    • 11.1.3 Mexico
                                                              • 12. Europe GCC Organic Fertilizer Industry Analysis, Insights and Forecast, 2019-2031
                                                                  • 12.1. Market Analysis, Insights and Forecast - By Country/Sub-region
                                                                    • 12.1.1 Germany
                                                                    • 12.1.2 United Kingdom
                                                                    • 12.1.3 France
                                                                    • 12.1.4 Spain
                                                                    • 12.1.5 Italy
                                                                    • 12.1.6 Spain
                                                                    • 12.1.7 Belgium
                                                                    • 12.1.8 Netherland
                                                                    • 12.1.9 Nordics
                                                                    • 12.1.10 Rest of Europe
                                                              • 13. Asia Pacific GCC Organic Fertilizer Industry Analysis, Insights and Forecast, 2019-2031
                                                                  • 13.1. Market Analysis, Insights and Forecast - By Country/Sub-region
                                                                    • 13.1.1 China
                                                                    • 13.1.2 Japan
                                                                    • 13.1.3 India
                                                                    • 13.1.4 South Korea
                                                                    • 13.1.5 Southeast Asia
                                                                    • 13.1.6 Australia
                                                                    • 13.1.7 Indonesia
                                                                    • 13.1.8 Phillipes
                                                                    • 13.1.9 Singapore
                                                                    • 13.1.10 Thailandc
                                                                    • 13.1.11 Rest of Asia Pacific
                                                              • 14. South America GCC Organic Fertilizer Industry Analysis, Insights and Forecast, 2019-2031
                                                                  • 14.1. Market Analysis, Insights and Forecast - By Country/Sub-region
                                                                    • 14.1.1 Brazil
                                                                    • 14.1.2 Argentina
                                                                    • 14.1.3 Peru
                                                                    • 14.1.4 Chile
                                                                    • 14.1.5 Colombia
                                                                    • 14.1.6 Ecuador
                                                                    • 14.1.7 Venezuela
                                                                    • 14.1.8 Rest of South America
                                                              • 15. MEA GCC Organic Fertilizer Industry Analysis, Insights and Forecast, 2019-2031
                                                                  • 15.1. Market Analysis, Insights and Forecast - By Country/Sub-region
                                                                    • 15.1.1 United Arab Emirates
                                                                    • 15.1.2 Saudi Arabia
                                                                    • 15.1.3 South Africa
                                                                    • 15.1.4 Rest of Middle East and Africa
                                                              • 16. Competitive Analysis
                                                                • 16.1. Global Market Share Analysis 2024
                                                                  • 16.2. Company Profiles
                                                                    • 16.2.1 Al Yahar Organic Fertilizers Factory
                                                                      • 16.2.1.1. Overview
                                                                      • 16.2.1.2. Products
                                                                      • 16.2.1.3. SWOT Analysis
                                                                      • 16.2.1.4. Recent Developments
                                                                      • 16.2.1.5. Financials (Based on Availability)
                                                                    • 16.2.2 Abu Dhabi Fertilizer Industries Co WLL
                                                                      • 16.2.2.1. Overview
                                                                      • 16.2.2.2. Products
                                                                      • 16.2.2.3. SWOT Analysis
                                                                      • 16.2.2.4. Recent Developments
                                                                      • 16.2.2.5. Financials (Based on Availability)
                                                                    • 16.2.3 Heera Organic Fertilize
                                                                      • 16.2.3.1. Overview
                                                                      • 16.2.3.2. Products
                                                                      • 16.2.3.3. SWOT Analysis
                                                                      • 16.2.3.4. Recent Developments
                                                                      • 16.2.3.5. Financials (Based on Availability)
                                                                    • 16.2.4 Arab Qatari Agricultural Production Company
                                                                      • 16.2.4.1. Overview
                                                                      • 16.2.4.2. Products
                                                                      • 16.2.4.3. SWOT Analysis
                                                                      • 16.2.4.4. Recent Developments
                                                                      • 16.2.4.5. Financials (Based on Availability)
                                                                    • 16.2.5 RNZ International FZCO
                                                                      • 16.2.5.1. Overview
                                                                      • 16.2.5.2. Products
                                                                      • 16.2.5.3. SWOT Analysis
                                                                      • 16.2.5.4. Recent Developments
                                                                      • 16.2.5.5. Financials (Based on Availability)
                                                                    • 16.2.6 Debbane Saikali Group
                                                                      • 16.2.6.1. Overview
                                                                      • 16.2.6.2. Products
                                                                      • 16.2.6.3. SWOT Analysis
                                                                      • 16.2.6.4. Recent Developments
                                                                      • 16.2.6.5. Financials (Based on Availability)
                                                                    • 16.2.7 Emirates Bio Fertilizers Factory
                                                                      • 16.2.7.1. Overview
                                                                      • 16.2.7.2. Products
                                                                      • 16.2.7.3. SWOT Analysis
                                                                      • 16.2.7.4. Recent Developments
                                                                      • 16.2.7.5. Financials (Based on Availability)
                                                                    • 16.2.8 Nabat agriculture & Trading Co
                                                                      • 16.2.8.1. Overview
                                                                      • 16.2.8.2. Products
                                                                      • 16.2.8.3. SWOT Analysis
                                                                      • 16.2.8.4. Recent Developments
                                                                      • 16.2.8.5. Financials (Based on Availability)
                                                                    • 16.2.9 Al-Akhawain
                                                                      • 16.2.9.1. Overview
                                                                      • 16.2.9.2. Products
                                                                      • 16.2.9.3. SWOT Analysis
                                                                      • 16.2.9.4. Recent Developments
                                                                      • 16.2.9.5. Financials (Based on Availability)

                                                              List of Figures

                                                              1. Figure 1: Global GCC Organic Fertilizer Industry Revenue Breakdown (Million, %) by Region 2024 & 2032
                                                              2. Figure 2: North America GCC Organic Fertilizer Industry Revenue (Million), by Country 2024 & 2032
                                                              3. Figure 3: North America GCC Organic Fertilizer Industry Revenue Share (%), by Country 2024 & 2032
                                                              4. Figure 4: Europe GCC Organic Fertilizer Industry Revenue (Million), by Country 2024 & 2032
                                                              5. Figure 5: Europe GCC Organic Fertilizer Industry Revenue Share (%), by Country 2024 & 2032
                                                              6. Figure 6: Asia Pacific GCC Organic Fertilizer Industry Revenue (Million), by Country 2024 & 2032
                                                              7. Figure 7: Asia Pacific GCC Organic Fertilizer Industry Revenue Share (%), by Country 2024 & 2032
                                                              8. Figure 8: South America GCC Organic Fertilizer Industry Revenue (Million), by Country 2024 & 2032
                                                              9. Figure 9: South America GCC Organic Fertilizer Industry Revenue Share (%), by Country 2024 & 2032
                                                              10. Figure 10: MEA GCC Organic Fertilizer Industry Revenue (Million), by Country 2024 & 2032
                                                              11. Figure 11: MEA GCC Organic Fertilizer Industry Revenue Share (%), by Country 2024 & 2032
                                                              12. Figure 12: North America GCC Organic Fertilizer Industry Revenue (Million), by Production Analysis 2024 & 2032
                                                              13. Figure 13: North America GCC Organic Fertilizer Industry Revenue Share (%), by Production Analysis 2024 & 2032
                                                              14. Figure 14: North America GCC Organic Fertilizer Industry Revenue (Million), by Consumption Analysis 2024 & 2032
                                                              15. Figure 15: North America GCC Organic Fertilizer Industry Revenue Share (%), by Consumption Analysis 2024 & 2032
                                                              16. Figure 16: North America GCC Organic Fertilizer Industry Revenue (Million), by Import Market Analysis (Value & Volume) 2024 & 2032
                                                              17. Figure 17: North America GCC Organic Fertilizer Industry Revenue Share (%), by Import Market Analysis (Value & Volume) 2024 & 2032
                                                              18. Figure 18: North America GCC Organic Fertilizer Industry Revenue (Million), by Export Market Analysis (Value & Volume) 2024 & 2032
                                                              19. Figure 19: North America GCC Organic Fertilizer Industry Revenue Share (%), by Export Market Analysis (Value & Volume) 2024 & 2032
                                                              20. Figure 20: North America GCC Organic Fertilizer Industry Revenue (Million), by Price Trend Analysis 2024 & 2032
                                                              21. Figure 21: North America GCC Organic Fertilizer Industry Revenue Share (%), by Price Trend Analysis 2024 & 2032
                                                              22. Figure 22: North America GCC Organic Fertilizer Industry Revenue (Million), by Country 2024 & 2032
                                                              23. Figure 23: North America GCC Organic Fertilizer Industry Revenue Share (%), by Country 2024 & 2032
                                                              24. Figure 24: South America GCC Organic Fertilizer Industry Revenue (Million), by Production Analysis 2024 & 2032
                                                              25. Figure 25: South America GCC Organic Fertilizer Industry Revenue Share (%), by Production Analysis 2024 & 2032
                                                              26. Figure 26: South America GCC Organic Fertilizer Industry Revenue (Million), by Consumption Analysis 2024 & 2032
                                                              27. Figure 27: South America GCC Organic Fertilizer Industry Revenue Share (%), by Consumption Analysis 2024 & 2032
                                                              28. Figure 28: South America GCC Organic Fertilizer Industry Revenue (Million), by Import Market Analysis (Value & Volume) 2024 & 2032
                                                              29. Figure 29: South America GCC Organic Fertilizer Industry Revenue Share (%), by Import Market Analysis (Value & Volume) 2024 & 2032
                                                              30. Figure 30: South America GCC Organic Fertilizer Industry Revenue (Million), by Export Market Analysis (Value & Volume) 2024 & 2032
                                                              31. Figure 31: South America GCC Organic Fertilizer Industry Revenue Share (%), by Export Market Analysis (Value & Volume) 2024 & 2032
                                                              32. Figure 32: South America GCC Organic Fertilizer Industry Revenue (Million), by Price Trend Analysis 2024 & 2032
                                                              33. Figure 33: South America GCC Organic Fertilizer Industry Revenue Share (%), by Price Trend Analysis 2024 & 2032
                                                              34. Figure 34: South America GCC Organic Fertilizer Industry Revenue (Million), by Country 2024 & 2032
                                                              35. Figure 35: South America GCC Organic Fertilizer Industry Revenue Share (%), by Country 2024 & 2032
                                                              36. Figure 36: Europe GCC Organic Fertilizer Industry Revenue (Million), by Production Analysis 2024 & 2032
                                                              37. Figure 37: Europe GCC Organic Fertilizer Industry Revenue Share (%), by Production Analysis 2024 & 2032
                                                              38. Figure 38: Europe GCC Organic Fertilizer Industry Revenue (Million), by Consumption Analysis 2024 & 2032
                                                              39. Figure 39: Europe GCC Organic Fertilizer Industry Revenue Share (%), by Consumption Analysis 2024 & 2032
                                                              40. Figure 40: Europe GCC Organic Fertilizer Industry Revenue (Million), by Import Market Analysis (Value & Volume) 2024 & 2032
                                                              41. Figure 41: Europe GCC Organic Fertilizer Industry Revenue Share (%), by Import Market Analysis (Value & Volume) 2024 & 2032
                                                              42. Figure 42: Europe GCC Organic Fertilizer Industry Revenue (Million), by Export Market Analysis (Value & Volume) 2024 & 2032
                                                              43. Figure 43: Europe GCC Organic Fertilizer Industry Revenue Share (%), by Export Market Analysis (Value & Volume) 2024 & 2032
                                                              44. Figure 44: Europe GCC Organic Fertilizer Industry Revenue (Million), by Price Trend Analysis 2024 & 2032
                                                              45. Figure 45: Europe GCC Organic Fertilizer Industry Revenue Share (%), by Price Trend Analysis 2024 & 2032
                                                              46. Figure 46: Europe GCC Organic Fertilizer Industry Revenue (Million), by Country 2024 & 2032
                                                              47. Figure 47: Europe GCC Organic Fertilizer Industry Revenue Share (%), by Country 2024 & 2032
                                                              48. Figure 48: Middle East & Africa GCC Organic Fertilizer Industry Revenue (Million), by Production Analysis 2024 & 2032
                                                              49. Figure 49: Middle East & Africa GCC Organic Fertilizer Industry Revenue Share (%), by Production Analysis 2024 & 2032
                                                              50. Figure 50: Middle East & Africa GCC Organic Fertilizer Industry Revenue (Million), by Consumption Analysis 2024 & 2032
                                                              51. Figure 51: Middle East & Africa GCC Organic Fertilizer Industry Revenue Share (%), by Consumption Analysis 2024 & 2032
                                                              52. Figure 52: Middle East & Africa GCC Organic Fertilizer Industry Revenue (Million), by Import Market Analysis (Value & Volume) 2024 & 2032
                                                              53. Figure 53: Middle East & Africa GCC Organic Fertilizer Industry Revenue Share (%), by Import Market Analysis (Value & Volume) 2024 & 2032
                                                              54. Figure 54: Middle East & Africa GCC Organic Fertilizer Industry Revenue (Million), by Export Market Analysis (Value & Volume) 2024 & 2032
                                                              55. Figure 55: Middle East & Africa GCC Organic Fertilizer Industry Revenue Share (%), by Export Market Analysis (Value & Volume) 2024 & 2032
                                                              56. Figure 56: Middle East & Africa GCC Organic Fertilizer Industry Revenue (Million), by Price Trend Analysis 2024 & 2032
                                                              57. Figure 57: Middle East & Africa GCC Organic Fertilizer Industry Revenue Share (%), by Price Trend Analysis 2024 & 2032
                                                              58. Figure 58: Middle East & Africa GCC Organic Fertilizer Industry Revenue (Million), by Country 2024 & 2032
                                                              59. Figure 59: Middle East & Africa GCC Organic Fertilizer Industry Revenue Share (%), by Country 2024 & 2032
                                                              60. Figure 60: Asia Pacific GCC Organic Fertilizer Industry Revenue (Million), by Production Analysis 2024 & 2032
                                                              61. Figure 61: Asia Pacific GCC Organic Fertilizer Industry Revenue Share (%), by Production Analysis 2024 & 2032
                                                              62. Figure 62: Asia Pacific GCC Organic Fertilizer Industry Revenue (Million), by Consumption Analysis 2024 & 2032
                                                              63. Figure 63: Asia Pacific GCC Organic Fertilizer Industry Revenue Share (%), by Consumption Analysis 2024 & 2032
                                                              64. Figure 64: Asia Pacific GCC Organic Fertilizer Industry Revenue (Million), by Import Market Analysis (Value & Volume) 2024 & 2032
                                                              65. Figure 65: Asia Pacific GCC Organic Fertilizer Industry Revenue Share (%), by Import Market Analysis (Value & Volume) 2024 & 2032
                                                              66. Figure 66: Asia Pacific GCC Organic Fertilizer Industry Revenue (Million), by Export Market Analysis (Value & Volume) 2024 & 2032
                                                              67. Figure 67: Asia Pacific GCC Organic Fertilizer Industry Revenue Share (%), by Export Market Analysis (Value & Volume) 2024 & 2032
                                                              68. Figure 68: Asia Pacific GCC Organic Fertilizer Industry Revenue (Million), by Price Trend Analysis 2024 & 2032
                                                              69. Figure 69: Asia Pacific GCC Organic Fertilizer Industry Revenue Share (%), by Price Trend Analysis 2024 & 2032
                                                              70. Figure 70: Asia Pacific GCC Organic Fertilizer Industry Revenue (Million), by Country 2024 & 2032
                                                              71. Figure 71: Asia Pacific GCC Organic Fertilizer Industry Revenue Share (%), by Country 2024 & 2032

                                                              List of Tables

                                                              1. Table 1: Global GCC Organic Fertilizer Industry Revenue Million Forecast, by Region 2019 & 2032
                                                              2. Table 2: Global GCC Organic Fertilizer Industry Revenue Million Forecast, by Production Analysis 2019 & 2032
                                                              3. Table 3: Global GCC Organic Fertilizer Industry Revenue Million Forecast, by Consumption Analysis 2019 & 2032
                                                              4. Table 4: Global GCC Organic Fertilizer Industry Revenue Million Forecast, by Import Market Analysis (Value & Volume) 2019 & 2032
                                                              5. Table 5: Global GCC Organic Fertilizer Industry Revenue Million Forecast, by Export Market Analysis (Value & Volume) 2019 & 2032
                                                              6. Table 6: Global GCC Organic Fertilizer Industry Revenue Million Forecast, by Price Trend Analysis 2019 & 2032
                                                              7. Table 7: Global GCC Organic Fertilizer Industry Revenue Million Forecast, by Region 2019 & 2032
                                                              8. Table 8: Global GCC Organic Fertilizer Industry Revenue Million Forecast, by Country 2019 & 2032
                                                              9. Table 9: United States GCC Organic Fertilizer Industry Revenue (Million) Forecast, by Application 2019 & 2032
                                                              10. Table 10: Canada GCC Organic Fertilizer Industry Revenue (Million) Forecast, by Application 2019 & 2032
                                                              11. Table 11: Mexico GCC Organic Fertilizer Industry Revenue (Million) Forecast, by Application 2019 & 2032
                                                              12. Table 12: Global GCC Organic Fertilizer Industry Revenue Million Forecast, by Country 2019 & 2032
                                                              13. Table 13: Germany GCC Organic Fertilizer Industry Revenue (Million) Forecast, by Application 2019 & 2032
                                                              14. Table 14: United Kingdom GCC Organic Fertilizer Industry Revenue (Million) Forecast, by Application 2019 & 2032
                                                              15. Table 15: France GCC Organic Fertilizer Industry Revenue (Million) Forecast, by Application 2019 & 2032
                                                              16. Table 16: Spain GCC Organic Fertilizer Industry Revenue (Million) Forecast, by Application 2019 & 2032
                                                              17. Table 17: Italy GCC Organic Fertilizer Industry Revenue (Million) Forecast, by Application 2019 & 2032
                                                              18. Table 18: Spain GCC Organic Fertilizer Industry Revenue (Million) Forecast, by Application 2019 & 2032
                                                              19. Table 19: Belgium GCC Organic Fertilizer Industry Revenue (Million) Forecast, by Application 2019 & 2032
                                                              20. Table 20: Netherland GCC Organic Fertilizer Industry Revenue (Million) Forecast, by Application 2019 & 2032
                                                              21. Table 21: Nordics GCC Organic Fertilizer Industry Revenue (Million) Forecast, by Application 2019 & 2032
                                                              22. Table 22: Rest of Europe GCC Organic Fertilizer Industry Revenue (Million) Forecast, by Application 2019 & 2032
                                                              23. Table 23: Global GCC Organic Fertilizer Industry Revenue Million Forecast, by Country 2019 & 2032
                                                              24. Table 24: China GCC Organic Fertilizer Industry Revenue (Million) Forecast, by Application 2019 & 2032
                                                              25. Table 25: Japan GCC Organic Fertilizer Industry Revenue (Million) Forecast, by Application 2019 & 2032
                                                              26. Table 26: India GCC Organic Fertilizer Industry Revenue (Million) Forecast, by Application 2019 & 2032
                                                              27. Table 27: South Korea GCC Organic Fertilizer Industry Revenue (Million) Forecast, by Application 2019 & 2032
                                                              28. Table 28: Southeast Asia GCC Organic Fertilizer Industry Revenue (Million) Forecast, by Application 2019 & 2032
                                                              29. Table 29: Australia GCC Organic Fertilizer Industry Revenue (Million) Forecast, by Application 2019 & 2032
                                                              30. Table 30: Indonesia GCC Organic Fertilizer Industry Revenue (Million) Forecast, by Application 2019 & 2032
                                                              31. Table 31: Phillipes GCC Organic Fertilizer Industry Revenue (Million) Forecast, by Application 2019 & 2032
                                                              32. Table 32: Singapore GCC Organic Fertilizer Industry Revenue (Million) Forecast, by Application 2019 & 2032
                                                              33. Table 33: Thailandc GCC Organic Fertilizer Industry Revenue (Million) Forecast, by Application 2019 & 2032
                                                              34. Table 34: Rest of Asia Pacific GCC Organic Fertilizer Industry Revenue (Million) Forecast, by Application 2019 & 2032
                                                              35. Table 35: Global GCC Organic Fertilizer Industry Revenue Million Forecast, by Country 2019 & 2032
                                                              36. Table 36: Brazil GCC Organic Fertilizer Industry Revenue (Million) Forecast, by Application 2019 & 2032
                                                              37. Table 37: Argentina GCC Organic Fertilizer Industry Revenue (Million) Forecast, by Application 2019 & 2032
                                                              38. Table 38: Peru GCC Organic Fertilizer Industry Revenue (Million) Forecast, by Application 2019 & 2032
                                                              39. Table 39: Chile GCC Organic Fertilizer Industry Revenue (Million) Forecast, by Application 2019 & 2032
                                                              40. Table 40: Colombia GCC Organic Fertilizer Industry Revenue (Million) Forecast, by Application 2019 & 2032
                                                              41. Table 41: Ecuador GCC Organic Fertilizer Industry Revenue (Million) Forecast, by Application 2019 & 2032
                                                              42. Table 42: Venezuela GCC Organic Fertilizer Industry Revenue (Million) Forecast, by Application 2019 & 2032
                                                              43. Table 43: Rest of South America GCC Organic Fertilizer Industry Revenue (Million) Forecast, by Application 2019 & 2032
                                                              44. Table 44: Global GCC Organic Fertilizer Industry Revenue Million Forecast, by Country 2019 & 2032
                                                              45. Table 45: United Arab Emirates GCC Organic Fertilizer Industry Revenue (Million) Forecast, by Application 2019 & 2032
                                                              46. Table 46: Saudi Arabia GCC Organic Fertilizer Industry Revenue (Million) Forecast, by Application 2019 & 2032
                                                              47. Table 47: South Africa GCC Organic Fertilizer Industry Revenue (Million) Forecast, by Application 2019 & 2032
                                                              48. Table 48: Rest of Middle East and Africa GCC Organic Fertilizer Industry Revenue (Million) Forecast, by Application 2019 & 2032
                                                              49. Table 49: Global GCC Organic Fertilizer Industry Revenue Million Forecast, by Production Analysis 2019 & 2032
                                                              50. Table 50: Global GCC Organic Fertilizer Industry Revenue Million Forecast, by Consumption Analysis 2019 & 2032
                                                              51. Table 51: Global GCC Organic Fertilizer Industry Revenue Million Forecast, by Import Market Analysis (Value & Volume) 2019 & 2032
                                                              52. Table 52: Global GCC Organic Fertilizer Industry Revenue Million Forecast, by Export Market Analysis (Value & Volume) 2019 & 2032
                                                              53. Table 53: Global GCC Organic Fertilizer Industry Revenue Million Forecast, by Price Trend Analysis 2019 & 2032
                                                              54. Table 54: Global GCC Organic Fertilizer Industry Revenue Million Forecast, by Country 2019 & 2032
                                                              55. Table 55: United States GCC Organic Fertilizer Industry Revenue (Million) Forecast, by Application 2019 & 2032
                                                              56. Table 56: Canada GCC Organic Fertilizer Industry Revenue (Million) Forecast, by Application 2019 & 2032
                                                              57. Table 57: Mexico GCC Organic Fertilizer Industry Revenue (Million) Forecast, by Application 2019 & 2032
                                                              58. Table 58: Global GCC Organic Fertilizer Industry Revenue Million Forecast, by Production Analysis 2019 & 2032
                                                              59. Table 59: Global GCC Organic Fertilizer Industry Revenue Million Forecast, by Consumption Analysis 2019 & 2032
                                                              60. Table 60: Global GCC Organic Fertilizer Industry Revenue Million Forecast, by Import Market Analysis (Value & Volume) 2019 & 2032
                                                              61. Table 61: Global GCC Organic Fertilizer Industry Revenue Million Forecast, by Export Market Analysis (Value & Volume) 2019 & 2032
                                                              62. Table 62: Global GCC Organic Fertilizer Industry Revenue Million Forecast, by Price Trend Analysis 2019 & 2032
                                                              63. Table 63: Global GCC Organic Fertilizer Industry Revenue Million Forecast, by Country 2019 & 2032
                                                              64. Table 64: Brazil GCC Organic Fertilizer Industry Revenue (Million) Forecast, by Application 2019 & 2032
                                                              65. Table 65: Argentina GCC Organic Fertilizer Industry Revenue (Million) Forecast, by Application 2019 & 2032
                                                              66. Table 66: Rest of South America GCC Organic Fertilizer Industry Revenue (Million) Forecast, by Application 2019 & 2032
                                                              67. Table 67: Global GCC Organic Fertilizer Industry Revenue Million Forecast, by Production Analysis 2019 & 2032
                                                              68. Table 68: Global GCC Organic Fertilizer Industry Revenue Million Forecast, by Consumption Analysis 2019 & 2032
                                                              69. Table 69: Global GCC Organic Fertilizer Industry Revenue Million Forecast, by Import Market Analysis (Value & Volume) 2019 & 2032
                                                              70. Table 70: Global GCC Organic Fertilizer Industry Revenue Million Forecast, by Export Market Analysis (Value & Volume) 2019 & 2032
                                                              71. Table 71: Global GCC Organic Fertilizer Industry Revenue Million Forecast, by Price Trend Analysis 2019 & 2032
                                                              72. Table 72: Global GCC Organic Fertilizer Industry Revenue Million Forecast, by Country 2019 & 2032
                                                              73. Table 73: United Kingdom GCC Organic Fertilizer Industry Revenue (Million) Forecast, by Application 2019 & 2032
                                                              74. Table 74: Germany GCC Organic Fertilizer Industry Revenue (Million) Forecast, by Application 2019 & 2032
                                                              75. Table 75: France GCC Organic Fertilizer Industry Revenue (Million) Forecast, by Application 2019 & 2032
                                                              76. Table 76: Italy GCC Organic Fertilizer Industry Revenue (Million) Forecast, by Application 2019 & 2032
                                                              77. Table 77: Spain GCC Organic Fertilizer Industry Revenue (Million) Forecast, by Application 2019 & 2032
                                                              78. Table 78: Russia GCC Organic Fertilizer Industry Revenue (Million) Forecast, by Application 2019 & 2032
                                                              79. Table 79: Benelux GCC Organic Fertilizer Industry Revenue (Million) Forecast, by Application 2019 & 2032
                                                              80. Table 80: Nordics GCC Organic Fertilizer Industry Revenue (Million) Forecast, by Application 2019 & 2032
                                                              81. Table 81: Rest of Europe GCC Organic Fertilizer Industry Revenue (Million) Forecast, by Application 2019 & 2032
                                                              82. Table 82: Global GCC Organic Fertilizer Industry Revenue Million Forecast, by Production Analysis 2019 & 2032
                                                              83. Table 83: Global GCC Organic Fertilizer Industry Revenue Million Forecast, by Consumption Analysis 2019 & 2032
                                                              84. Table 84: Global GCC Organic Fertilizer Industry Revenue Million Forecast, by Import Market Analysis (Value & Volume) 2019 & 2032
                                                              85. Table 85: Global GCC Organic Fertilizer Industry Revenue Million Forecast, by Export Market Analysis (Value & Volume) 2019 & 2032
                                                              86. Table 86: Global GCC Organic Fertilizer Industry Revenue Million Forecast, by Price Trend Analysis 2019 & 2032
                                                              87. Table 87: Global GCC Organic Fertilizer Industry Revenue Million Forecast, by Country 2019 & 2032
                                                              88. Table 88: Turkey GCC Organic Fertilizer Industry Revenue (Million) Forecast, by Application 2019 & 2032
                                                              89. Table 89: Israel GCC Organic Fertilizer Industry Revenue (Million) Forecast, by Application 2019 & 2032
                                                              90. Table 90: GCC GCC Organic Fertilizer Industry Revenue (Million) Forecast, by Application 2019 & 2032
                                                              91. Table 91: North Africa GCC Organic Fertilizer Industry Revenue (Million) Forecast, by Application 2019 & 2032
                                                              92. Table 92: South Africa GCC Organic Fertilizer Industry Revenue (Million) Forecast, by Application 2019 & 2032
                                                              93. Table 93: Rest of Middle East & Africa GCC Organic Fertilizer Industry Revenue (Million) Forecast, by Application 2019 & 2032
                                                              94. Table 94: Global GCC Organic Fertilizer Industry Revenue Million Forecast, by Production Analysis 2019 & 2032
                                                              95. Table 95: Global GCC Organic Fertilizer Industry Revenue Million Forecast, by Consumption Analysis 2019 & 2032
                                                              96. Table 96: Global GCC Organic Fertilizer Industry Revenue Million Forecast, by Import Market Analysis (Value & Volume) 2019 & 2032
                                                              97. Table 97: Global GCC Organic Fertilizer Industry Revenue Million Forecast, by Export Market Analysis (Value & Volume) 2019 & 2032
                                                              98. Table 98: Global GCC Organic Fertilizer Industry Revenue Million Forecast, by Price Trend Analysis 2019 & 2032
                                                              99. Table 99: Global GCC Organic Fertilizer Industry Revenue Million Forecast, by Country 2019 & 2032
                                                              100. Table 100: China GCC Organic Fertilizer Industry Revenue (Million) Forecast, by Application 2019 & 2032
                                                              101. Table 101: India GCC Organic Fertilizer Industry Revenue (Million) Forecast, by Application 2019 & 2032
                                                              102. Table 102: Japan GCC Organic Fertilizer Industry Revenue (Million) Forecast, by Application 2019 & 2032
                                                              103. Table 103: South Korea GCC Organic Fertilizer Industry Revenue (Million) Forecast, by Application 2019 & 2032
                                                              104. Table 104: ASEAN GCC Organic Fertilizer Industry Revenue (Million) Forecast, by Application 2019 & 2032
                                                              105. Table 105: Oceania GCC Organic Fertilizer Industry Revenue (Million) Forecast, by Application 2019 & 2032
                                                              106. Table 106: Rest of Asia Pacific GCC Organic Fertilizer Industry Revenue (Million) Forecast, by Application 2019 & 2032


                                                              Frequently Asked Questions

                                                              1. What is the projected Compound Annual Growth Rate (CAGR) of the GCC Organic Fertilizer Industry?

                                                              The projected CAGR is approximately 13.50%.

                                                              2. Which companies are prominent players in the GCC Organic Fertilizer Industry?

                                                              Key companies in the market include Al Yahar Organic Fertilizers Factory, Abu Dhabi Fertilizer Industries Co WLL, Heera Organic Fertilize, Arab Qatari Agricultural Production Company, RNZ International FZCO, Debbane Saikali Group, Emirates Bio Fertilizers Factory, Nabat agriculture & Trading Co, Al-Akhawain.

                                                              3. What are the main segments of the GCC Organic Fertilizer Industry?

                                                              The market segments include Production Analysis, Consumption Analysis, Import Market Analysis (Value & Volume), Export Market Analysis (Value & Volume), Price Trend Analysis.

                                                              4. Can you provide details about the market size?

                                                              The market size is estimated to be USD XX Million as of 2022.

                                                              5. What are some drivers contributing to market growth?

                                                              High Cost of Farm Labors; Increasing Consumption of Grain Crops.

                                                              6. What are the notable trends driving market growth?

                                                              Increasing Focus on Organic Farming Practices.

                                                              7. Are there any restraints impacting market growth?

                                                              High Cost of Combine Harvesters; Small and Fragmented Land Holdings.

                                                              8. Can you provide examples of recent developments in the market?

                                                              May 2022: The Minister of Climate Change and Environment in the UAE launched the waste-to-feed project by Circa Biotech that farms black soldier fly (BSF) larvae, fed by food leftovers, and turns them into animal proteins, organic fertilizers, and oils.

                                                              9. What pricing options are available for accessing the report?

                                                              Pricing options include single-user, multi-user, and enterprise licenses priced at USD 4750, USD 5250, and USD 8750 respectively.

                                                              10. Is the market size provided in terms of value or volume?

                                                              The market size is provided in terms of value, measured in Million.

                                                              11. Are there any specific market keywords associated with the report?

                                                              Yes, the market keyword associated with the report is "GCC Organic Fertilizer Industry," which aids in identifying and referencing the specific market segment covered.

                                                              12. How do I determine which pricing option suits my needs best?

                                                              The pricing options vary based on user requirements and access needs. Individual users may opt for single-user licenses, while businesses requiring broader access may choose multi-user or enterprise licenses for cost-effective access to the report.

                                                              13. Are there any additional resources or data provided in the GCC Organic Fertilizer Industry report?

                                                              While the report offers comprehensive insights, it's advisable to review the specific contents or supplementary materials provided to ascertain if additional resources or data are available.

                                                              14. How can I stay updated on further developments or reports in the GCC Organic Fertilizer Industry?

                                                              To stay informed about further developments, trends, and reports in the GCC Organic Fertilizer Industry, consider subscribing to industry newsletters, following relevant companies and organizations, or regularly checking reputable industry news sources and publications.


                                                              Methodology

                                                              Step 1 - Identification of Relevant Samples Size from Population Database

                                                              Step Chart
                                                              Bar Chart
                                                              Method Chart

                                                              Step 2 - Approaches for Defining Global Market Size (Value, Volume* & Price*)

                                                              Approach Chart
                                                              Top-down and bottom-up approaches are used to validate the global market size and estimate the market size for manufactures, regional segments, product, and application.

                                                              Note*: In applicable scenarios

                                                              Step 3 - Data Sources

                                                              Primary Research

                                                              • Web Analytics
                                                              • Survey Reports
                                                              • Research Institute
                                                              • Latest Research Reports
                                                              • Opinion Leaders

                                                              Secondary Research

                                                              • Annual Reports
                                                              • White Paper
                                                              • Latest Press Release
                                                              • Industry Association
                                                              • Paid Database
                                                              • Investor Presentations
                                                              Analyst Chart

                                                              Step 4 - Data Triangulation

                                                              Involves using different sources of information in order to increase the validity of a study

                                                              These sources are likely to be stakeholders in a program - participants, other researchers, program staff, other community members, and so on.

                                                              Then we put all data in single framework & apply various statistical tools to find out the dynamic on the market.

                                                              During the analysis stage, feedback from the stakeholder groups would be compared to determine areas of agreement as well as areas of divergence

                                                              Additionally, after gathering mixed and scattered data from a wide range of sources, data is triangulated and correlated to come up with estimated figures which are further validated through primary mediums or industry experts, opinion leaders.

                                                              About Visionary Data Reports

                                                              Visionary Data Reports provides future-focused market research, advanced analytics, and strategic insights for technology, healthcare, green energy, and finance. Our reports help you anticipate trends, innovate, and lead in your industry. Our expert team combines primary research, data science, and industry knowledge to deliver actionable intelligence. We offer syndicated reports, custom analytics, and consulting services tailored to your business needs. At Visionary Data Reports, we are committed to quality, transparency, and client satisfaction. Every report is rigorously validated to ensure accuracy and relevance. Our global perspective and forward-thinking approach help you understand both current and emerging market dynamics.

                                                              Stay ahead with Visionary Data Reports. Subscribe to our newsletter for the latest insights and research highlights, and follow us on social media for real-time updates. Visionary Data Reports – Your Guide to Tomorrow’s Opportunities.

                                                              artwork spiralartwork spiralRelated Reports
                                                              artwork underline

                                                              Tomato Seed Market 2025-2033 Overview: Trends, Competitor Dynamics, and Opportunities

                                                              Discover the booming global tomato seed market! This comprehensive analysis reveals key trends, growth drivers (hybrid seeds, protected cultivation), restraints, and regional insights (Asia-Pacific leading) for the period 2019-2033, featuring top players like Sakata Seeds and Syngenta. Projected CAGR of 4.70% showcases significant investment opportunities.

                                                              July 2025
                                                              Base Year: 2024
                                                              No Of Pages: 180
                                                              Price: $3800

                                                              Emerging Trends in Brazil Maize Market: A Technology Perspective 2025-2033

                                                              Discover the dynamic Brazil maize market forecast (2025-2033)! This in-depth analysis reveals key growth drivers, including animal feed, biofuel, and human consumption, alongside major players like Syngenta and Corteva. Explore market size, CAGR, and regional insights to understand this lucrative opportunity.

                                                              July 2025
                                                              Base Year: 2024
                                                              No Of Pages: 180
                                                              Price: $3800

                                                              Future Forecasts for North America Seed Treatment Market Industry Growth

                                                              Discover the booming North American seed treatment market! This in-depth analysis reveals a CAGR of 4.20% (2025-2033), driven by precision farming, pest control needs, and government support. Explore key players, market segments (fungicides, insecticides, crops), and regional trends in the US, Canada, and Mexico. Get the data-driven insights you need to succeed.

                                                              July 2025
                                                              Base Year: 2024
                                                              No Of Pages: 150
                                                              Price: $3800

                                                              Africa Chia Seeds Industry Market’s Drivers and Challenges: Strategic Overview 2025-2033

                                                              Discover the booming African chia seed market! Our analysis reveals a $13.87M market in 2025, projected to grow at a 2.10% CAGR through 2033. Explore key trends, segments (organic, hybrid, processed, omega-3 rich), applications (food & beverage, supplements, personal care), and leading companies. Get insights for investment and market entry.

                                                              July 2025
                                                              Base Year: 2024
                                                              No Of Pages: 180
                                                              Price: $4750

                                                              Strategic Trends in Asia-Pacific Seed Coating Materials Market Market 2025-2033

                                                              The Asia-Pacific seed coating materials market is booming, with an 8% CAGR. Discover key trends, leading companies (BASF, Bayer), and segment analysis (polymers, colorants) driving growth in this $XX million market. Explore the forecast to 2033.

                                                              July 2025
                                                              Base Year: 2024
                                                              No Of Pages: 150
                                                              Price: $3800

                                                              Comprehensive Review of UK Fruits and Vegetables Market Growth Potential

                                                              Discover the booming UK fruits and vegetables market! This in-depth analysis reveals a £31.58 billion market with a 2.97% CAGR (2025-2033), driven by health trends and major players like Tesco and Sainsbury's. Explore regional data, consumption patterns, and future growth potential.

                                                              July 2025
                                                              Base Year: 2024
                                                              No Of Pages: 180
                                                              Price: $3800

                                                              Malaysia Agrochemical Market Market’s Drivers and Challenges: Strategic Overview 2025-2033

                                                              Discover the booming Malaysian agrochemical market! This comprehensive analysis reveals a RM 679.59 million market in 2025, projected to grow at a 4.56% CAGR until 2033. Explore key drivers, trends, restraints, and leading companies shaping this dynamic sector. Learn about fertilizers, pesticides, and other agrochemical segments.

                                                              July 2025
                                                              Base Year: 2024
                                                              No Of Pages: 150
                                                              Price: $3800

                                                              Drivers of Change in Agricultural Surfactant Market Market 2025-2033

                                                              The global agricultural surfactant market is booming, projected to reach $3.56 billion by 2033 with a 6.70% CAGR. Driven by precision agriculture and sustainable farming, this market analysis explores key segments (anionic, nonionic, bio-based), top players (BASF, Clariant), and regional growth trends. Discover the future of agricultural surfactants.

                                                              July 2025
                                                              Base Year: 2024
                                                              No Of Pages: 234
                                                              Price: $4750

                                                              Cameroon Grains Industry Industry Analysis and Consumer Behavior

                                                              Discover the booming Cameroon grains industry! Explore market size, growth trends (4.80% CAGR), key players (Sodecoton, CDC, etc.), and challenges impacting cereals, pulses, and oilseeds in Cameroon from 2019-2033. Invest wisely in this promising African market.

                                                              July 2025
                                                              Base Year: 2024
                                                              No Of Pages: 180
                                                              Price: $3800

                                                              Analyzing Consumer Behavior in Agriculture Market in Tanzania Market

                                                              Discover the booming Tanzanian agriculture market! Projected to reach $17.44 billion in 2025, with a 5.63% CAGR, this report analyzes market size, key players (Syngenta, Rijk Zwaan), growth drivers, and future trends in Tanzania's agricultural sector. Explore market segments, including food crops and investment opportunities.

                                                              July 2025
                                                              Base Year: 2024
                                                              No Of Pages: 150
                                                              Price: $3800

                                                              Analyzing Consumer Behavior in Artificial Intelligence in Agriculture Industry Market

                                                              Discover the booming AI in Agriculture market! This comprehensive analysis reveals a 4.20% CAGR, key drivers, trends, restraints, and regional insights from 2019-2033. Learn about leading companies and applications like precision farming, drone analytics, and weather tracking. Explore market size projections and future growth potential.

                                                              July 2025
                                                              Base Year: 2024
                                                              No Of Pages: 150
                                                              Price: $4750

                                                              Exploring Forestry Machinery Market’s Market Size Dynamics 2025-2033

                                                              The global forestry machinery market is booming, projected to reach $15 billion by 2033, driven by rising timber demand and technological advancements. Explore market trends, key players (Deere, Komatsu, etc.), and regional growth in our comprehensive analysis.

                                                              July 2025
                                                              Base Year: 2024
                                                              No Of Pages: 150
                                                              Price: $4750

                                                              Nutrition Canary Seed Market Competitive Strategies: Trends and Forecasts 2025-2033

                                                              Discover the booming nutrition canary seed market! Explore key trends, growth drivers, and regional market share projections for 2025-2033. Learn about leading companies and the increasing demand driven by health-conscious consumers and the birdseed industry.

                                                              July 2025
                                                              Base Year: 2024
                                                              No Of Pages: 234
                                                              Price: $4750

                                                              Consumer Behavior and Cashews Market in South America Trends

                                                              Discover the booming South American cashew market! This comprehensive analysis reveals a $582.24 million market in 2025, projected to grow at a 5.20% CAGR through 2033. Explore key trends, drivers, and leading companies shaping this lucrative industry.

                                                              July 2025
                                                              Base Year: 2024
                                                              No Of Pages: 180
                                                              Price: $3800

                                                              Strategic Growth Drivers for Rye Industry Market

                                                              Discover the latest market analysis of the global rye industry, projecting a steady CAGR of 2.20% to 2033. Explore key drivers, restraints, and regional trends impacting the growth of rye in food, feed, and beverage applications. Learn about leading companies and future market opportunities.

                                                              July 2025
                                                              Base Year: 2024
                                                              No Of Pages: 234
                                                              Price: $4750

                                                              Comprehensive Overview of Water Soluble Fertilizer Industry Trends: 2025-2033

                                                              Discover the booming water-soluble fertilizer market! Explore its $XX million valuation in 2025, projected 3.80% CAGR growth to 2033, key drivers, trends, and regional insights. Learn about top players and lucrative segments like fertigation and horticultural crops.

                                                              July 2025
                                                              Base Year: 2024
                                                              No Of Pages: 150
                                                              Price: $3800

                                                              Asia-Pacific Agricultural Tractors Market Market Expansion: Growth Outlook 2025-2033

                                                              Discover the booming Asia-Pacific Agricultural Tractors market! Our analysis reveals a $15 billion USD market in 2025, projected to grow at a 6% CAGR through 2033. Explore market size, growth trends, and regional breakdowns for India, China, and other key countries. Learn how technological advancements and government initiatives are shaping the future of farming.

                                                              July 2025
                                                              Base Year: 2024
                                                              No Of Pages: 197
                                                              Price: $3800

                                                              Asia-Pacific Agricultural Enzymes Market Market’s Consumer Preferences: Trends and Analysis 2025-2033

                                                              The Asia-Pacific agricultural enzymes market is booming, projected to reach $XX million by 2025, with a CAGR of 10.30%. This report analyzes market drivers, trends, restraints, and key players like Novozymes and BASF, covering segments like carbohydrases and applications in crop protection. Discover regional insights and forecast data for 2025-2033.

                                                              July 2025
                                                              Base Year: 2024
                                                              No Of Pages: 197
                                                              Price: $3800

                                                              Strategic Vision for USA Agricultural Irrigation Machinery Market Industry Trends

                                                              Discover the booming US agricultural irrigation machinery market! This in-depth analysis reveals projected growth to $3.8B by 2033, driven by water scarcity, precision agriculture, and smart irrigation technology. Explore key players, regional trends, and market segmentation in drip, sprinkler, and pivot irrigation.

                                                              July 2025
                                                              Base Year: 2024
                                                              No Of Pages: 150
                                                              Price: $3800

                                                              Electric Lawn Mowers Market Insightful Market Analysis: Trends and Opportunities 2025-2033

                                                              Discover the booming electric lawn mower market! This comprehensive analysis reveals a CAGR of 6.50%, driven by eco-consciousness and technological advancements. Explore market size, key players (Toro, Husqvarna, etc.), regional trends, and future projections (2025-2033) for residential, professional, and golf course applications.

                                                              July 2025
                                                              Base Year: 2024
                                                              No Of Pages: 150
                                                              Price: $4750
                                                              • Home
                                                              • About Us
                                                              • Industries
                                                                • Aerospace & Defense
                                                                • Agriculture
                                                                • Animal Nutrition & Wellness
                                                                • Automotive
                                                                • Chemicals & Materials
                                                                • Consumer Goods and Services
                                                                • Energy & Power
                                                                • Financial Services and Investment Intelligence
                                                                • Food & Beverage
                                                                • Home and Property Improvement
                                                                • Hospitality and Tourism
                                                                • Logistics
                                                                • Manufacturing Products and Services
                                                                • Packaging
                                                                • Professional and Commercial Services
                                                                • Real Estate and Construction
                                                                • Retail
                                                                • Technology, Media and Telecom
                                                                • Healthcare
                                                              • Services
                                                              • Contact
                                                              Main Logo
                                                              • Home
                                                              • About Us
                                                              • Industries
                                                                • Aerospace & Defense
                                                                • Agriculture
                                                                • Animal Nutrition & Wellness
                                                                • Automotive
                                                                • Chemicals & Materials
                                                                • Consumer Goods and Services
                                                                • Energy & Power
                                                                • Financial Services and Investment Intelligence
                                                                • Food & Beverage
                                                                • Home and Property Improvement
                                                                • Hospitality and Tourism
                                                                • Logistics
                                                                • Manufacturing Products and Services
                                                                • Packaging
                                                                • Professional and Commercial Services
                                                                • Real Estate and Construction
                                                                • Retail
                                                                • Technology, Media and Telecom
                                                                • Healthcare
                                                              • Services
                                                              • Contact
                                                              +17162654855
                                                              [email protected]

                                                              +17162654855

                                                              [email protected]

                                                              Business Address

                                                              Head Office

                                                              Office no. A 5010, fifth floor, Solitaire Business Hub, Near Phoenix mall, Pune, Maharashtra 411014

                                                              Contact Information

                                                              Craig Francis

                                                              Business Development Head

                                                              +17162654855

                                                              [email protected]

                                                              Connect With Us

                                                              Secure Payment Partners

                                                              payment image
                                                              RetailLogisticsPackagingAutomotiveHealthcareAgricultureEnergy & PowerFood & BeverageAerospace & DefenseChemicals & MaterialsHospitality and TourismAnimal Nutrition & WellnessConsumer Goods and ServicesReal Estate and ConstructionHome and Property ImprovementTechnology, Media and TelecomManufacturing Products and ServicesFinancial Services and Investment Intelligence

                                                              © 2025 All rights reserved


                                                              Privacy Policy
                                                              Terms and Conditions
                                                              FAQ