

Key Insights
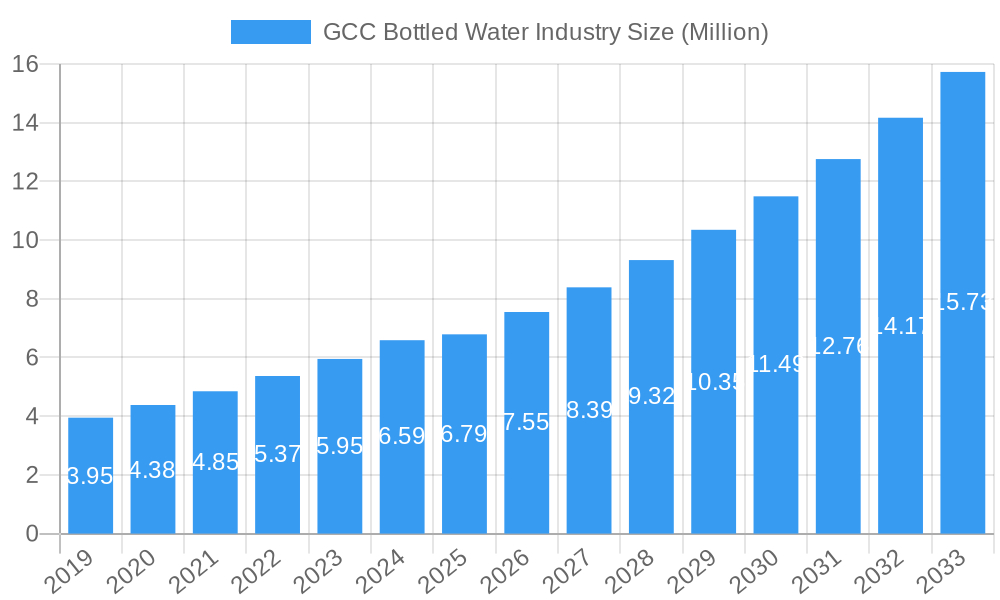
The GCC Bottled Water Industry is poised for remarkable expansion, projected to reach a substantial USD 6.79 billion by 2025. This robust growth is fueled by a compelling Compound Annual Growth Rate (CAGR) of 11.16%, indicating a dynamic and rapidly evolving market. Key drivers behind this surge include increasing health consciousness among consumers, a growing preference for convenient and hygienic hydration solutions, and the rising disposable incomes across the region. Furthermore, the GCC's booming tourism sector and the increasing demand for premium and functional water varieties are significantly contributing to market value. The "Still Water" segment is expected to lead the market, driven by its widespread appeal and affordability, closely followed by "Sparkling Water" which is gaining traction among consumers seeking premium beverage options. The "Functional Water" segment, offering added health benefits, is also on an upward trajectory, catering to a niche but growing segment of health-conscious individuals.
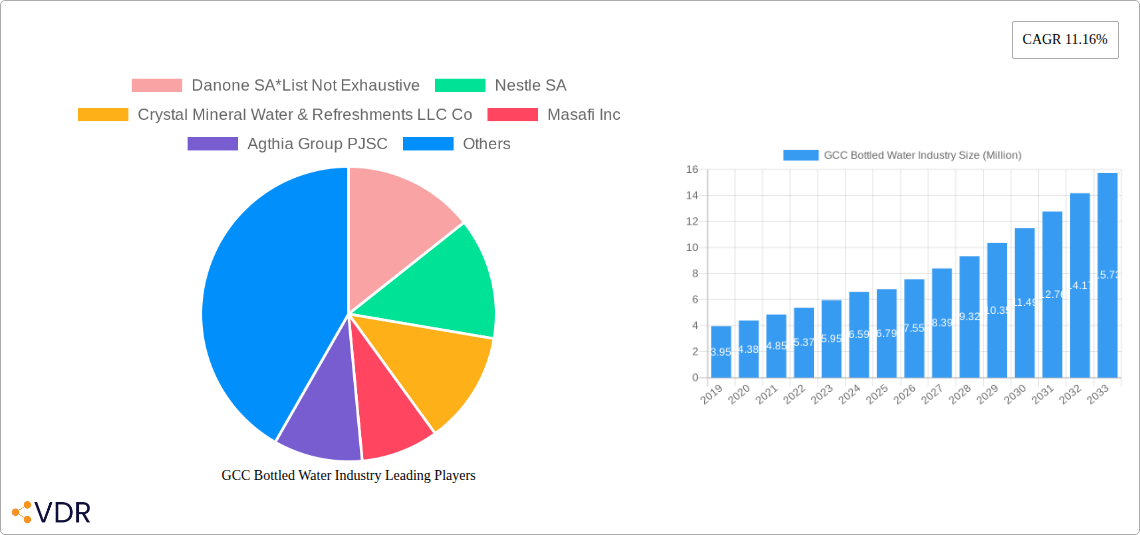
GCC Bottled Water Industry Market Size (In Million)
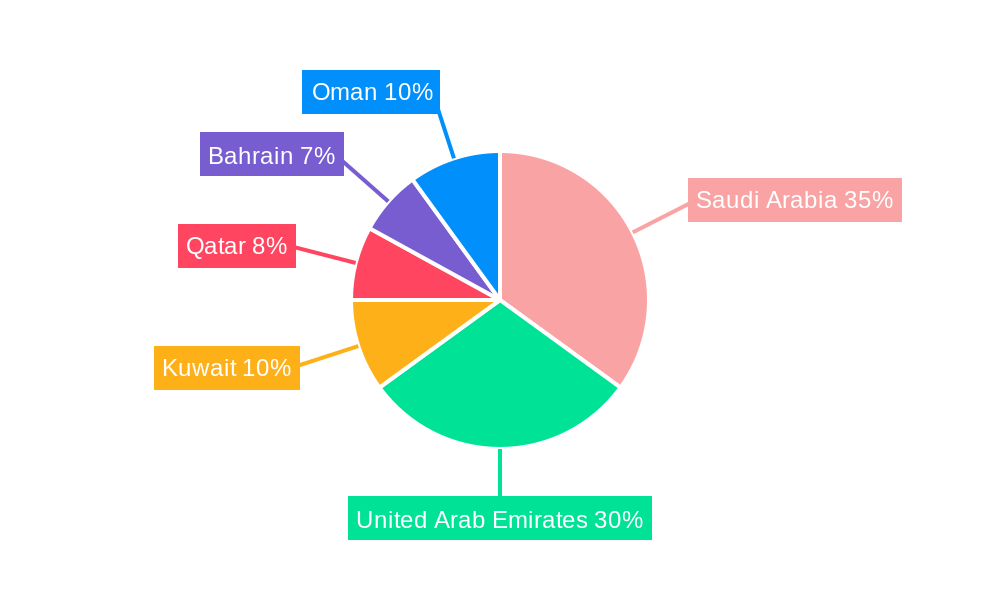
The distribution landscape is diverse, with "Supermarkets/Hypermarkets" and "Convenience/Grocery Stores" currently dominating the market share due to their extensive reach and accessibility. However, the "Home and Office Delivery" segment is witnessing significant growth, propelled by the convenience it offers and the increasing adoption of e-commerce platforms. "On-trade Channels" also play a vital role, particularly in the hospitality and food service sectors. Geographically, Saudi Arabia and the United Arab Emirates are expected to be the largest markets, reflecting their significant population bases and robust economies. While specific growth figures for each country within the GCC are not explicitly provided, the overall market trends suggest a healthy expansion across all listed regions: Saudi Arabia, United Arab Emirates, Kuwait, Qatar, Bahrain, and Oman. Restraints such as intense competition and the environmental concerns associated with plastic packaging are present, but the market is actively responding with innovations in sustainable packaging and the development of premium product offerings.
GCC Bottled Water Industry Company Market Share
GCC Bottled Water Industry Market Dynamics & Structure
The GCC bottled water industry exhibits a moderately concentrated market structure, with key players like Nestlé SA and Danone SA holding significant market share, though newer entrants and regional players are steadily increasing their presence. Technological innovation is primarily driven by advancements in packaging materials for enhanced sustainability, improved water purification technologies, and the development of value-added functional water products. The regulatory framework is evolving, with an increasing focus on food safety standards, plastic usage reduction mandates, and public health initiatives promoting healthy hydration. Competitive product substitutes include tap water (where quality is perceived as high), flavored beverages, and other packaged drinks, influencing consumer choices. End-user demographics are shifting towards a younger, health-conscious population with higher disposable incomes, driving demand for premium and functional bottled water. Mergers and acquisitions (M&A) trends are observed, albeit at a moderate pace, as larger companies strategically acquire smaller regional players to expand their distribution networks and product portfolios. For instance, Agthia Group PJSC has actively pursued acquisitions to bolster its market position. The market is projected to see a CAGR of approximately 5.8% from 2024 to 2033, with the Total Market Size in 2025 estimated at 4,500 Million Units.
- Market Concentration: Moderately concentrated with a few dominant global players and a growing number of regional and local companies.
- Technological Drivers: Sustainable packaging, advanced filtration, and functional water formulations.
- Regulatory Focus: Food safety, plastic reduction, and health promotion.
- Competitive Landscape: Tap water, other beverages, and niche functional drinks.
- Consumer Demographics: Growing health awareness, younger population, and increased disposable income.
- M&A Activity: Strategic acquisitions by larger entities to gain market access and diversify offerings.
GCC Bottled Water Industry Growth Trends & Insights
The GCC bottled water industry is poised for substantial growth, driven by a confluence of evolving consumer preferences and robust economic development across the region. The market size evolution is projected to show a consistent upward trajectory, with an estimated market size of 4,500 Million Units in 2025, expanding significantly by the end of the forecast period. This growth is underpinned by increasing adoption rates of bottled water as a primary source of hydration, especially in urban centers where lifestyle changes and a perceived lack of tap water quality contribute to this trend. Technological disruptions are playing a crucial role, not just in improving the quality and safety of bottled water through advanced purification processes, but also in innovating packaging solutions that appeal to eco-conscious consumers. The shift towards sustainable packaging, including increased use of recycled PET (rPET) and the exploration of alternative materials, is a testament to this.
Consumer behavior is undergoing a notable transformation. There's a discernible shift away from basic hydration towards more specialized offerings. Functional water, enriched with vitamins, minerals, and natural flavors, is gaining traction as consumers seek health benefits beyond hydration. This segment is expected to witness a CAGR of 7.2% during the forecast period. Furthermore, the growing awareness of health and wellness, coupled with rising disposable incomes, is empowering consumers to opt for premium and higher-priced bottled water variants. The market penetration of bottled water is already high in many GCC countries, but the expansion into new product categories and the development of more accessible distribution channels will further deepen this penetration. The overall market size is projected to reach approximately 7,000 Million Units by 2033, indicating a sustained growth momentum. The average annual growth rate (CAGR) for the entire bottled water market in GCC is estimated to be around 5.8% from 2024 to 2033.
- Market Size Projection: Expected to grow from 4,500 Million Units in 2025 to 7,000 Million Units by 2033.
- Adoption Rates: Increasing reliance on bottled water due to urbanization, lifestyle, and perceived water quality concerns.
- Technological Impact: Innovations in purification, sustainable packaging (rPET), and functional water formulations.
- Consumer Behavior Shifts: Growing demand for health and wellness benefits, premiumization, and convenience.
- Functional Water Growth: Expected CAGR of 7.2%, driven by health-conscious consumers.
- Overall CAGR (2024-2033): Approximately 5.8%.
Dominant Regions, Countries, or Segments in GCC Bottled Water Industry
The United Arab Emirates (UAE) consistently emerges as a dominant region within the GCC bottled water industry, driven by its robust economic landscape, high population density, and a strong consumer predisposition towards convenience and premium products. Within the UAE, Dubai and Abu Dhabi lead consumption, fueled by a large expatriate population with higher disposable incomes and a generally health-conscious lifestyle. The Supermarkets/Hypermarkets distribution channel remains the most dominant, accounting for an estimated 45% of total sales in 2025, owing to their accessibility and the wide variety of brands and product types available. However, the Home and Office Delivery segment is experiencing significant growth, projected at a CAGR of 6.5%, as it caters to the increasing demand for convenience and bulk purchases, especially among families and businesses.
The Still Water segment overwhelmingly dominates the market, holding a share of over 75% in 2025. This is attributed to its universal appeal, affordability, and suitability for everyday consumption. However, Sparkling Water is a rapidly growing niche, with an anticipated CAGR of 8.1% over the forecast period, driven by evolving consumer tastes, the increasing popularity of mixology, and the availability of premium flavored sparkling options. Saudi Arabia is another critical market, representing a substantial portion of the GCC bottled water volume. Its large population and government initiatives promoting healthy living are key growth drivers. Kuwait and Qatar also contribute significantly, with high per capita consumption rates, supported by their affluent populations and a preference for bottled water over tap.
- Dominant Region: United Arab Emirates, particularly Dubai and Abu Dhabi.
- Key Countries: Saudi Arabia, Kuwait, and Qatar are significant contributors.
- Dominant Segment (Type): Still Water (over 75% market share in 2025).
- High Growth Segment (Type): Sparkling Water (projected CAGR of 8.1%).
- Dominant Distribution Channel: Supermarkets/Hypermarkets (estimated 45% market share in 2025).
- High Growth Distribution Channel: Home and Office Delivery (projected CAGR of 6.5%).
- Drivers of Dominance (UAE): Strong economy, high population density, expatriate influence, health consciousness, and convenience focus.
- Drivers of Dominance (Saudi Arabia): Large population, health initiatives, and increasing disposable incomes.
GCC Bottled Water Industry Product Landscape
The GCC bottled water industry's product landscape is characterized by a dynamic interplay of established staples and innovative offerings. Still water remains the cornerstone, with major brands focusing on purity, mineral content, and source differentiation to appeal to a broad consumer base. Product innovations in this segment include the introduction of smaller, more portable packaging sizes and the emphasis on natural mineral compositions. Sparkling water is witnessing a surge in popularity, with manufacturers introducing a wider array of flavors, including natural fruit essences and exotic blends, to attract a more discerning palate. Functional water represents a significant area of innovation, with products now infused with vitamins (e.g., B vitamins, Vitamin D), electrolytes, antioxidants, and even adaptogens, targeting specific health benefits such as enhanced immunity, stress relief, and improved cognitive function. Performance metrics are increasingly tied to perceived health benefits and taste profiles, with brands leveraging advanced purification techniques like reverse osmosis and UV treatment to assure product quality and safety. The unique selling proposition often lies in the water's source, mineral content, or functional enhancements, with technological advancements in filtration and infusion playing a key role in differentiating products in a competitive market.
Key Drivers, Barriers & Challenges in GCC Bottled Water Industry
Key Drivers:
- Growing Health and Wellness Consciousness: An increasing focus on healthy lifestyles and hydration drives demand for bottled water, particularly functional variants.
- Urbanization and Lifestyle Changes: Rapid urbanization leads to increased demand for convenient, on-the-go hydration solutions.
- Rising Disposable Incomes: Higher purchasing power allows consumers to opt for premium and specialized bottled water products.
- Perceived Tap Water Quality Concerns: In many GCC regions, consumers perceive bottled water as a safer and higher-quality alternative to tap water.
- Tourism and Hospitality Sector Growth: A thriving tourism industry increases demand for bottled water in hotels, restaurants, and tourist attractions.
Barriers & Challenges:
- Environmental Concerns over Plastic Waste: Increasing global and regional pressure to reduce single-use plastic pollution poses a significant challenge, necessitating investment in sustainable packaging.
- Intense Competition and Price Sensitivity: The market is highly competitive, with numerous players leading to price wars, especially in the basic still water segment.
- Regulatory Hurdles and Compliance Costs: Adhering to evolving food safety standards, labeling requirements, and environmental regulations can increase operational costs.
- Supply Chain Disruptions: Geopolitical factors, logistics challenges, and raw material price volatility can impact production and distribution.
- Competition from Other Beverages: The availability of a wide range of other beverage options (juices, soft drinks, etc.) creates a competitive threat for market share.
- Infrastructure Limitations: In certain areas, distribution infrastructure might limit market penetration for smaller players.
Emerging Opportunities in GCC Bottled Water Industry
Emerging opportunities within the GCC bottled water industry lie in the burgeoning demand for premium and artisanal bottled water, catering to a niche market segment willing to pay a premium for unique sourcing, mineral profiles, and sustainable packaging. The expansion of functional water categories continues to present significant potential, with opportunities to introduce products tailored to specific needs like athletic performance, cognitive enhancement, and immune support. Furthermore, the growing emphasis on sustainability opens doors for innovative packaging solutions, including the increased adoption of rPET, biodegradable materials, and reusable bottle systems, which can be a strong differentiator. The e-commerce and direct-to-consumer (DTC) models are also gaining traction, offering a direct channel to engage with consumers and build brand loyalty, particularly for specialized or subscription-based offerings. Untapped potential exists in developing and marketing water solutions for specific demographics, such as children and the elderly, with tailored nutritional benefits and packaging.
Growth Accelerators in the GCC Bottled Water Industry Industry
Several catalysts are accelerating the long-term growth of the GCC bottled water industry. Technological breakthroughs in water purification and filtration are consistently enhancing product quality and safety, building consumer trust. The development of advanced sustainable packaging solutions, moving beyond traditional plastics, is a significant growth accelerator, aligning with consumer and regulatory demands. Strategic partnerships between water producers and health and wellness brands or influencers can amplify reach and build credibility for functional water offerings. Furthermore, market expansion strategies, including penetrating underserved geographical areas within countries or expanding into adjacent product categories like flavored waters or premium sparkling variants, are crucial growth drivers. The increasing focus by governments on promoting healthy lifestyles through various initiatives also indirectly fuels the demand for bottled water.
Key Players Shaping the GCC Bottled Water Industry Market
- Danone SA
- Nestlé SA
- Crystal Mineral Water & Refreshments LLC Co
- Masafi Inc
- Agthia Group PJSC
- PepsiCo Inc
- Al-Qassim Water
- New Technology Bottling Company (NTBC) KSCC
- ALGhadeer Drinking Water LLC
- Al-Rawdatain Water Bottling Co
- Al Furat Drinking Water LLC
Notable Milestones in GCC Bottled Water Industry Sector
- 2019: Increased focus on sustainability initiatives, with major players launching campaigns for plastic reduction and recycling.
- 2020: COVID-19 pandemic leads to a surge in demand for bottled water due to hygiene concerns and increased home consumption.
- 2021: Introduction of new functional water variants catering to immunity and wellness trends gains traction.
- 2022: Agthia Group PJSC completes several key acquisitions, significantly expanding its market share and product portfolio.
- 2023: Growing adoption of recycled PET (rPET) packaging by leading companies in response to environmental pressures.
- 2024: Increased investment in e-commerce and direct-to-consumer channels to reach a wider customer base.
- 2025 (Estimated): Continued growth in the functional and sparkling water segments, with significant market share gains.
In-Depth GCC Bottled Water Industry Market Outlook
The future of the GCC bottled water industry appears robust, with continued expansion fueled by evolving consumer preferences and supportive economic conditions. Key growth accelerators such as technological advancements in product development and sustainable packaging will solidify market gains. Strategic partnerships and aggressive market expansion will be crucial for companies aiming to capture a larger share. The overarching trend towards health and wellness, coupled with increasing disposable incomes, positions the industry for sustained growth. Significant opportunities lie in further segmenting the market with specialized functional waters, premium offerings, and eco-friendly alternatives. The industry's outlook is optimistic, with an anticipated market size of approximately 7,000 Million Units by 2033, driven by innovation, sustainability, and a deepening consumer commitment to hydration.
GCC Bottled Water Industry Segmentation
-
1. Type
- 1.1. Still Water
- 1.2. Sparkling Water
- 1.3. Functional Water
-
2. Distribution Channel
- 2.1. Supermarkets/Hypermarkets
- 2.2. Convenience/Grocery Stores
- 2.3. On-trade Channels
- 2.4. Home and Office Delivery
- 2.5. Other Distribution Channels
-
3. Geography
- 3.1. Saudi Arabia
- 3.2. United Arab Emirates
- 3.3. Kuwait
- 3.4. Qatar
- 3.5. Bahrain
- 3.6. Oman
GCC Bottled Water Industry Segmentation By Geography
- 1. Saudi Arabia
- 2. United Arab Emirates
- 3. Kuwait
- 4. Qatar
- 5. Bahrain
- 6. Oman
GCC Bottled Water Industry Regional Market Share
Geographic Coverage of GCC Bottled Water Industry
GCC Bottled Water Industry REPORT HIGHLIGHTS
| Aspects | Details |
|---|---|
| Study Period | 2020-2034 |
| Base Year | 2025 |
| Estimated Year | 2026 |
| Forecast Period | 2026-2034 |
| Historical Period | 2020-2025 |
| Growth Rate | CAGR of 11.16% from 2020-2034 |
| Segmentation |
|
Table of Contents
- 1. Introduction
- 1.1. Research Scope
- 1.2. Market Segmentation
- 1.3. Research Objective
- 1.4. Definitions and Assumptions
- 2. Executive Summary
- 2.1. Market Snapshot
- 3. Market Dynamics
- 3.1. Market Drivers
- 3.2. Market Restrains
- 3.3. Market Trends
- 3.4. Market Opportunities
- 4. Market Factor Analysis
- 4.1. Porters Five Forces
- 4.1.1. Bargaining Power of Suppliers
- 4.1.2. Bargaining Power of Buyers
- 4.1.3. Threat of New Entrants
- 4.1.4. Threat of Substitutes
- 4.1.5. Competitive Rivalry
- 4.2. PESTEL analysis
- 4.3. BCG Analysis
- 4.3.1. Stars (High Growth, High Market Share)
- 4.3.2. Cash Cows (Low Growth, High Market Share)
- 4.3.3. Question Mark (High Growth, Low Market Share)
- 4.3.4. Dogs (Low Growth, Low Market Share)
- 4.4. Ansoff Matrix Analysis
- 4.5. Supply Chain Analysis
- 4.6. Regulatory Landscape
- 4.7. Current Market Potential and Opportunity Assessment (TAM–SAM–SOM Framework)
- 4.8. VDR Analyst Note
- 4.1. Porters Five Forces
- 5. Market Analysis, Insights and Forecast 2021-2033
- 5.1. Market Analysis, Insights and Forecast - by Type
- 5.1.1. Still Water
- 5.1.2. Sparkling Water
- 5.1.3. Functional Water
- 5.2. Market Analysis, Insights and Forecast - by Distribution Channel
- 5.2.1. Supermarkets/Hypermarkets
- 5.2.2. Convenience/Grocery Stores
- 5.2.3. On-trade Channels
- 5.2.4. Home and Office Delivery
- 5.2.5. Other Distribution Channels
- 5.3. Market Analysis, Insights and Forecast - by Geography
- 5.3.1. Saudi Arabia
- 5.3.2. United Arab Emirates
- 5.3.3. Kuwait
- 5.3.4. Qatar
- 5.3.5. Bahrain
- 5.3.6. Oman
- 5.4. Market Analysis, Insights and Forecast - by Region
- 5.4.1. Saudi Arabia
- 5.4.2. United Arab Emirates
- 5.4.3. Kuwait
- 5.4.4. Qatar
- 5.4.5. Bahrain
- 5.4.6. Oman
- 5.1. Market Analysis, Insights and Forecast - by Type
- 6. Global GCC Bottled Water Industry Analysis, Insights and Forecast, 2021-2033
- 6.1. Market Analysis, Insights and Forecast - by Type
- 6.1.1. Still Water
- 6.1.2. Sparkling Water
- 6.1.3. Functional Water
- 6.2. Market Analysis, Insights and Forecast - by Distribution Channel
- 6.2.1. Supermarkets/Hypermarkets
- 6.2.2. Convenience/Grocery Stores
- 6.2.3. On-trade Channels
- 6.2.4. Home and Office Delivery
- 6.2.5. Other Distribution Channels
- 6.3. Market Analysis, Insights and Forecast - by Geography
- 6.3.1. Saudi Arabia
- 6.3.2. United Arab Emirates
- 6.3.3. Kuwait
- 6.3.4. Qatar
- 6.3.5. Bahrain
- 6.3.6. Oman
- 6.1. Market Analysis, Insights and Forecast - by Type
- 7. Saudi Arabia GCC Bottled Water Industry Analysis, Insights and Forecast, 2021-2033
- 7.1. Market Analysis, Insights and Forecast - by Type
- 7.1.1. Still Water
- 7.1.2. Sparkling Water
- 7.1.3. Functional Water
- 7.2. Market Analysis, Insights and Forecast - by Distribution Channel
- 7.2.1. Supermarkets/Hypermarkets
- 7.2.2. Convenience/Grocery Stores
- 7.2.3. On-trade Channels
- 7.2.4. Home and Office Delivery
- 7.2.5. Other Distribution Channels
- 7.3. Market Analysis, Insights and Forecast - by Geography
- 7.3.1. Saudi Arabia
- 7.3.2. United Arab Emirates
- 7.3.3. Kuwait
- 7.3.4. Qatar
- 7.3.5. Bahrain
- 7.3.6. Oman
- 7.1. Market Analysis, Insights and Forecast - by Type
- 8. United Arab Emirates GCC Bottled Water Industry Analysis, Insights and Forecast, 2021-2033
- 8.1. Market Analysis, Insights and Forecast - by Type
- 8.1.1. Still Water
- 8.1.2. Sparkling Water
- 8.1.3. Functional Water
- 8.2. Market Analysis, Insights and Forecast - by Distribution Channel
- 8.2.1. Supermarkets/Hypermarkets
- 8.2.2. Convenience/Grocery Stores
- 8.2.3. On-trade Channels
- 8.2.4. Home and Office Delivery
- 8.2.5. Other Distribution Channels
- 8.3. Market Analysis, Insights and Forecast - by Geography
- 8.3.1. Saudi Arabia
- 8.3.2. United Arab Emirates
- 8.3.3. Kuwait
- 8.3.4. Qatar
- 8.3.5. Bahrain
- 8.3.6. Oman
- 8.1. Market Analysis, Insights and Forecast - by Type
- 9. Kuwait GCC Bottled Water Industry Analysis, Insights and Forecast, 2021-2033
- 9.1. Market Analysis, Insights and Forecast - by Type
- 9.1.1. Still Water
- 9.1.2. Sparkling Water
- 9.1.3. Functional Water
- 9.2. Market Analysis, Insights and Forecast - by Distribution Channel
- 9.2.1. Supermarkets/Hypermarkets
- 9.2.2. Convenience/Grocery Stores
- 9.2.3. On-trade Channels
- 9.2.4. Home and Office Delivery
- 9.2.5. Other Distribution Channels
- 9.3. Market Analysis, Insights and Forecast - by Geography
- 9.3.1. Saudi Arabia
- 9.3.2. United Arab Emirates
- 9.3.3. Kuwait
- 9.3.4. Qatar
- 9.3.5. Bahrain
- 9.3.6. Oman
- 9.1. Market Analysis, Insights and Forecast - by Type
- 10. Qatar GCC Bottled Water Industry Analysis, Insights and Forecast, 2021-2033
- 10.1. Market Analysis, Insights and Forecast - by Type
- 10.1.1. Still Water
- 10.1.2. Sparkling Water
- 10.1.3. Functional Water
- 10.2. Market Analysis, Insights and Forecast - by Distribution Channel
- 10.2.1. Supermarkets/Hypermarkets
- 10.2.2. Convenience/Grocery Stores
- 10.2.3. On-trade Channels
- 10.2.4. Home and Office Delivery
- 10.2.5. Other Distribution Channels
- 10.3. Market Analysis, Insights and Forecast - by Geography
- 10.3.1. Saudi Arabia
- 10.3.2. United Arab Emirates
- 10.3.3. Kuwait
- 10.3.4. Qatar
- 10.3.5. Bahrain
- 10.3.6. Oman
- 10.1. Market Analysis, Insights and Forecast - by Type
- 11. Bahrain GCC Bottled Water Industry Analysis, Insights and Forecast, 2021-2033
- 11.1. Market Analysis, Insights and Forecast - by Type
- 11.1.1. Still Water
- 11.1.2. Sparkling Water
- 11.1.3. Functional Water
- 11.2. Market Analysis, Insights and Forecast - by Distribution Channel
- 11.2.1. Supermarkets/Hypermarkets
- 11.2.2. Convenience/Grocery Stores
- 11.2.3. On-trade Channels
- 11.2.4. Home and Office Delivery
- 11.2.5. Other Distribution Channels
- 11.3. Market Analysis, Insights and Forecast - by Geography
- 11.3.1. Saudi Arabia
- 11.3.2. United Arab Emirates
- 11.3.3. Kuwait
- 11.3.4. Qatar
- 11.3.5. Bahrain
- 11.3.6. Oman
- 11.1. Market Analysis, Insights and Forecast - by Type
- 12. Oman GCC Bottled Water Industry Analysis, Insights and Forecast, 2021-2033
- 12.1. Market Analysis, Insights and Forecast - by Type
- 12.1.1. Still Water
- 12.1.2. Sparkling Water
- 12.1.3. Functional Water
- 12.2. Market Analysis, Insights and Forecast - by Distribution Channel
- 12.2.1. Supermarkets/Hypermarkets
- 12.2.2. Convenience/Grocery Stores
- 12.2.3. On-trade Channels
- 12.2.4. Home and Office Delivery
- 12.2.5. Other Distribution Channels
- 12.3. Market Analysis, Insights and Forecast - by Geography
- 12.3.1. Saudi Arabia
- 12.3.2. United Arab Emirates
- 12.3.3. Kuwait
- 12.3.4. Qatar
- 12.3.5. Bahrain
- 12.3.6. Oman
- 12.1. Market Analysis, Insights and Forecast - by Type
- 13. Competitive Analysis
- 13.1. Company Profiles
- 13.1.1 Danone SA*List Not Exhaustive
- 13.1.1.1. Company Overview
- 13.1.1.2. Products
- 13.1.1.3. Company Financials
- 13.1.1.4. SWOT Analysis
- 13.1.2 Nestle SA
- 13.1.2.1. Company Overview
- 13.1.2.2. Products
- 13.1.2.3. Company Financials
- 13.1.2.4. SWOT Analysis
- 13.1.3 Crystal Mineral Water & Refreshments LLC Co
- 13.1.3.1. Company Overview
- 13.1.3.2. Products
- 13.1.3.3. Company Financials
- 13.1.3.4. SWOT Analysis
- 13.1.4 Masafi Inc
- 13.1.4.1. Company Overview
- 13.1.4.2. Products
- 13.1.4.3. Company Financials
- 13.1.4.4. SWOT Analysis
- 13.1.5 Agthia Group PJSC
- 13.1.5.1. Company Overview
- 13.1.5.2. Products
- 13.1.5.3. Company Financials
- 13.1.5.4. SWOT Analysis
- 13.1.6 PepsiCo Inc
- 13.1.6.1. Company Overview
- 13.1.6.2. Products
- 13.1.6.3. Company Financials
- 13.1.6.4. SWOT Analysis
- 13.1.7 Al-Qassim Water
- 13.1.7.1. Company Overview
- 13.1.7.2. Products
- 13.1.7.3. Company Financials
- 13.1.7.4. SWOT Analysis
- 13.1.8 New Technology Bottling Company (NTBC) KSCC
- 13.1.8.1. Company Overview
- 13.1.8.2. Products
- 13.1.8.3. Company Financials
- 13.1.8.4. SWOT Analysis
- 13.1.9 ALGhadeer Drinking Water LLC
- 13.1.9.1. Company Overview
- 13.1.9.2. Products
- 13.1.9.3. Company Financials
- 13.1.9.4. SWOT Analysis
- 13.1.10 Al-Rawdatain Water Bottling Co
- 13.1.10.1. Company Overview
- 13.1.10.2. Products
- 13.1.10.3. Company Financials
- 13.1.10.4. SWOT Analysis
- 13.1.11 Al Furat Drinking Water LLC
- 13.1.11.1. Company Overview
- 13.1.11.2. Products
- 13.1.11.3. Company Financials
- 13.1.11.4. SWOT Analysis
- 13.1.1 Danone SA*List Not Exhaustive
- 13.2. Market Entropy
- 13.2.1 Company's Key Areas Served
- 13.2.2 Recent Developments
- 13.3. Company Market Share Analysis 2025
- 13.3.1 Top 5 Companies Market Share Analysis
- 13.3.2 Top 3 Companies Market Share Analysis
- 13.4. List of Potential Customers
- 14. Research Methodology
List of Figures
- Figure 1: Global GCC Bottled Water Industry Revenue Breakdown (Million, %) by Region 2025 & 2033
- Figure 2: Saudi Arabia GCC Bottled Water Industry Revenue (Million), by Type 2025 & 2033
- Figure 3: Saudi Arabia GCC Bottled Water Industry Revenue Share (%), by Type 2025 & 2033
- Figure 4: Saudi Arabia GCC Bottled Water Industry Revenue (Million), by Distribution Channel 2025 & 2033
- Figure 5: Saudi Arabia GCC Bottled Water Industry Revenue Share (%), by Distribution Channel 2025 & 2033
- Figure 6: Saudi Arabia GCC Bottled Water Industry Revenue (Million), by Geography 2025 & 2033
- Figure 7: Saudi Arabia GCC Bottled Water Industry Revenue Share (%), by Geography 2025 & 2033
- Figure 8: Saudi Arabia GCC Bottled Water Industry Revenue (Million), by Country 2025 & 2033
- Figure 9: Saudi Arabia GCC Bottled Water Industry Revenue Share (%), by Country 2025 & 2033
- Figure 10: United Arab Emirates GCC Bottled Water Industry Revenue (Million), by Type 2025 & 2033
- Figure 11: United Arab Emirates GCC Bottled Water Industry Revenue Share (%), by Type 2025 & 2033
- Figure 12: United Arab Emirates GCC Bottled Water Industry Revenue (Million), by Distribution Channel 2025 & 2033
- Figure 13: United Arab Emirates GCC Bottled Water Industry Revenue Share (%), by Distribution Channel 2025 & 2033
- Figure 14: United Arab Emirates GCC Bottled Water Industry Revenue (Million), by Geography 2025 & 2033
- Figure 15: United Arab Emirates GCC Bottled Water Industry Revenue Share (%), by Geography 2025 & 2033
- Figure 16: United Arab Emirates GCC Bottled Water Industry Revenue (Million), by Country 2025 & 2033
- Figure 17: United Arab Emirates GCC Bottled Water Industry Revenue Share (%), by Country 2025 & 2033
- Figure 18: Kuwait GCC Bottled Water Industry Revenue (Million), by Type 2025 & 2033
- Figure 19: Kuwait GCC Bottled Water Industry Revenue Share (%), by Type 2025 & 2033
- Figure 20: Kuwait GCC Bottled Water Industry Revenue (Million), by Distribution Channel 2025 & 2033
- Figure 21: Kuwait GCC Bottled Water Industry Revenue Share (%), by Distribution Channel 2025 & 2033
- Figure 22: Kuwait GCC Bottled Water Industry Revenue (Million), by Geography 2025 & 2033
- Figure 23: Kuwait GCC Bottled Water Industry Revenue Share (%), by Geography 2025 & 2033
- Figure 24: Kuwait GCC Bottled Water Industry Revenue (Million), by Country 2025 & 2033
- Figure 25: Kuwait GCC Bottled Water Industry Revenue Share (%), by Country 2025 & 2033
- Figure 26: Qatar GCC Bottled Water Industry Revenue (Million), by Type 2025 & 2033
- Figure 27: Qatar GCC Bottled Water Industry Revenue Share (%), by Type 2025 & 2033
- Figure 28: Qatar GCC Bottled Water Industry Revenue (Million), by Distribution Channel 2025 & 2033
- Figure 29: Qatar GCC Bottled Water Industry Revenue Share (%), by Distribution Channel 2025 & 2033
- Figure 30: Qatar GCC Bottled Water Industry Revenue (Million), by Geography 2025 & 2033
- Figure 31: Qatar GCC Bottled Water Industry Revenue Share (%), by Geography 2025 & 2033
- Figure 32: Qatar GCC Bottled Water Industry Revenue (Million), by Country 2025 & 2033
- Figure 33: Qatar GCC Bottled Water Industry Revenue Share (%), by Country 2025 & 2033
- Figure 34: Bahrain GCC Bottled Water Industry Revenue (Million), by Type 2025 & 2033
- Figure 35: Bahrain GCC Bottled Water Industry Revenue Share (%), by Type 2025 & 2033
- Figure 36: Bahrain GCC Bottled Water Industry Revenue (Million), by Distribution Channel 2025 & 2033
- Figure 37: Bahrain GCC Bottled Water Industry Revenue Share (%), by Distribution Channel 2025 & 2033
- Figure 38: Bahrain GCC Bottled Water Industry Revenue (Million), by Geography 2025 & 2033
- Figure 39: Bahrain GCC Bottled Water Industry Revenue Share (%), by Geography 2025 & 2033
- Figure 40: Bahrain GCC Bottled Water Industry Revenue (Million), by Country 2025 & 2033
- Figure 41: Bahrain GCC Bottled Water Industry Revenue Share (%), by Country 2025 & 2033
- Figure 42: Oman GCC Bottled Water Industry Revenue (Million), by Type 2025 & 2033
- Figure 43: Oman GCC Bottled Water Industry Revenue Share (%), by Type 2025 & 2033
- Figure 44: Oman GCC Bottled Water Industry Revenue (Million), by Distribution Channel 2025 & 2033
- Figure 45: Oman GCC Bottled Water Industry Revenue Share (%), by Distribution Channel 2025 & 2033
- Figure 46: Oman GCC Bottled Water Industry Revenue (Million), by Geography 2025 & 2033
- Figure 47: Oman GCC Bottled Water Industry Revenue Share (%), by Geography 2025 & 2033
- Figure 48: Oman GCC Bottled Water Industry Revenue (Million), by Country 2025 & 2033
- Figure 49: Oman GCC Bottled Water Industry Revenue Share (%), by Country 2025 & 2033
List of Tables
- Table 1: Global GCC Bottled Water Industry Revenue Million Forecast, by Type 2020 & 2033
- Table 2: Global GCC Bottled Water Industry Revenue Million Forecast, by Distribution Channel 2020 & 2033
- Table 3: Global GCC Bottled Water Industry Revenue Million Forecast, by Geography 2020 & 2033
- Table 4: Global GCC Bottled Water Industry Revenue Million Forecast, by Region 2020 & 2033
- Table 5: Global GCC Bottled Water Industry Revenue Million Forecast, by Type 2020 & 2033
- Table 6: Global GCC Bottled Water Industry Revenue Million Forecast, by Distribution Channel 2020 & 2033
- Table 7: Global GCC Bottled Water Industry Revenue Million Forecast, by Geography 2020 & 2033
- Table 8: Global GCC Bottled Water Industry Revenue Million Forecast, by Country 2020 & 2033
- Table 9: Global GCC Bottled Water Industry Revenue Million Forecast, by Type 2020 & 2033
- Table 10: Global GCC Bottled Water Industry Revenue Million Forecast, by Distribution Channel 2020 & 2033
- Table 11: Global GCC Bottled Water Industry Revenue Million Forecast, by Geography 2020 & 2033
- Table 12: Global GCC Bottled Water Industry Revenue Million Forecast, by Country 2020 & 2033
- Table 13: Global GCC Bottled Water Industry Revenue Million Forecast, by Type 2020 & 2033
- Table 14: Global GCC Bottled Water Industry Revenue Million Forecast, by Distribution Channel 2020 & 2033
- Table 15: Global GCC Bottled Water Industry Revenue Million Forecast, by Geography 2020 & 2033
- Table 16: Global GCC Bottled Water Industry Revenue Million Forecast, by Country 2020 & 2033
- Table 17: Global GCC Bottled Water Industry Revenue Million Forecast, by Type 2020 & 2033
- Table 18: Global GCC Bottled Water Industry Revenue Million Forecast, by Distribution Channel 2020 & 2033
- Table 19: Global GCC Bottled Water Industry Revenue Million Forecast, by Geography 2020 & 2033
- Table 20: Global GCC Bottled Water Industry Revenue Million Forecast, by Country 2020 & 2033
- Table 21: Global GCC Bottled Water Industry Revenue Million Forecast, by Type 2020 & 2033
- Table 22: Global GCC Bottled Water Industry Revenue Million Forecast, by Distribution Channel 2020 & 2033
- Table 23: Global GCC Bottled Water Industry Revenue Million Forecast, by Geography 2020 & 2033
- Table 24: Global GCC Bottled Water Industry Revenue Million Forecast, by Country 2020 & 2033
- Table 25: Global GCC Bottled Water Industry Revenue Million Forecast, by Type 2020 & 2033
- Table 26: Global GCC Bottled Water Industry Revenue Million Forecast, by Distribution Channel 2020 & 2033
- Table 27: Global GCC Bottled Water Industry Revenue Million Forecast, by Geography 2020 & 2033
- Table 28: Global GCC Bottled Water Industry Revenue Million Forecast, by Country 2020 & 2033
Frequently Asked Questions
1. What is the projected Compound Annual Growth Rate (CAGR) of the GCC Bottled Water Industry?
The projected CAGR is approximately 11.16%.
2. Which companies are prominent players in the GCC Bottled Water Industry?
Key companies in the market include Danone SA*List Not Exhaustive, Nestle SA, Crystal Mineral Water & Refreshments LLC Co, Masafi Inc, Agthia Group PJSC, PepsiCo Inc, Al-Qassim Water, New Technology Bottling Company (NTBC) KSCC, ALGhadeer Drinking Water LLC, Al-Rawdatain Water Bottling Co, Al Furat Drinking Water LLC.
3. What are the main segments of the GCC Bottled Water Industry?
The market segments include Type, Distribution Channel, Geography.
4. Can you provide details about the market size?
The market size is estimated to be USD 6.79 Million as of 2022.
5. What are some drivers contributing to market growth?
Growth In Foodservice Expenditure and Tourism Sector; Premiumization with the Growth of Fortified and Flavored Water.
6. What are the notable trends driving market growth?
Scarce Water Resources Leading to Increasing Dependency on Packaged Drinking Water.
7. Are there any restraints impacting market growth?
Concerns Regarding Plastic Waste and the Rising Inclination Toward Tap Water.
8. Can you provide examples of recent developments in the market?
N/A
9. What pricing options are available for accessing the report?
Pricing options include single-user, multi-user, and enterprise licenses priced at USD 4750, USD 5250, and USD 8750 respectively.
10. Is the market size provided in terms of value or volume?
The market size is provided in terms of value, measured in Million.
11. Are there any specific market keywords associated with the report?
Yes, the market keyword associated with the report is "GCC Bottled Water Industry," which aids in identifying and referencing the specific market segment covered.
12. How do I determine which pricing option suits my needs best?
The pricing options vary based on user requirements and access needs. Individual users may opt for single-user licenses, while businesses requiring broader access may choose multi-user or enterprise licenses for cost-effective access to the report.
13. Are there any additional resources or data provided in the GCC Bottled Water Industry report?
While the report offers comprehensive insights, it's advisable to review the specific contents or supplementary materials provided to ascertain if additional resources or data are available.
14. How can I stay updated on further developments or reports in the GCC Bottled Water Industry?
To stay informed about further developments, trends, and reports in the GCC Bottled Water Industry, consider subscribing to industry newsletters, following relevant companies and organizations, or regularly checking reputable industry news sources and publications.
Methodology
Step 1 - Identification of Relevant Samples Size from Population Database


Step 2 - Approaches for Defining Global Market Size (Value, Volume* & Price*)

Note*: In applicable scenarios
Step 3 - Data Sources
Primary Research
- Web Analytics
- Survey Reports
- Research Institute
- Latest Research Reports
- Opinion Leaders
Secondary Research
- Annual Reports
- White Paper
- Latest Press Release
- Industry Association
- Paid Database
- Investor Presentations

Step 4 - Data Triangulation
Involves using different sources of information in order to increase the validity of a study
These sources are likely to be stakeholders in a program - participants, other researchers, program staff, other community members, and so on.
Then we put all data in single framework & apply various statistical tools to find out the dynamic on the market.
During the analysis stage, feedback from the stakeholder groups would be compared to determine areas of agreement as well as areas of divergence