

Key Insights
The Middle East & Africa (MEA) Gluten-Free Food Market is projected for robust expansion, driven by increased awareness of celiac disease, gluten sensitivities, and a significant consumer shift towards healthier lifestyles. This heightened demand for gluten-free alternatives is accelerating across the region. The market is supported by a strong Compound Annual Growth Rate (CAGR) of 10.2%, indicating a sustained upward trajectory. Growth is further propelled by the expanding availability of gluten-free products across diverse channels, including e-commerce and prominent supermarket chains catering to specialized dietary needs. Key product segments like bakery, confectionery, dairy-free alternatives, and snacks are experiencing considerable demand, reflecting evolving consumer preferences for convenience and health-conscious choices.
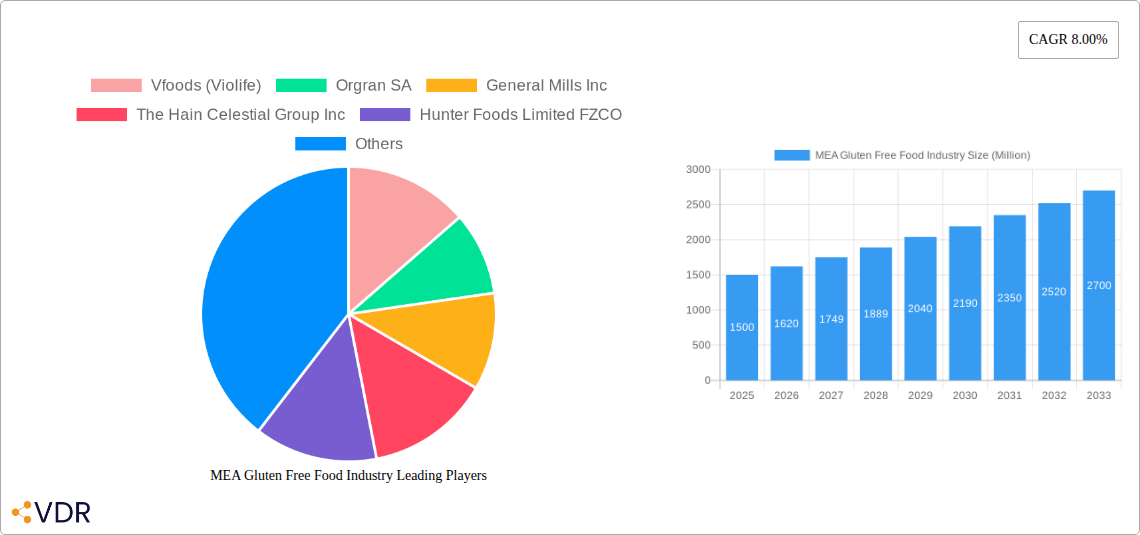
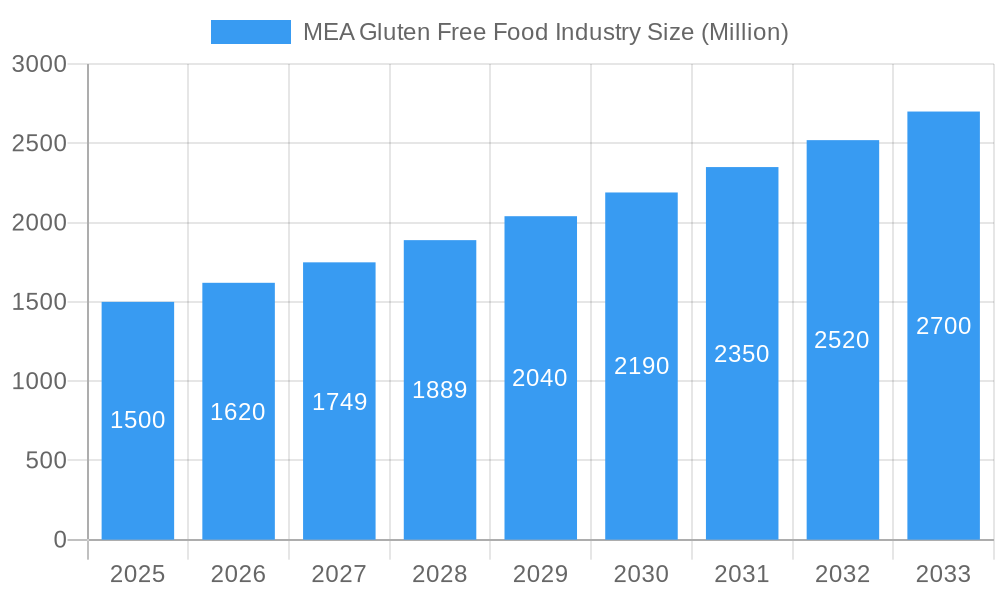
MEA Gluten Free Food Industry Market Size (In Billion)
Emerging trends such as the rise of plant-based and allergen-free options, which frequently align with gluten-free requirements, are broadening the consumer base. While challenges like higher ingredient costs and regional availability persist, they are being addressed through innovation and strategic alliances. Leading companies are investing in product development and distribution network expansion to capture market share, particularly in economies with rising disposable incomes. The market size was valued at $8.5 billion in the base year 2025.
MEA Gluten Free Food Industry Company Market Share
MEA Gluten Free Food Industry: Comprehensive Market Report 2019-2033
This in-depth report provides a strategic analysis of the Middle East and Africa (MEA) Gluten Free Food Industry, offering critical insights for stakeholders navigating this dynamic market. Covering the historical period from 2019-2024 and forecasting growth through 2033, this study delves into market size, segmentation, regional dominance, competitive landscape, and emerging opportunities. With a focus on quantitative data and actionable intelligence, this report is an indispensable resource for understanding the present and future trajectory of the MEA gluten-free food sector.
MEA Gluten Free Food Industry Market Dynamics & Structure
The MEA Gluten Free Food Industry is characterized by a moderately concentrated market structure, with a few key players holding significant shares, particularly in segments like Gluten Free and Bakery and Confectionery. Technological innovation is a significant driver, fueled by advancements in processing techniques and ingredient development, enabling the creation of palatable and diverse gluten-free alternatives. Regulatory frameworks are evolving, with increased focus on clear labeling and allergen management, positively impacting consumer trust and market expansion. Competitive product substitutes, such as naturally gluten-free grains and other specialized dietary foods, present both challenges and opportunities for market players. End-user demographics are increasingly sophisticated, with growing awareness of health and wellness driving demand for gluten-free options among both diagnosed celiacs and health-conscious consumers. Mergers and acquisitions (M&A) activity, while not yet at peak levels, is expected to intensify as larger players seek to expand their portfolios and market reach. For instance, the past five years have seen approximately 2-3 significant M&A deals aimed at consolidating market share in key regions. Innovation barriers include the high cost of specialized ingredient sourcing and the need for dedicated production facilities to prevent cross-contamination.
- Market Concentration: Moderate, with established players dominating key segments.
- Technological Innovation: Driven by ingredient advancements and processing techniques.
- Regulatory Frameworks: Evolving towards clearer labeling and allergen control.
- Competitive Substitutes: Naturally gluten-free grains and other specialized diets.
- End-User Demographics: Expanding beyond celiacs to health-conscious consumers.
- M&A Trends: Nascent but expected to grow, with an estimated 2-3 deals in the last five years.
- Innovation Barriers: High ingredient costs and specialized production requirements.
MEA Gluten Free Food Industry Growth Trends & Insights
The MEA Gluten Free Food Industry is poised for robust growth, driven by a confluence of escalating health consciousness and increased dietary awareness across the region. The market size is projected to reach an estimated value of XXX Million units by 2025, reflecting a significant upward trajectory from historical figures. This expansion is fueled by a growing prevalence of celiac disease diagnoses and a broader consumer adoption of gluten-free diets for perceived health benefits, contributing to an estimated CAGR of XX% over the forecast period (2025-2033). Technological disruptions are playing a pivotal role, with innovations in alternative flour blends and baking technologies enhancing the taste, texture, and affordability of gluten-free products, thereby improving adoption rates. Consumer behavior shifts are evident, with a noticeable move towards actively seeking out certified gluten-free products, irrespective of specific medical needs. This trend is further amplified by an increasing availability of these products across various retail channels. Market penetration is expected to deepen considerably, particularly in urban centers, as awareness campaigns and the expansion of the product landscape cater to a wider audience. The historical period (2019-2024) has laid the groundwork for this accelerated growth, with steady increases in product introductions and consumer trial. The demand for dairy-free and allergen-free options within the gluten-free spectrum is also witnessing a substantial surge, indicating a more holistic approach to dietary needs by consumers.
Dominant Regions, Countries, or Segments in MEA Gluten Free Food Industry
The Bakery and Confectionery segment is currently the dominant force driving growth within the MEA Gluten Free Food Industry, exhibiting a commanding market share estimated at XX% of the total market value in 2025. This dominance is attributed to the inherent versatility of gluten-free ingredients in creating familiar and desirable products like bread, cakes, cookies, and pastries, which are staples in most diets across the region. Within this segment, Gluten Free products constitute the largest sub-segment, accounting for approximately XX% of the overall gluten-free food market. The United Arab Emirates (UAE) stands out as the leading country in the MEA region, spearheading market growth due to its cosmopolitan population, high disposable incomes, and proactive stance on health and wellness initiatives. The UAE's robust retail infrastructure, encompassing a high concentration of Supermarkets/Hypermarkets (representing XX% of distribution), further facilitates the accessibility of gluten-free products.
- Dominant End Product Segment: Bakery and Confectionery, holding an estimated XX% market share in 2025.
- Key Products: Breads, cakes, cookies, pastries, and other baked goods.
- Drivers: Cultural significance of baked goods, demand for accessible gluten-free alternatives.
- Dominant Type Segment: Gluten Free, comprising approximately XX% of the overall market.
- Drivers: Increasing diagnoses of celiac disease and a growing trend towards gluten-free lifestyles.
- Leading Country: United Arab Emirates (UAE).
- Factors driving dominance: High disposable income, health-conscious population, advanced retail infrastructure, significant expatriate population.
- Dominant Distribution Channel: Supermarkets/Hypermarkets, accounting for an estimated XX% of sales.
- Reasons for dominance: Wide product availability, convenience, and established consumer shopping habits.
- Growth Potential in Other Segments:
- Dairy Free Foods: Significant growth potential driven by lactose intolerance and plant-based dietary trends.
- Snacks: Increasing demand for convenient, healthy, and gluten-free snack options.
- Beverages: Emerging opportunities with the introduction of gluten-free beers, juices, and other specialized drinks.
- Online Retail Stores: Experiencing rapid growth, particularly in urban centers, offering wider product selection and home delivery.
MEA Gluten Free Food Industry Product Landscape
The MEA Gluten Free Food Industry is witnessing a surge in product innovation, focusing on enhancing taste, texture, and nutritional value. Manufacturers are investing in research and development to create gluten-free alternatives that closely mimic the sensory appeal of conventional products. Key advancements include the development of novel flour blends using ingredients like almond, coconut, and tapioca, which offer improved baking properties and a more appealing flavor profile. Furthermore, there's a growing emphasis on fortified gluten-free products, incorporating essential vitamins and minerals to address potential nutritional gaps. Unique selling propositions are often centered around "free-from" claims beyond gluten, such as dairy-free, soy-free, and nut-free formulations, catering to a broader range of dietary needs. Technological advancements in extrusion and emulsification are enabling the creation of a wider variety of gluten-free snacks and ready-to-eat meals with better shelf stability and convenience.
Key Drivers, Barriers & Challenges in MEA Gluten Free Food Industry
Key Drivers:
The MEA Gluten Free Food Industry is propelled by several critical factors. Increasing awareness of celiac disease and gluten sensitivity, coupled with a growing global trend towards healthier lifestyles, are primary demand drivers. Government initiatives promoting health and wellness, alongside rising disposable incomes in many MEA countries, are further bolstering consumer spending on specialized dietary products. Technological advancements in food processing and ingredient sourcing are making gluten-free products more accessible and palatable. For instance, the development of advanced emulsifiers has significantly improved the texture of gluten-free baked goods.
Barriers & Challenges:
Despite its growth potential, the industry faces significant hurdles. High production costs associated with specialized ingredients and manufacturing processes can lead to premium pricing, limiting affordability for a larger segment of the population. Stringent regulatory requirements for gluten-free certification and labeling can pose a challenge for smaller manufacturers. Furthermore, the limited availability of raw materials in some regions and the complexities of supply chain management for niche products contribute to operational challenges. Competitive pressures from established food manufacturers introducing their own gluten-free lines and the perceived inconvenience of gluten-free diets for some consumers also present ongoing restraints. Supply chain disruptions, as observed during recent global events, can severely impact the availability of key ingredients, leading to stockouts and increased costs, estimated to impact market availability by XX% during such periods.
Emerging Opportunities in MEA Gluten Free Food Industry
Emerging opportunities within the MEA Gluten Free Food Industry lie in catering to niche dietary needs and expanding into underserved markets. The growing demand for allergen-free and plant-based gluten-free options presents a significant avenue for innovation, as consumers increasingly seek products that address multiple dietary restrictions simultaneously. Untapped markets in Africa, beyond the more developed MEA regions, offer substantial growth potential as awareness of gluten-related disorders and healthy eating practices expands. Innovative applications, such as gluten-free flours for everyday cooking and baking beyond specialized products, can further broaden consumer adoption. The development of fortified gluten-free snacks and convenience meals tailored to local taste preferences also represents a promising opportunity.
Growth Accelerators in the MEA Gluten Free Food Industry Industry
Several catalysts are accelerating the long-term growth of the MEA Gluten Free Food Industry. Technological breakthroughs in sustainable ingredient sourcing and production methods are reducing costs and environmental impact, making gluten-free options more viable. Strategic partnerships between ingredient suppliers and food manufacturers are fostering innovation and increasing product availability. Furthermore, market expansion strategies that focus on consumer education and accessible pricing in emerging economies are crucial for unlocking further growth. The increasing adoption of online retail channels and direct-to-consumer models are also significantly expanding market reach and customer engagement.
Key Players Shaping the MEA Gluten Free Food Industry Market
- Vfoods (Violife)
- Orgran SA
- General Mills Inc
- The Hain Celestial Group Inc
- Hunter Foods Limited FZCO
- Dr Schar AG / SPA
- Danone S A
- Probios S p Aa
Notable Milestones in MEA Gluten Free Food Industry Sector
- 2019: Increased introduction of certified gluten-free product lines by major international food corporations in the MEA region.
- 2020: Significant surge in online sales of gluten-free products driven by global health concerns and lockdown measures.
- 2021: Expansion of local manufacturing capabilities for gluten-free ingredients in key MEA markets to reduce import reliance.
- 2022: Growing focus on "free-from" labeling beyond gluten, including dairy-free and vegan certifications, on product packaging.
- 2023: Increased investment in R&D by companies to improve the taste and texture of gluten-free baked goods and pasta.
- 2024: Introduction of innovative gluten-free snack options catering to on-the-go consumption patterns.
In-Depth MEA Gluten Free Food Industry Market Outlook
The future of the MEA Gluten Free Food Industry is exceptionally bright, driven by sustained growth accelerators such as ongoing technological advancements in ingredient innovation and cost-effective production methods. Strategic partnerships between local and international players are poised to broaden distribution networks and enhance product accessibility across diverse markets. Market expansion initiatives, particularly focusing on consumer education and affordability in emerging African economies, will be critical in unlocking significant untapped potential. The increasing adoption of e-commerce platforms and direct-to-consumer strategies will further amplify market reach and foster deeper consumer engagement, solidifying the industry's robust growth trajectory in the coming years.
MEA Gluten Free Food Industry Segmentation
-
1. Type
- 1.1. Gluten Free
- 1.2. Dairy Free
- 1.3. Allergen Free
- 1.4. Other Types
-
2. End Product
- 2.1. Bakery and Confectionery
- 2.2. Dairy Free Foods
- 2.3. Snacks
- 2.4. Beverages
- 2.5. Other End Products
-
3. Distribution Channel
- 3.1. Supermarkets/Hypermarkets
- 3.2. Online Retail Stores
- 3.3. Convenience Stores
- 3.4. Other Distribution Channels
MEA Gluten Free Food Industry Segmentation By Geography
-
1. North America
- 1.1. United States
- 1.2. Canada
- 1.3. Mexico
-
2. South America
- 2.1. Brazil
- 2.2. Argentina
- 2.3. Rest of South America
-
3. Europe
- 3.1. United Kingdom
- 3.2. Germany
- 3.3. France
- 3.4. Italy
- 3.5. Spain
- 3.6. Russia
- 3.7. Benelux
- 3.8. Nordics
- 3.9. Rest of Europe
-
4. Middle East & Africa
- 4.1. Turkey
- 4.2. Israel
- 4.3. GCC
- 4.4. North Africa
- 4.5. South Africa
- 4.6. Rest of Middle East & Africa
-
5. Asia Pacific
- 5.1. China
- 5.2. India
- 5.3. Japan
- 5.4. South Korea
- 5.5. ASEAN
- 5.6. Oceania
- 5.7. Rest of Asia Pacific
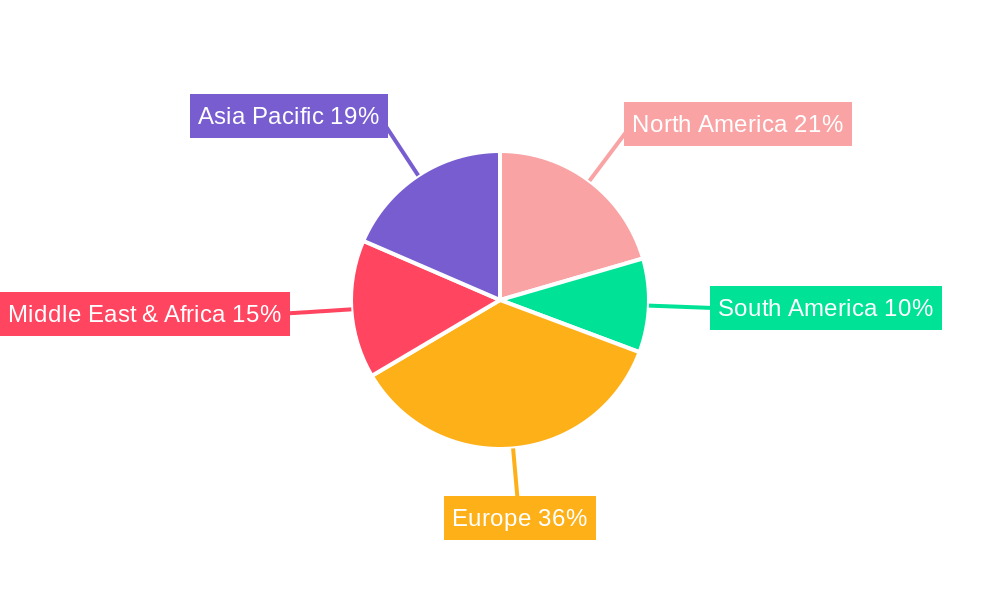
MEA Gluten Free Food Industry Regional Market Share
Geographic Coverage of MEA Gluten Free Food Industry
MEA Gluten Free Food Industry REPORT HIGHLIGHTS
| Aspects | Details |
|---|---|
| Study Period | 2020-2034 |
| Base Year | 2025 |
| Estimated Year | 2026 |
| Forecast Period | 2026-2034 |
| Historical Period | 2020-2025 |
| Growth Rate | CAGR of 10.2% from 2020-2034 |
| Segmentation |
|
Table of Contents
- 1. Introduction
- 1.1. Research Scope
- 1.2. Market Segmentation
- 1.3. Research Objective
- 1.4. Definitions and Assumptions
- 2. Executive Summary
- 2.1. Market Snapshot
- 3. Market Dynamics
- 3.1. Market Drivers
- 3.2. Market Restrains
- 3.3. Market Trends
- 3.4. Market Opportunities
- 4. Market Factor Analysis
- 4.1. Porters Five Forces
- 4.1.1. Bargaining Power of Suppliers
- 4.1.2. Bargaining Power of Buyers
- 4.1.3. Threat of New Entrants
- 4.1.4. Threat of Substitutes
- 4.1.5. Competitive Rivalry
- 4.2. PESTEL analysis
- 4.3. BCG Analysis
- 4.3.1. Stars (High Growth, High Market Share)
- 4.3.2. Cash Cows (Low Growth, High Market Share)
- 4.3.3. Question Mark (High Growth, Low Market Share)
- 4.3.4. Dogs (Low Growth, Low Market Share)
- 4.4. Ansoff Matrix Analysis
- 4.5. Supply Chain Analysis
- 4.6. Regulatory Landscape
- 4.7. Current Market Potential and Opportunity Assessment (TAM–SAM–SOM Framework)
- 4.8. VDR Analyst Note
- 4.1. Porters Five Forces
- 5. Market Analysis, Insights and Forecast 2021-2033
- 5.1. Market Analysis, Insights and Forecast - by Type
- 5.1.1. Gluten Free
- 5.1.2. Dairy Free
- 5.1.3. Allergen Free
- 5.1.4. Other Types
- 5.2. Market Analysis, Insights and Forecast - by End Product
- 5.2.1. Bakery and Confectionery
- 5.2.2. Dairy Free Foods
- 5.2.3. Snacks
- 5.2.4. Beverages
- 5.2.5. Other End Products
- 5.3. Market Analysis, Insights and Forecast - by Distribution Channel
- 5.3.1. Supermarkets/Hypermarkets
- 5.3.2. Online Retail Stores
- 5.3.3. Convenience Stores
- 5.3.4. Other Distribution Channels
- 5.4. Market Analysis, Insights and Forecast - by Region
- 5.4.1. North America
- 5.4.2. South America
- 5.4.3. Europe
- 5.4.4. Middle East & Africa
- 5.4.5. Asia Pacific
- 5.1. Market Analysis, Insights and Forecast - by Type
- 6. Global MEA Gluten Free Food Industry Analysis, Insights and Forecast, 2021-2033
- 6.1. Market Analysis, Insights and Forecast - by Type
- 6.1.1. Gluten Free
- 6.1.2. Dairy Free
- 6.1.3. Allergen Free
- 6.1.4. Other Types
- 6.2. Market Analysis, Insights and Forecast - by End Product
- 6.2.1. Bakery and Confectionery
- 6.2.2. Dairy Free Foods
- 6.2.3. Snacks
- 6.2.4. Beverages
- 6.2.5. Other End Products
- 6.3. Market Analysis, Insights and Forecast - by Distribution Channel
- 6.3.1. Supermarkets/Hypermarkets
- 6.3.2. Online Retail Stores
- 6.3.3. Convenience Stores
- 6.3.4. Other Distribution Channels
- 6.1. Market Analysis, Insights and Forecast - by Type
- 7. North America MEA Gluten Free Food Industry Analysis, Insights and Forecast, 2021-2033
- 7.1. Market Analysis, Insights and Forecast - by Type
- 7.1.1. Gluten Free
- 7.1.2. Dairy Free
- 7.1.3. Allergen Free
- 7.1.4. Other Types
- 7.2. Market Analysis, Insights and Forecast - by End Product
- 7.2.1. Bakery and Confectionery
- 7.2.2. Dairy Free Foods
- 7.2.3. Snacks
- 7.2.4. Beverages
- 7.2.5. Other End Products
- 7.3. Market Analysis, Insights and Forecast - by Distribution Channel
- 7.3.1. Supermarkets/Hypermarkets
- 7.3.2. Online Retail Stores
- 7.3.3. Convenience Stores
- 7.3.4. Other Distribution Channels
- 7.1. Market Analysis, Insights and Forecast - by Type
- 8. South America MEA Gluten Free Food Industry Analysis, Insights and Forecast, 2021-2033
- 8.1. Market Analysis, Insights and Forecast - by Type
- 8.1.1. Gluten Free
- 8.1.2. Dairy Free
- 8.1.3. Allergen Free
- 8.1.4. Other Types
- 8.2. Market Analysis, Insights and Forecast - by End Product
- 8.2.1. Bakery and Confectionery
- 8.2.2. Dairy Free Foods
- 8.2.3. Snacks
- 8.2.4. Beverages
- 8.2.5. Other End Products
- 8.3. Market Analysis, Insights and Forecast - by Distribution Channel
- 8.3.1. Supermarkets/Hypermarkets
- 8.3.2. Online Retail Stores
- 8.3.3. Convenience Stores
- 8.3.4. Other Distribution Channels
- 8.1. Market Analysis, Insights and Forecast - by Type
- 9. Europe MEA Gluten Free Food Industry Analysis, Insights and Forecast, 2021-2033
- 9.1. Market Analysis, Insights and Forecast - by Type
- 9.1.1. Gluten Free
- 9.1.2. Dairy Free
- 9.1.3. Allergen Free
- 9.1.4. Other Types
- 9.2. Market Analysis, Insights and Forecast - by End Product
- 9.2.1. Bakery and Confectionery
- 9.2.2. Dairy Free Foods
- 9.2.3. Snacks
- 9.2.4. Beverages
- 9.2.5. Other End Products
- 9.3. Market Analysis, Insights and Forecast - by Distribution Channel
- 9.3.1. Supermarkets/Hypermarkets
- 9.3.2. Online Retail Stores
- 9.3.3. Convenience Stores
- 9.3.4. Other Distribution Channels
- 9.1. Market Analysis, Insights and Forecast - by Type
- 10. Middle East & Africa MEA Gluten Free Food Industry Analysis, Insights and Forecast, 2021-2033
- 10.1. Market Analysis, Insights and Forecast - by Type
- 10.1.1. Gluten Free
- 10.1.2. Dairy Free
- 10.1.3. Allergen Free
- 10.1.4. Other Types
- 10.2. Market Analysis, Insights and Forecast - by End Product
- 10.2.1. Bakery and Confectionery
- 10.2.2. Dairy Free Foods
- 10.2.3. Snacks
- 10.2.4. Beverages
- 10.2.5. Other End Products
- 10.3. Market Analysis, Insights and Forecast - by Distribution Channel
- 10.3.1. Supermarkets/Hypermarkets
- 10.3.2. Online Retail Stores
- 10.3.3. Convenience Stores
- 10.3.4. Other Distribution Channels
- 10.1. Market Analysis, Insights and Forecast - by Type
- 11. Asia Pacific MEA Gluten Free Food Industry Analysis, Insights and Forecast, 2021-2033
- 11.1. Market Analysis, Insights and Forecast - by Type
- 11.1.1. Gluten Free
- 11.1.2. Dairy Free
- 11.1.3. Allergen Free
- 11.1.4. Other Types
- 11.2. Market Analysis, Insights and Forecast - by End Product
- 11.2.1. Bakery and Confectionery
- 11.2.2. Dairy Free Foods
- 11.2.3. Snacks
- 11.2.4. Beverages
- 11.2.5. Other End Products
- 11.3. Market Analysis, Insights and Forecast - by Distribution Channel
- 11.3.1. Supermarkets/Hypermarkets
- 11.3.2. Online Retail Stores
- 11.3.3. Convenience Stores
- 11.3.4. Other Distribution Channels
- 11.1. Market Analysis, Insights and Forecast - by Type
- 12. Competitive Analysis
- 12.1. Company Profiles
- 12.1.1 Vfoods (Violife)
- 12.1.1.1. Company Overview
- 12.1.1.2. Products
- 12.1.1.3. Company Financials
- 12.1.1.4. SWOT Analysis
- 12.1.2 Orgran SA
- 12.1.2.1. Company Overview
- 12.1.2.2. Products
- 12.1.2.3. Company Financials
- 12.1.2.4. SWOT Analysis
- 12.1.3 General Mills Inc
- 12.1.3.1. Company Overview
- 12.1.3.2. Products
- 12.1.3.3. Company Financials
- 12.1.3.4. SWOT Analysis
- 12.1.4 The Hain Celestial Group Inc
- 12.1.4.1. Company Overview
- 12.1.4.2. Products
- 12.1.4.3. Company Financials
- 12.1.4.4. SWOT Analysis
- 12.1.5 Hunter Foods Limited FZCO
- 12.1.5.1. Company Overview
- 12.1.5.2. Products
- 12.1.5.3. Company Financials
- 12.1.5.4. SWOT Analysis
- 12.1.6 Dr Schar AG / SPA
- 12.1.6.1. Company Overview
- 12.1.6.2. Products
- 12.1.6.3. Company Financials
- 12.1.6.4. SWOT Analysis
- 12.1.7 Danone S A
- 12.1.7.1. Company Overview
- 12.1.7.2. Products
- 12.1.7.3. Company Financials
- 12.1.7.4. SWOT Analysis
- 12.1.8 Probios S p Aa*List Not Exhaustive
- 12.1.8.1. Company Overview
- 12.1.8.2. Products
- 12.1.8.3. Company Financials
- 12.1.8.4. SWOT Analysis
- 12.1.1 Vfoods (Violife)
- 12.2. Market Entropy
- 12.2.1 Company's Key Areas Served
- 12.2.2 Recent Developments
- 12.3. Company Market Share Analysis 2025
- 12.3.1 Top 5 Companies Market Share Analysis
- 12.3.2 Top 3 Companies Market Share Analysis
- 12.4. List of Potential Customers
- 13. Research Methodology
List of Figures
- Figure 1: Global MEA Gluten Free Food Industry Revenue Breakdown (billion, %) by Region 2025 & 2033
- Figure 2: North America MEA Gluten Free Food Industry Revenue (billion), by Type 2025 & 2033
- Figure 3: North America MEA Gluten Free Food Industry Revenue Share (%), by Type 2025 & 2033
- Figure 4: North America MEA Gluten Free Food Industry Revenue (billion), by End Product 2025 & 2033
- Figure 5: North America MEA Gluten Free Food Industry Revenue Share (%), by End Product 2025 & 2033
- Figure 6: North America MEA Gluten Free Food Industry Revenue (billion), by Distribution Channel 2025 & 2033
- Figure 7: North America MEA Gluten Free Food Industry Revenue Share (%), by Distribution Channel 2025 & 2033
- Figure 8: North America MEA Gluten Free Food Industry Revenue (billion), by Country 2025 & 2033
- Figure 9: North America MEA Gluten Free Food Industry Revenue Share (%), by Country 2025 & 2033
- Figure 10: South America MEA Gluten Free Food Industry Revenue (billion), by Type 2025 & 2033
- Figure 11: South America MEA Gluten Free Food Industry Revenue Share (%), by Type 2025 & 2033
- Figure 12: South America MEA Gluten Free Food Industry Revenue (billion), by End Product 2025 & 2033
- Figure 13: South America MEA Gluten Free Food Industry Revenue Share (%), by End Product 2025 & 2033
- Figure 14: South America MEA Gluten Free Food Industry Revenue (billion), by Distribution Channel 2025 & 2033
- Figure 15: South America MEA Gluten Free Food Industry Revenue Share (%), by Distribution Channel 2025 & 2033
- Figure 16: South America MEA Gluten Free Food Industry Revenue (billion), by Country 2025 & 2033
- Figure 17: South America MEA Gluten Free Food Industry Revenue Share (%), by Country 2025 & 2033
- Figure 18: Europe MEA Gluten Free Food Industry Revenue (billion), by Type 2025 & 2033
- Figure 19: Europe MEA Gluten Free Food Industry Revenue Share (%), by Type 2025 & 2033
- Figure 20: Europe MEA Gluten Free Food Industry Revenue (billion), by End Product 2025 & 2033
- Figure 21: Europe MEA Gluten Free Food Industry Revenue Share (%), by End Product 2025 & 2033
- Figure 22: Europe MEA Gluten Free Food Industry Revenue (billion), by Distribution Channel 2025 & 2033
- Figure 23: Europe MEA Gluten Free Food Industry Revenue Share (%), by Distribution Channel 2025 & 2033
- Figure 24: Europe MEA Gluten Free Food Industry Revenue (billion), by Country 2025 & 2033
- Figure 25: Europe MEA Gluten Free Food Industry Revenue Share (%), by Country 2025 & 2033
- Figure 26: Middle East & Africa MEA Gluten Free Food Industry Revenue (billion), by Type 2025 & 2033
- Figure 27: Middle East & Africa MEA Gluten Free Food Industry Revenue Share (%), by Type 2025 & 2033
- Figure 28: Middle East & Africa MEA Gluten Free Food Industry Revenue (billion), by End Product 2025 & 2033
- Figure 29: Middle East & Africa MEA Gluten Free Food Industry Revenue Share (%), by End Product 2025 & 2033
- Figure 30: Middle East & Africa MEA Gluten Free Food Industry Revenue (billion), by Distribution Channel 2025 & 2033
- Figure 31: Middle East & Africa MEA Gluten Free Food Industry Revenue Share (%), by Distribution Channel 2025 & 2033
- Figure 32: Middle East & Africa MEA Gluten Free Food Industry Revenue (billion), by Country 2025 & 2033
- Figure 33: Middle East & Africa MEA Gluten Free Food Industry Revenue Share (%), by Country 2025 & 2033
- Figure 34: Asia Pacific MEA Gluten Free Food Industry Revenue (billion), by Type 2025 & 2033
- Figure 35: Asia Pacific MEA Gluten Free Food Industry Revenue Share (%), by Type 2025 & 2033
- Figure 36: Asia Pacific MEA Gluten Free Food Industry Revenue (billion), by End Product 2025 & 2033
- Figure 37: Asia Pacific MEA Gluten Free Food Industry Revenue Share (%), by End Product 2025 & 2033
- Figure 38: Asia Pacific MEA Gluten Free Food Industry Revenue (billion), by Distribution Channel 2025 & 2033
- Figure 39: Asia Pacific MEA Gluten Free Food Industry Revenue Share (%), by Distribution Channel 2025 & 2033
- Figure 40: Asia Pacific MEA Gluten Free Food Industry Revenue (billion), by Country 2025 & 2033
- Figure 41: Asia Pacific MEA Gluten Free Food Industry Revenue Share (%), by Country 2025 & 2033
List of Tables
- Table 1: Global MEA Gluten Free Food Industry Revenue billion Forecast, by Type 2020 & 2033
- Table 2: Global MEA Gluten Free Food Industry Revenue billion Forecast, by End Product 2020 & 2033
- Table 3: Global MEA Gluten Free Food Industry Revenue billion Forecast, by Distribution Channel 2020 & 2033
- Table 4: Global MEA Gluten Free Food Industry Revenue billion Forecast, by Region 2020 & 2033
- Table 5: Global MEA Gluten Free Food Industry Revenue billion Forecast, by Type 2020 & 2033
- Table 6: Global MEA Gluten Free Food Industry Revenue billion Forecast, by End Product 2020 & 2033
- Table 7: Global MEA Gluten Free Food Industry Revenue billion Forecast, by Distribution Channel 2020 & 2033
- Table 8: Global MEA Gluten Free Food Industry Revenue billion Forecast, by Country 2020 & 2033
- Table 9: United States MEA Gluten Free Food Industry Revenue (billion) Forecast, by Application 2020 & 2033
- Table 10: Canada MEA Gluten Free Food Industry Revenue (billion) Forecast, by Application 2020 & 2033
- Table 11: Mexico MEA Gluten Free Food Industry Revenue (billion) Forecast, by Application 2020 & 2033
- Table 12: Global MEA Gluten Free Food Industry Revenue billion Forecast, by Type 2020 & 2033
- Table 13: Global MEA Gluten Free Food Industry Revenue billion Forecast, by End Product 2020 & 2033
- Table 14: Global MEA Gluten Free Food Industry Revenue billion Forecast, by Distribution Channel 2020 & 2033
- Table 15: Global MEA Gluten Free Food Industry Revenue billion Forecast, by Country 2020 & 2033
- Table 16: Brazil MEA Gluten Free Food Industry Revenue (billion) Forecast, by Application 2020 & 2033
- Table 17: Argentina MEA Gluten Free Food Industry Revenue (billion) Forecast, by Application 2020 & 2033
- Table 18: Rest of South America MEA Gluten Free Food Industry Revenue (billion) Forecast, by Application 2020 & 2033
- Table 19: Global MEA Gluten Free Food Industry Revenue billion Forecast, by Type 2020 & 2033
- Table 20: Global MEA Gluten Free Food Industry Revenue billion Forecast, by End Product 2020 & 2033
- Table 21: Global MEA Gluten Free Food Industry Revenue billion Forecast, by Distribution Channel 2020 & 2033
- Table 22: Global MEA Gluten Free Food Industry Revenue billion Forecast, by Country 2020 & 2033
- Table 23: United Kingdom MEA Gluten Free Food Industry Revenue (billion) Forecast, by Application 2020 & 2033
- Table 24: Germany MEA Gluten Free Food Industry Revenue (billion) Forecast, by Application 2020 & 2033
- Table 25: France MEA Gluten Free Food Industry Revenue (billion) Forecast, by Application 2020 & 2033
- Table 26: Italy MEA Gluten Free Food Industry Revenue (billion) Forecast, by Application 2020 & 2033
- Table 27: Spain MEA Gluten Free Food Industry Revenue (billion) Forecast, by Application 2020 & 2033
- Table 28: Russia MEA Gluten Free Food Industry Revenue (billion) Forecast, by Application 2020 & 2033
- Table 29: Benelux MEA Gluten Free Food Industry Revenue (billion) Forecast, by Application 2020 & 2033
- Table 30: Nordics MEA Gluten Free Food Industry Revenue (billion) Forecast, by Application 2020 & 2033
- Table 31: Rest of Europe MEA Gluten Free Food Industry Revenue (billion) Forecast, by Application 2020 & 2033
- Table 32: Global MEA Gluten Free Food Industry Revenue billion Forecast, by Type 2020 & 2033
- Table 33: Global MEA Gluten Free Food Industry Revenue billion Forecast, by End Product 2020 & 2033
- Table 34: Global MEA Gluten Free Food Industry Revenue billion Forecast, by Distribution Channel 2020 & 2033
- Table 35: Global MEA Gluten Free Food Industry Revenue billion Forecast, by Country 2020 & 2033
- Table 36: Turkey MEA Gluten Free Food Industry Revenue (billion) Forecast, by Application 2020 & 2033
- Table 37: Israel MEA Gluten Free Food Industry Revenue (billion) Forecast, by Application 2020 & 2033
- Table 38: GCC MEA Gluten Free Food Industry Revenue (billion) Forecast, by Application 2020 & 2033
- Table 39: North Africa MEA Gluten Free Food Industry Revenue (billion) Forecast, by Application 2020 & 2033
- Table 40: South Africa MEA Gluten Free Food Industry Revenue (billion) Forecast, by Application 2020 & 2033
- Table 41: Rest of Middle East & Africa MEA Gluten Free Food Industry Revenue (billion) Forecast, by Application 2020 & 2033
- Table 42: Global MEA Gluten Free Food Industry Revenue billion Forecast, by Type 2020 & 2033
- Table 43: Global MEA Gluten Free Food Industry Revenue billion Forecast, by End Product 2020 & 2033
- Table 44: Global MEA Gluten Free Food Industry Revenue billion Forecast, by Distribution Channel 2020 & 2033
- Table 45: Global MEA Gluten Free Food Industry Revenue billion Forecast, by Country 2020 & 2033
- Table 46: China MEA Gluten Free Food Industry Revenue (billion) Forecast, by Application 2020 & 2033
- Table 47: India MEA Gluten Free Food Industry Revenue (billion) Forecast, by Application 2020 & 2033
- Table 48: Japan MEA Gluten Free Food Industry Revenue (billion) Forecast, by Application 2020 & 2033
- Table 49: South Korea MEA Gluten Free Food Industry Revenue (billion) Forecast, by Application 2020 & 2033
- Table 50: ASEAN MEA Gluten Free Food Industry Revenue (billion) Forecast, by Application 2020 & 2033
- Table 51: Oceania MEA Gluten Free Food Industry Revenue (billion) Forecast, by Application 2020 & 2033
- Table 52: Rest of Asia Pacific MEA Gluten Free Food Industry Revenue (billion) Forecast, by Application 2020 & 2033
Frequently Asked Questions
1. What is the projected Compound Annual Growth Rate (CAGR) of the MEA Gluten Free Food Industry?
The projected CAGR is approximately 10.2%.
2. Which companies are prominent players in the MEA Gluten Free Food Industry?
Key companies in the market include Vfoods (Violife), Orgran SA, General Mills Inc, The Hain Celestial Group Inc, Hunter Foods Limited FZCO, Dr Schar AG / SPA, Danone S A, Probios S p Aa*List Not Exhaustive.
3. What are the main segments of the MEA Gluten Free Food Industry?
The market segments include Type, End Product, Distribution Channel.
4. Can you provide details about the market size?
The market size is estimated to be USD 8.5 billion as of 2022.
5. What are some drivers contributing to market growth?
Increasing Health Concerns are Supporting the Market's Growth; Growing Consumer Preference for Convenience Seafood.
6. What are the notable trends driving market growth?
Rising Awareness on Clean Labeling in Africa.
7. Are there any restraints impacting market growth?
Rising Concern About Quality and Safety Standards of Canned Tuna.
8. Can you provide examples of recent developments in the market?
N/A
9. What pricing options are available for accessing the report?
Pricing options include single-user, multi-user, and enterprise licenses priced at USD 4750, USD 5250, and USD 8750 respectively.
10. Is the market size provided in terms of value or volume?
The market size is provided in terms of value, measured in billion.
11. Are there any specific market keywords associated with the report?
Yes, the market keyword associated with the report is "MEA Gluten Free Food Industry," which aids in identifying and referencing the specific market segment covered.
12. How do I determine which pricing option suits my needs best?
The pricing options vary based on user requirements and access needs. Individual users may opt for single-user licenses, while businesses requiring broader access may choose multi-user or enterprise licenses for cost-effective access to the report.
13. Are there any additional resources or data provided in the MEA Gluten Free Food Industry report?
While the report offers comprehensive insights, it's advisable to review the specific contents or supplementary materials provided to ascertain if additional resources or data are available.
14. How can I stay updated on further developments or reports in the MEA Gluten Free Food Industry?
To stay informed about further developments, trends, and reports in the MEA Gluten Free Food Industry, consider subscribing to industry newsletters, following relevant companies and organizations, or regularly checking reputable industry news sources and publications.
Methodology
Step 1 - Identification of Relevant Samples Size from Population Database


Step 2 - Approaches for Defining Global Market Size (Value, Volume* & Price*)

Note*: In applicable scenarios
Step 3 - Data Sources
Primary Research
- Web Analytics
- Survey Reports
- Research Institute
- Latest Research Reports
- Opinion Leaders
Secondary Research
- Annual Reports
- White Paper
- Latest Press Release
- Industry Association
- Paid Database
- Investor Presentations

Step 4 - Data Triangulation
Involves using different sources of information in order to increase the validity of a study
These sources are likely to be stakeholders in a program - participants, other researchers, program staff, other community members, and so on.
Then we put all data in single framework & apply various statistical tools to find out the dynamic on the market.
During the analysis stage, feedback from the stakeholder groups would be compared to determine areas of agreement as well as areas of divergence