

Key Insights
The global Non-Thermal Processing Market is set for significant expansion, projected to reach $2.07 billion by 2025, with a Compound Annual Growth Rate (CAGR) of 8.53% through 2033. This growth is driven by escalating consumer demand for minimally processed foods that retain superior nutritional value and sensory appeal, coupled with heightened awareness of non-thermal technologies' health and safety benefits. Key catalysts include the rising incidence of foodborne illnesses, stringent food safety regulations, and continuous innovation in non-thermal processing. High-Pressure Processing (HPP) currently leads the market due to its efficacy in extending shelf life and preserving quality across diverse food products, with notable adoption in beverages and meat.
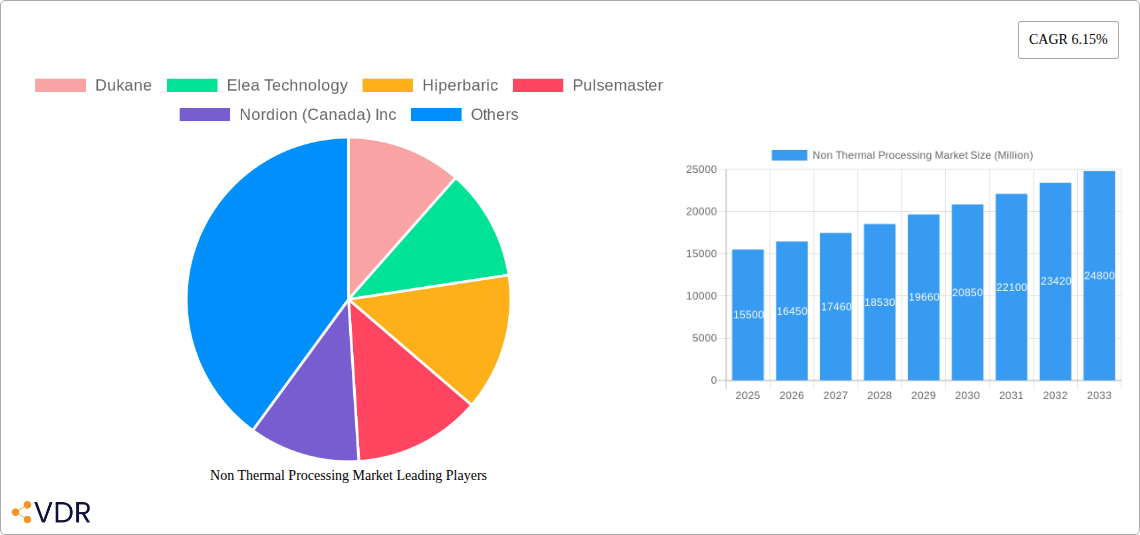
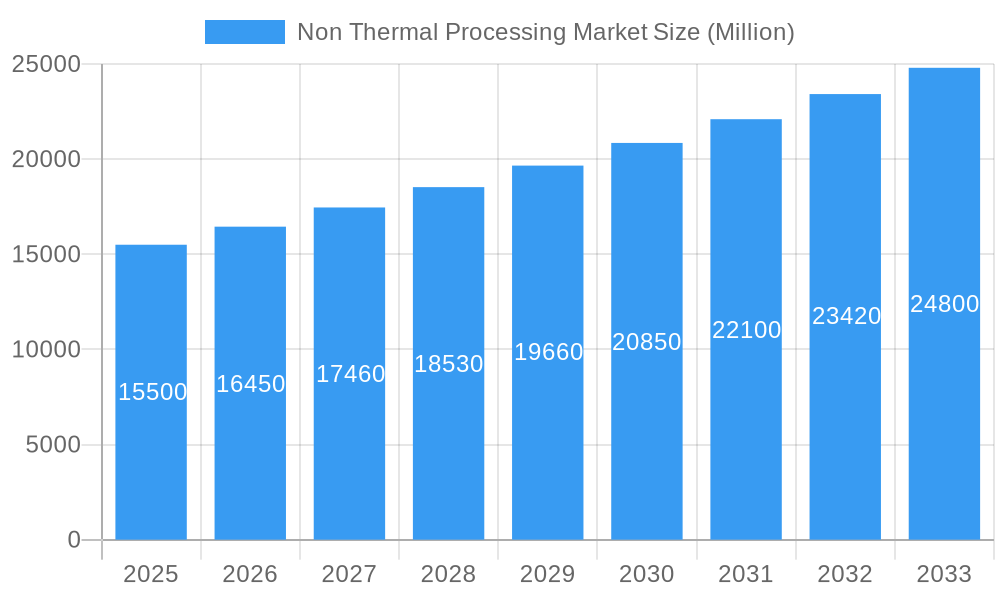
Non Thermal Processing Market Market Size (In Billion)
Emerging technologies like Pulsed Electrical Fields (PEF) and Ultrasonic processing are gaining traction, offering cost-effectiveness and energy efficiency, particularly for fruits, vegetables, and dairy. The market is characterized by robust competition, fostering investment in R&D to enhance processing capabilities and applications. Initial capital investment and consumer education remain potential restraints, though technological advancements and industry collaborations are mitigating these challenges. North America and Europe lead market adoption due to advanced infrastructure and consumer acceptance, while the Asia Pacific region offers substantial growth potential driven by a rising middle class and demand for safer, high-quality food.
Non Thermal Processing Market Company Market Share
This report provides a comprehensive analysis of the Non-Thermal Processing Market, detailing its growth trajectory, technological advancements, and key players. We explore the evolving landscape of food preservation techniques, driven by consumer demand for healthier, fresher, and safer food. The study covers the period from 2019 to 2033, with a base year of 2025 and a forecast period from 2025 to 2033. Historical data from 2019 to 2024 is also analyzed.
Non Thermal Processing Market Market Dynamics & Structure
The Non Thermal Processing Market is characterized by a moderately concentrated structure, with a blend of established players and emerging innovators. Technological innovation is a primary driver, fueled by the continuous pursuit of enhanced food safety, extended shelf life, and preservation of nutritional value without compromising sensory attributes. Regulatory frameworks globally are increasingly favoring advanced processing methods that reduce reliance on chemical preservatives and minimize microbial contamination, directly impacting market expansion. Competitive product substitutes include traditional thermal processing methods, but the unique advantages of non-thermal technologies, such as superior quality retention, are carving out significant market share. End-user demographics are evolving, with a growing segment of health-conscious consumers actively seeking minimally processed foods. Merger and acquisition (M&A) trends are observed as companies seek to expand their technological portfolios and market reach. For instance, recent M&A activities in the Food Processing Equipment sector have seen an influx of investments into non-thermal technologies, with an estimated xx deal volumes in the last two years. Innovation barriers, such as the high initial capital investment for certain technologies and the need for robust validation studies, are being addressed through collaborative research and development initiatives. The market concentration ratio is estimated to be xx% among the top 5 players.
Non Thermal Processing Market Growth Trends & Insights
The Non Thermal Processing Market is poised for substantial growth, projected to reach an estimated USD XXXX Million by 2033. This upward trajectory is propelled by a confluence of factors, including escalating consumer preference for "clean label" products, a heightened awareness of foodborne illnesses, and the increasing demand for extended shelf-life and minimally processed foods. The adoption rates of non-thermal technologies, particularly High-Pressure Processing (HPP) and Pulsed Electrical Fields (PEF), are witnessing a significant surge across various food categories. Technological disruptions are continuously reshaping the market, with ongoing research focused on improving energy efficiency, reducing processing times, and developing novel applications for existing technologies. For example, advancements in UV Processing are enabling more precise and targeted microbial inactivation in beverages and packaging. Consumer behavior shifts are pivotal, with a growing segment actively seeking foods that retain their natural nutrients, flavors, and textures, a key benefit offered by non-thermal methods. The market penetration of non-thermal technologies, currently at xx% for the overall food industry, is anticipated to double within the forecast period. The Compound Annual Growth Rate (CAGR) for the Global Non Thermal Processing Market is estimated at xx% from 2025 to 2033, reflecting its robust expansion. This growth is further bolstered by the increasing focus on reducing food waste through improved preservation techniques, a significant societal and economic concern.
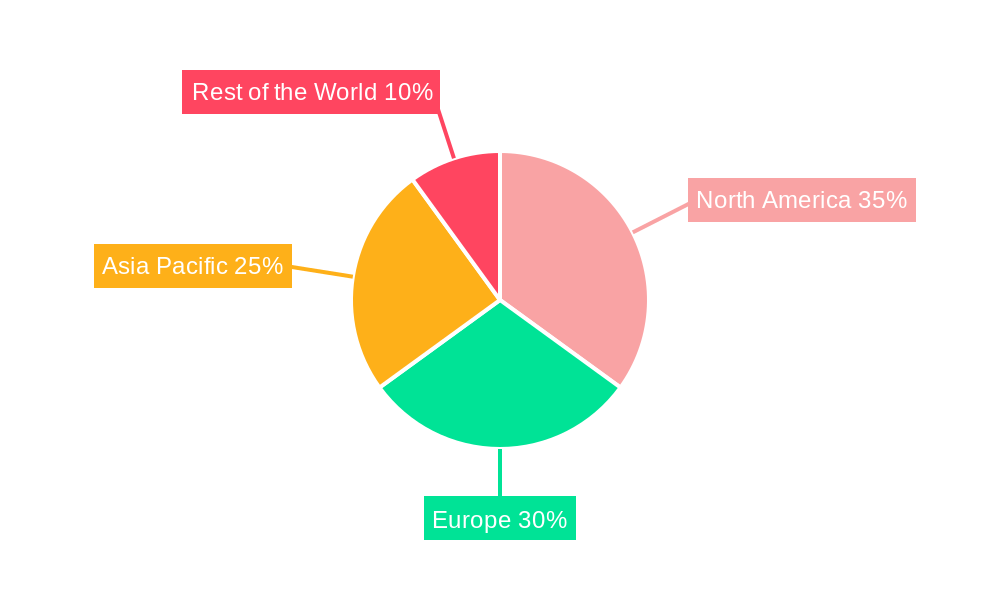
Dominant Regions, Countries, or Segments in Non Thermal Processing Market
North America, particularly the United States, currently dominates the Non Thermal Processing Market, driven by its advanced food industry infrastructure, strong consumer demand for healthy and safe food options, and proactive regulatory environment. The Technology: High-Pressure Processing (HPP) segment is a leading contributor to this regional dominance, owing to its widespread adoption in the Food Type: Meat, Dairy, and Fruits and Vegetables sectors. Significant growth potential also exists in Europe, where consumer awareness regarding food quality and sustainability is high, fostering the adoption of advanced processing methods. The Country: Germany and the Country: France are emerging as key markets within Europe, with supportive government initiatives promoting food innovation. Asia Pacific, while currently a smaller market share, is projected to experience the highest growth rate due to rapid urbanization, a burgeoning middle class with increasing disposable incomes, and a growing emphasis on food safety standards. In terms of food types, Food Type: Beverages and Food Type: Meat are currently the largest application segments, followed by Food Type: Dairy and Food Type: Fruits and Vegetables. However, the Food Type: Others segment, encompassing niche applications like ready-to-eat meals and specialized ingredients, is exhibiting remarkable growth potential. Key drivers of dominance in North America include robust R&D investments, the presence of key market players, and a well-established supply chain for non-thermal processing equipment. The market share of HPP in North America is estimated at xx%.
Non Thermal Processing Market Product Landscape
The Non Thermal Processing Market product landscape is defined by continuous innovation in equipment design and application. Technologies like High-Pressure Processing (HPP) offer advanced systems for extending the shelf life of packaged foods, preserving texture, flavor, and nutritional content, particularly in products like juices, dips, and ready-to-eat meals. UV Processing solutions are increasingly being integrated into packaging lines and food surfaces for effective microbial inactivation in liquids and solids. Pulsed Electrical Fields (PEF) are gaining traction for their ability to enhance cell membrane permeability, improving extraction efficiency and aiding in the preservation of high-value ingredients. Ultrasonic technologies are being explored for their potential in pasteurization and decontamination of food matrices. Irradiation offers a well-established method for microbial reduction in a variety of food products. The unique selling propositions of these non-thermal technologies revolve around their ability to deliver superior product quality, extended shelf life, and enhanced food safety without the negative impacts of heat. Technological advancements are focusing on increased throughput, reduced energy consumption, and greater flexibility in processing diverse food products.
Key Drivers, Barriers & Challenges in Non Thermal Processing Market
The Non Thermal Processing Market is propelled by several key drivers. The escalating consumer demand for healthier, fresher, and "clean label" food products, free from artificial preservatives, is a primary growth factor. Heightened global awareness regarding food safety and the reduction of foodborne illnesses further bolsters the adoption of advanced preservation techniques. Technological advancements in non-thermal processing equipment, leading to improved efficiency and cost-effectiveness, also play a crucial role. Furthermore, increasing regulatory support for innovative food processing methods that enhance food safety and reduce spoilage contributes significantly.
Conversely, the market faces several barriers and challenges. The high initial capital investment required for implementing non-thermal processing technologies can be a significant restraint, particularly for small and medium-sized enterprises. The need for comprehensive validation studies to ensure the efficacy and safety of these processes can be time-consuming and resource-intensive. Supply chain complexities and the availability of specialized equipment and skilled labor also pose challenges. Competitive pressures from established thermal processing methods and the perception among some consumers regarding the novelty of non-thermal techniques can also hinder market penetration.
Emerging Opportunities in Non Thermal Processing Market
Emerging opportunities within the Non Thermal Processing Market are vast and varied. The growing demand for plant-based and alternative protein products presents a significant avenue for non-thermal processing, as these products often benefit from enhanced texture and shelf-life preservation. The development of novel applications for existing technologies, such as using UV Processing for water purification in food manufacturing or Pulsed Electrical Fields (PEF) for improving the texture of dehydrated fruits, is a promising area. Untapped markets in developing economies, where food safety concerns are paramount and consumer awareness is growing, offer substantial growth potential. Furthermore, the integration of non-thermal processing with other food preservation techniques, such as mild heat treatment, is opening up new frontiers for achieving optimal product quality and safety. The market for minimally processed snacks and convenience foods is also expanding, creating new applications for non-thermal technologies.
Growth Accelerators in the Non Thermal Processing Market Industry
Several catalysts are driving the long-term growth of the Non Thermal Processing Market Industry. Breakthroughs in technological innovation, leading to more affordable, energy-efficient, and user-friendly equipment, are a significant growth accelerator. Strategic partnerships between technology providers and food manufacturers are facilitating the wider adoption and integration of these advanced processing methods into existing production lines. Market expansion strategies, including the development of smaller-scale, modular equipment for niche applications and customized processing solutions, are further fueling growth. Increased investment in research and development by both private companies and government bodies to explore new applications and optimize existing technologies is also a crucial factor. The growing emphasis on sustainability in the food industry, with non-thermal processing often contributing to reduced energy consumption and food waste, acts as another potent accelerator.
Key Players Shaping the Non Thermal Processing Market Market
- Dukane
- Elea Technology
- Hiperbaric
- Pulsemaster
- Nordion (Canada) Inc
- CHIC Group
- Symbios Technologies
- GRAY*STAR Inc
Notable Milestones in Non Thermal Processing Market Sector
- 2019: Launch of advanced HPP systems with enhanced throughput and energy efficiency by leading manufacturers.
- 2020: Increased adoption of UV Processing for surface decontamination of food packaging in response to heightened hygiene concerns.
- 2021: Significant investment in R&D for Pulsed Electrical Fields (PEF) applications in the extraction of functional ingredients.
- 2022: Expansion of Irradiation services for a wider range of food products, meeting evolving regulatory standards.
- 2023: Introduction of novel Ultrasonic applications for shelf-life extension of dairy products.
- 2024: Merger of key players in the Food Processing Equipment sector, consolidating expertise in non-thermal technologies.
In-Depth Non Thermal Processing Market Market Outlook
The future outlook for the Non Thermal Processing Market is exceptionally promising, driven by sustained demand for safe, high-quality, and minimally processed foods. Growth accelerators, including continuous technological breakthroughs, strategic industry collaborations, and expanding market reach into emerging economies, will continue to fuel this expansion. The market is expected to witness further diversification in applications, with non-thermal technologies playing a pivotal role in the development of innovative food products catering to evolving consumer lifestyles and dietary preferences. Strategic opportunities lie in developing integrated processing solutions, enhancing public awareness and acceptance of non-thermal methods, and addressing cost-related barriers through innovative business models. The increasing focus on reducing food waste and improving global food security will also significantly contribute to the market's upward trajectory.
Non Thermal Processing Market Segmentation
-
1. Technology
- 1.1. HPP
- 1.2. UV Processing
- 1.3. Pulsed Electrical Fields
- 1.4. Ultrasonic
- 1.5. Irradiation
- 1.6. Others
-
2. Food Type
- 2.1. Beverages
- 2.2. Meat
- 2.3. Dairy
- 2.4. Fruits and Vegetables
- 2.5. Others
Non Thermal Processing Market Segmentation By Geography
-
1. North America
- 1.1. United States
- 1.2. Canada
- 1.3. Mexico
- 1.4. Rest of North America
-
2. Europe
- 2.1. Spain
- 2.2. United Kingdom
- 2.3. Germany
- 2.4. France
- 2.5. Italy
- 2.6. Russia
- 2.7. Rest of Europe
-
3. Asia Pacific
- 3.1. China
- 3.2. Japan
- 3.3. India
- 3.4. Australia
- 3.5. Rest of Asia Pacific
- 4. Rest of the World
Non Thermal Processing Market Regional Market Share
Geographic Coverage of Non Thermal Processing Market
Non Thermal Processing Market REPORT HIGHLIGHTS
| Aspects | Details |
|---|---|
| Study Period | 2020-2034 |
| Base Year | 2025 |
| Estimated Year | 2026 |
| Forecast Period | 2026-2034 |
| Historical Period | 2020-2025 |
| Growth Rate | CAGR of 8.53% from 2020-2034 |
| Segmentation |
|
Table of Contents
- 1. Introduction
- 1.1. Research Scope
- 1.2. Market Segmentation
- 1.3. Research Objective
- 1.4. Definitions and Assumptions
- 2. Executive Summary
- 2.1. Market Snapshot
- 3. Market Dynamics
- 3.1. Market Drivers
- 3.2. Market Restrains
- 3.3. Market Trends
- 3.4. Market Opportunities
- 4. Market Factor Analysis
- 4.1. Porters Five Forces
- 4.1.1. Bargaining Power of Suppliers
- 4.1.2. Bargaining Power of Buyers
- 4.1.3. Threat of New Entrants
- 4.1.4. Threat of Substitutes
- 4.1.5. Competitive Rivalry
- 4.2. PESTEL analysis
- 4.3. BCG Analysis
- 4.3.1. Stars (High Growth, High Market Share)
- 4.3.2. Cash Cows (Low Growth, High Market Share)
- 4.3.3. Question Mark (High Growth, Low Market Share)
- 4.3.4. Dogs (Low Growth, Low Market Share)
- 4.4. Ansoff Matrix Analysis
- 4.5. Supply Chain Analysis
- 4.6. Regulatory Landscape
- 4.7. Current Market Potential and Opportunity Assessment (TAM–SAM–SOM Framework)
- 4.8. VDR Analyst Note
- 4.1. Porters Five Forces
- 5. Market Analysis, Insights and Forecast 2021-2033
- 5.1. Market Analysis, Insights and Forecast - by Technology
- 5.1.1. HPP
- 5.1.2. UV Processing
- 5.1.3. Pulsed Electrical Fields
- 5.1.4. Ultrasonic
- 5.1.5. Irradiation
- 5.1.6. Others
- 5.2. Market Analysis, Insights and Forecast - by Food Type
- 5.2.1. Beverages
- 5.2.2. Meat
- 5.2.3. Dairy
- 5.2.4. Fruits and Vegetables
- 5.2.5. Others
- 5.3. Market Analysis, Insights and Forecast - by Region
- 5.3.1. North America
- 5.3.2. Europe
- 5.3.3. Asia Pacific
- 5.3.4. Rest of the World
- 5.1. Market Analysis, Insights and Forecast - by Technology
- 6. Global Non Thermal Processing Market Analysis, Insights and Forecast, 2021-2033
- 6.1. Market Analysis, Insights and Forecast - by Technology
- 6.1.1. HPP
- 6.1.2. UV Processing
- 6.1.3. Pulsed Electrical Fields
- 6.1.4. Ultrasonic
- 6.1.5. Irradiation
- 6.1.6. Others
- 6.2. Market Analysis, Insights and Forecast - by Food Type
- 6.2.1. Beverages
- 6.2.2. Meat
- 6.2.3. Dairy
- 6.2.4. Fruits and Vegetables
- 6.2.5. Others
- 6.1. Market Analysis, Insights and Forecast - by Technology
- 7. North America Non Thermal Processing Market Analysis, Insights and Forecast, 2021-2033
- 7.1. Market Analysis, Insights and Forecast - by Technology
- 7.1.1. HPP
- 7.1.2. UV Processing
- 7.1.3. Pulsed Electrical Fields
- 7.1.4. Ultrasonic
- 7.1.5. Irradiation
- 7.1.6. Others
- 7.2. Market Analysis, Insights and Forecast - by Food Type
- 7.2.1. Beverages
- 7.2.2. Meat
- 7.2.3. Dairy
- 7.2.4. Fruits and Vegetables
- 7.2.5. Others
- 7.1. Market Analysis, Insights and Forecast - by Technology
- 8. Europe Non Thermal Processing Market Analysis, Insights and Forecast, 2021-2033
- 8.1. Market Analysis, Insights and Forecast - by Technology
- 8.1.1. HPP
- 8.1.2. UV Processing
- 8.1.3. Pulsed Electrical Fields
- 8.1.4. Ultrasonic
- 8.1.5. Irradiation
- 8.1.6. Others
- 8.2. Market Analysis, Insights and Forecast - by Food Type
- 8.2.1. Beverages
- 8.2.2. Meat
- 8.2.3. Dairy
- 8.2.4. Fruits and Vegetables
- 8.2.5. Others
- 8.1. Market Analysis, Insights and Forecast - by Technology
- 9. Asia Pacific Non Thermal Processing Market Analysis, Insights and Forecast, 2021-2033
- 9.1. Market Analysis, Insights and Forecast - by Technology
- 9.1.1. HPP
- 9.1.2. UV Processing
- 9.1.3. Pulsed Electrical Fields
- 9.1.4. Ultrasonic
- 9.1.5. Irradiation
- 9.1.6. Others
- 9.2. Market Analysis, Insights and Forecast - by Food Type
- 9.2.1. Beverages
- 9.2.2. Meat
- 9.2.3. Dairy
- 9.2.4. Fruits and Vegetables
- 9.2.5. Others
- 9.1. Market Analysis, Insights and Forecast - by Technology
- 10. Rest of the World Non Thermal Processing Market Analysis, Insights and Forecast, 2021-2033
- 10.1. Market Analysis, Insights and Forecast - by Technology
- 10.1.1. HPP
- 10.1.2. UV Processing
- 10.1.3. Pulsed Electrical Fields
- 10.1.4. Ultrasonic
- 10.1.5. Irradiation
- 10.1.6. Others
- 10.2. Market Analysis, Insights and Forecast - by Food Type
- 10.2.1. Beverages
- 10.2.2. Meat
- 10.2.3. Dairy
- 10.2.4. Fruits and Vegetables
- 10.2.5. Others
- 10.1. Market Analysis, Insights and Forecast - by Technology
- 11. Competitive Analysis
- 11.1. Company Profiles
- 11.1.1 Dukane
- 11.1.1.1. Company Overview
- 11.1.1.2. Products
- 11.1.1.3. Company Financials
- 11.1.1.4. SWOT Analysis
- 11.1.2 Elea Technology
- 11.1.2.1. Company Overview
- 11.1.2.2. Products
- 11.1.2.3. Company Financials
- 11.1.2.4. SWOT Analysis
- 11.1.3 Hiperbaric
- 11.1.3.1. Company Overview
- 11.1.3.2. Products
- 11.1.3.3. Company Financials
- 11.1.3.4. SWOT Analysis
- 11.1.4 Pulsemaster
- 11.1.4.1. Company Overview
- 11.1.4.2. Products
- 11.1.4.3. Company Financials
- 11.1.4.4. SWOT Analysis
- 11.1.5 Nordion (Canada) Inc
- 11.1.5.1. Company Overview
- 11.1.5.2. Products
- 11.1.5.3. Company Financials
- 11.1.5.4. SWOT Analysis
- 11.1.6 CHIC Group
- 11.1.6.1. Company Overview
- 11.1.6.2. Products
- 11.1.6.3. Company Financials
- 11.1.6.4. SWOT Analysis
- 11.1.7 Symbios Technologies
- 11.1.7.1. Company Overview
- 11.1.7.2. Products
- 11.1.7.3. Company Financials
- 11.1.7.4. SWOT Analysis
- 11.1.8 GRAY*STAR Inc *List Not Exhaustive
- 11.1.8.1. Company Overview
- 11.1.8.2. Products
- 11.1.8.3. Company Financials
- 11.1.8.4. SWOT Analysis
- 11.1.1 Dukane
- 11.2. Market Entropy
- 11.2.1 Company's Key Areas Served
- 11.2.2 Recent Developments
- 11.3. Company Market Share Analysis 2025
- 11.3.1 Top 5 Companies Market Share Analysis
- 11.3.2 Top 3 Companies Market Share Analysis
- 11.4. List of Potential Customers
- 12. Research Methodology
List of Figures
- Figure 1: Global Non Thermal Processing Market Revenue Breakdown (billion, %) by Region 2025 & 2033
- Figure 2: North America Non Thermal Processing Market Revenue (billion), by Technology 2025 & 2033
- Figure 3: North America Non Thermal Processing Market Revenue Share (%), by Technology 2025 & 2033
- Figure 4: North America Non Thermal Processing Market Revenue (billion), by Food Type 2025 & 2033
- Figure 5: North America Non Thermal Processing Market Revenue Share (%), by Food Type 2025 & 2033
- Figure 6: North America Non Thermal Processing Market Revenue (billion), by Country 2025 & 2033
- Figure 7: North America Non Thermal Processing Market Revenue Share (%), by Country 2025 & 2033
- Figure 8: Europe Non Thermal Processing Market Revenue (billion), by Technology 2025 & 2033
- Figure 9: Europe Non Thermal Processing Market Revenue Share (%), by Technology 2025 & 2033
- Figure 10: Europe Non Thermal Processing Market Revenue (billion), by Food Type 2025 & 2033
- Figure 11: Europe Non Thermal Processing Market Revenue Share (%), by Food Type 2025 & 2033
- Figure 12: Europe Non Thermal Processing Market Revenue (billion), by Country 2025 & 2033
- Figure 13: Europe Non Thermal Processing Market Revenue Share (%), by Country 2025 & 2033
- Figure 14: Asia Pacific Non Thermal Processing Market Revenue (billion), by Technology 2025 & 2033
- Figure 15: Asia Pacific Non Thermal Processing Market Revenue Share (%), by Technology 2025 & 2033
- Figure 16: Asia Pacific Non Thermal Processing Market Revenue (billion), by Food Type 2025 & 2033
- Figure 17: Asia Pacific Non Thermal Processing Market Revenue Share (%), by Food Type 2025 & 2033
- Figure 18: Asia Pacific Non Thermal Processing Market Revenue (billion), by Country 2025 & 2033
- Figure 19: Asia Pacific Non Thermal Processing Market Revenue Share (%), by Country 2025 & 2033
- Figure 20: Rest of the World Non Thermal Processing Market Revenue (billion), by Technology 2025 & 2033
- Figure 21: Rest of the World Non Thermal Processing Market Revenue Share (%), by Technology 2025 & 2033
- Figure 22: Rest of the World Non Thermal Processing Market Revenue (billion), by Food Type 2025 & 2033
- Figure 23: Rest of the World Non Thermal Processing Market Revenue Share (%), by Food Type 2025 & 2033
- Figure 24: Rest of the World Non Thermal Processing Market Revenue (billion), by Country 2025 & 2033
- Figure 25: Rest of the World Non Thermal Processing Market Revenue Share (%), by Country 2025 & 2033
List of Tables
- Table 1: Global Non Thermal Processing Market Revenue billion Forecast, by Technology 2020 & 2033
- Table 2: Global Non Thermal Processing Market Revenue billion Forecast, by Food Type 2020 & 2033
- Table 3: Global Non Thermal Processing Market Revenue billion Forecast, by Region 2020 & 2033
- Table 4: Global Non Thermal Processing Market Revenue billion Forecast, by Technology 2020 & 2033
- Table 5: Global Non Thermal Processing Market Revenue billion Forecast, by Food Type 2020 & 2033
- Table 6: Global Non Thermal Processing Market Revenue billion Forecast, by Country 2020 & 2033
- Table 7: United States Non Thermal Processing Market Revenue (billion) Forecast, by Application 2020 & 2033
- Table 8: Canada Non Thermal Processing Market Revenue (billion) Forecast, by Application 2020 & 2033
- Table 9: Mexico Non Thermal Processing Market Revenue (billion) Forecast, by Application 2020 & 2033
- Table 10: Rest of North America Non Thermal Processing Market Revenue (billion) Forecast, by Application 2020 & 2033
- Table 11: Global Non Thermal Processing Market Revenue billion Forecast, by Technology 2020 & 2033
- Table 12: Global Non Thermal Processing Market Revenue billion Forecast, by Food Type 2020 & 2033
- Table 13: Global Non Thermal Processing Market Revenue billion Forecast, by Country 2020 & 2033
- Table 14: Spain Non Thermal Processing Market Revenue (billion) Forecast, by Application 2020 & 2033
- Table 15: United Kingdom Non Thermal Processing Market Revenue (billion) Forecast, by Application 2020 & 2033
- Table 16: Germany Non Thermal Processing Market Revenue (billion) Forecast, by Application 2020 & 2033
- Table 17: France Non Thermal Processing Market Revenue (billion) Forecast, by Application 2020 & 2033
- Table 18: Italy Non Thermal Processing Market Revenue (billion) Forecast, by Application 2020 & 2033
- Table 19: Russia Non Thermal Processing Market Revenue (billion) Forecast, by Application 2020 & 2033
- Table 20: Rest of Europe Non Thermal Processing Market Revenue (billion) Forecast, by Application 2020 & 2033
- Table 21: Global Non Thermal Processing Market Revenue billion Forecast, by Technology 2020 & 2033
- Table 22: Global Non Thermal Processing Market Revenue billion Forecast, by Food Type 2020 & 2033
- Table 23: Global Non Thermal Processing Market Revenue billion Forecast, by Country 2020 & 2033
- Table 24: China Non Thermal Processing Market Revenue (billion) Forecast, by Application 2020 & 2033
- Table 25: Japan Non Thermal Processing Market Revenue (billion) Forecast, by Application 2020 & 2033
- Table 26: India Non Thermal Processing Market Revenue (billion) Forecast, by Application 2020 & 2033
- Table 27: Australia Non Thermal Processing Market Revenue (billion) Forecast, by Application 2020 & 2033
- Table 28: Rest of Asia Pacific Non Thermal Processing Market Revenue (billion) Forecast, by Application 2020 & 2033
- Table 29: Global Non Thermal Processing Market Revenue billion Forecast, by Technology 2020 & 2033
- Table 30: Global Non Thermal Processing Market Revenue billion Forecast, by Food Type 2020 & 2033
- Table 31: Global Non Thermal Processing Market Revenue billion Forecast, by Country 2020 & 2033
Frequently Asked Questions
1. What is the projected Compound Annual Growth Rate (CAGR) of the Non Thermal Processing Market?
The projected CAGR is approximately 8.53%.
2. Which companies are prominent players in the Non Thermal Processing Market?
Key companies in the market include Dukane, Elea Technology, Hiperbaric, Pulsemaster, Nordion (Canada) Inc, CHIC Group, Symbios Technologies, GRAY*STAR Inc *List Not Exhaustive.
3. What are the main segments of the Non Thermal Processing Market?
The market segments include Technology, Food Type.
4. Can you provide details about the market size?
The market size is estimated to be USD 2.07 billion as of 2022.
5. What are some drivers contributing to market growth?
Rising Health & Wellness Trends; Strategic Initiatives By Key Players.
6. What are the notable trends driving market growth?
Growing Demand For High Quality Foods.
7. Are there any restraints impacting market growth?
Cost Considerations Coupled With Availability Of Alternatives.
8. Can you provide examples of recent developments in the market?
N/A
9. What pricing options are available for accessing the report?
Pricing options include single-user, multi-user, and enterprise licenses priced at USD 4750, USD 5250, and USD 8750 respectively.
10. Is the market size provided in terms of value or volume?
The market size is provided in terms of value, measured in billion.
11. Are there any specific market keywords associated with the report?
Yes, the market keyword associated with the report is "Non Thermal Processing Market," which aids in identifying and referencing the specific market segment covered.
12. How do I determine which pricing option suits my needs best?
The pricing options vary based on user requirements and access needs. Individual users may opt for single-user licenses, while businesses requiring broader access may choose multi-user or enterprise licenses for cost-effective access to the report.
13. Are there any additional resources or data provided in the Non Thermal Processing Market report?
While the report offers comprehensive insights, it's advisable to review the specific contents or supplementary materials provided to ascertain if additional resources or data are available.
14. How can I stay updated on further developments or reports in the Non Thermal Processing Market?
To stay informed about further developments, trends, and reports in the Non Thermal Processing Market, consider subscribing to industry newsletters, following relevant companies and organizations, or regularly checking reputable industry news sources and publications.
Methodology
Step 1 - Identification of Relevant Samples Size from Population Database


Step 2 - Approaches for Defining Global Market Size (Value, Volume* & Price*)

Note*: In applicable scenarios
Step 3 - Data Sources
Primary Research
- Web Analytics
- Survey Reports
- Research Institute
- Latest Research Reports
- Opinion Leaders
Secondary Research
- Annual Reports
- White Paper
- Latest Press Release
- Industry Association
- Paid Database
- Investor Presentations

Step 4 - Data Triangulation
Involves using different sources of information in order to increase the validity of a study
These sources are likely to be stakeholders in a program - participants, other researchers, program staff, other community members, and so on.
Then we put all data in single framework & apply various statistical tools to find out the dynamic on the market.
During the analysis stage, feedback from the stakeholder groups would be compared to determine areas of agreement as well as areas of divergence