

Key Insights
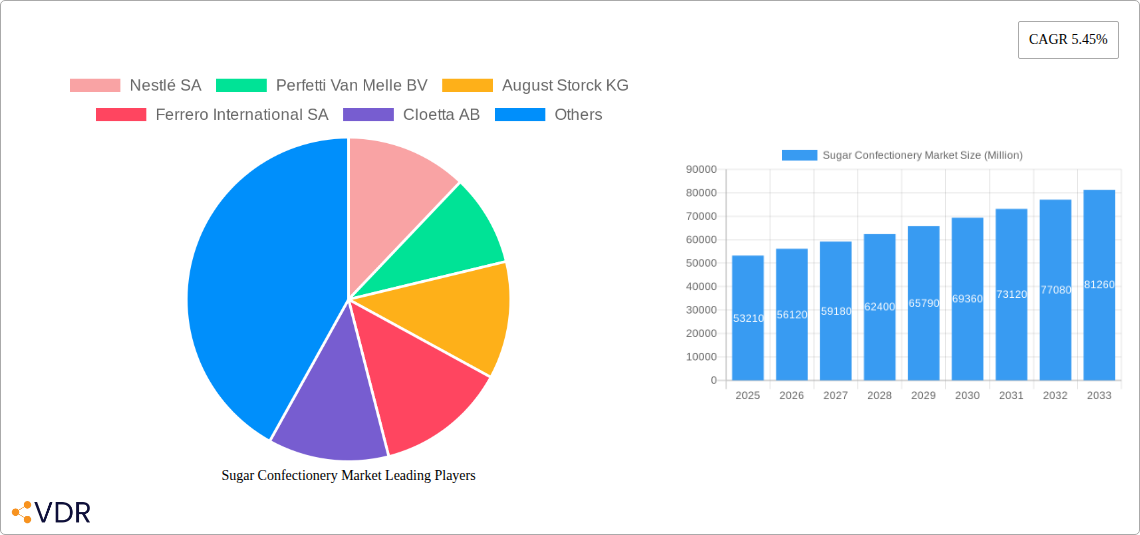
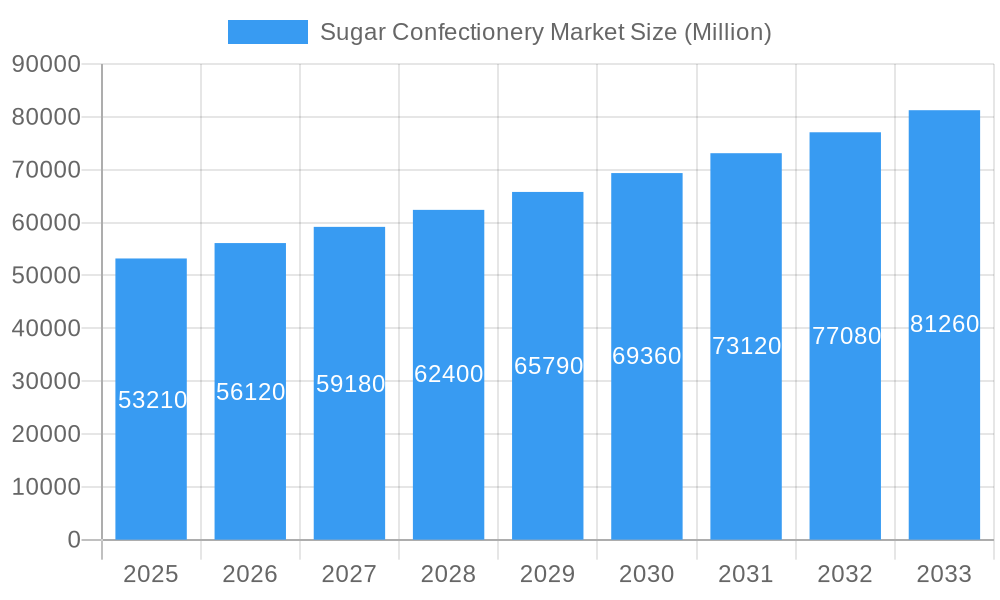
The global sugar confectionery market is poised for robust growth, projected to reach a substantial USD 53,210 million by 2025, expanding at a Compound Annual Growth Rate (CAGR) of 5.45% through 2033. This dynamic market is fueled by an increasing consumer demand for impulse purchases and affordable indulgence. Key growth drivers include the rising disposable incomes in emerging economies, a growing trend towards premium and artisanal sugar confectionery offerings, and innovative product development incorporating novel flavors and healthier ingredients. Furthermore, the convenience of readily available sugar confectionery through diverse distribution channels, from traditional convenience stores to burgeoning online retail platforms, significantly contributes to market expansion. The market's resilience is also evident in its consistent performance despite evolving dietary trends, underscoring the enduring appeal of sweet treats.
Sugar Confectionery Market Market Size (In Billion)
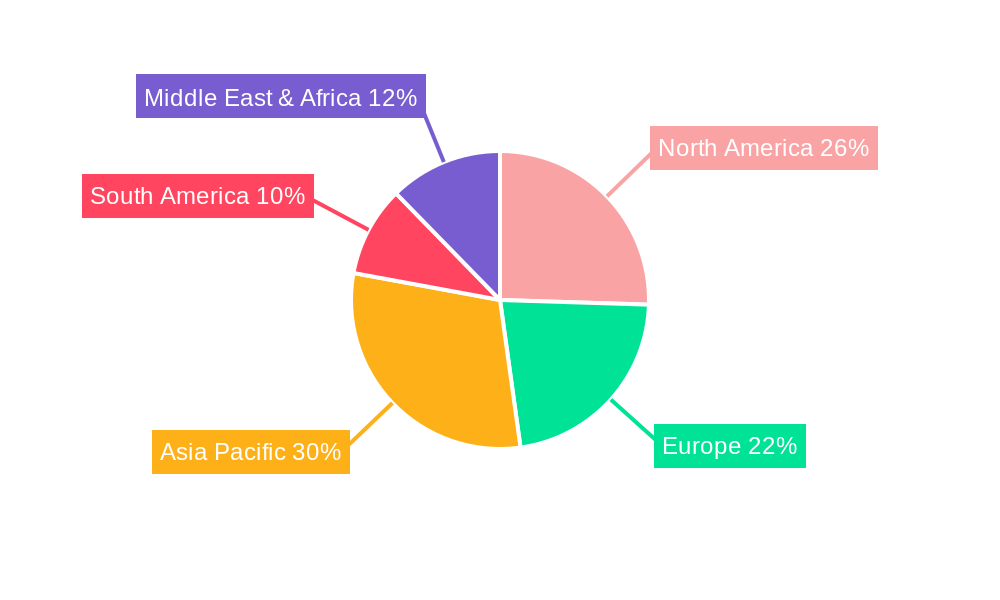
The sugar confectionery landscape is characterized by a diverse array of segments, with Hard Candy, Lollipops, Mints, and Pastilles representing significant categories. Gummies and Jellies, alongside Toffees and Nougats, also command a considerable market share. Distribution channels are equally varied, with convenience stores and supermarkets/hypermarkets remaining dominant, while online retail stores are rapidly gaining traction, offering consumers greater accessibility and choice. Geographically, the Asia Pacific region is expected to exhibit the highest growth potential, driven by its large population, increasing urbanization, and a burgeoning middle class with a growing appetite for confectionery products. North America and Europe, while mature markets, continue to demonstrate steady growth, with a focus on premiumization and new product introductions. Major industry players such as Nestlé SA, Mars Incorporated, The Hershey Company, and Mondelēz International are actively investing in research and development, strategic acquisitions, and expanding their global footprints to capitalize on these market opportunities.
Sugar Confectionery Market Company Market Share
This comprehensive report delivers an in-depth analysis of the global sugar confectionery market, encompassing hard candy, lollipops, mints, gummies, toffees, and nougats. Leveraging robust data and expert insights, we explore the market's dynamics, growth trajectories, and competitive landscape. The study covers the historical period of 2019-2024, the base year of 2025, and projects growth through 2033, providing unparalleled foresight for industry stakeholders. Discover the evolving consumer preferences, technological advancements, and regulatory shifts shaping the future of this dynamic sector.
Sugar Confectionery Market Market Dynamics & Structure
The global sugar confectionery market exhibits a moderate concentration, with major players like Nestlé SA, Perfetti Van Melle BV, August Storck KG, Ferrero International SA, Cloetta AB, Oy Karl Fazer Ab, Mars Incorporated, Arcor S A I C, Mount Franklin Foods LLC, HARIBO Holding GmbH & Co KG, The Hershey Company, Mondelēz International Inc, and Meiji Holdings Company Ltd dominating significant market shares. Technological innovation is a key driver, with companies investing in novel manufacturing processes and healthier ingredient alternatives. Regulatory frameworks, particularly concerning sugar content and labeling, influence product development and market access. The threat of competitive product substitutes, such as sugar-free confectionery and savory snacks, remains a constant challenge. End-user demographics, including a growing demand for premium and indulgent treats, alongside health-conscious consumers, shape product portfolios. Mergers and acquisitions (M&A) are prevalent, enabling market consolidation and expansion into new geographies or product categories, with an estimated xx M&A deals observed in the historical period. Barriers to innovation include the high cost of R&D for new product formulations and the need for extensive consumer testing to ensure market acceptance.
- Market Concentration: Moderate, with a few key players holding substantial market share.
- Technological Innovation Drivers: Focus on process efficiency, new flavor development, and healthier formulations.
- Regulatory Frameworks: Stringent regulations on sugar content, artificial sweeteners, and ingredient sourcing are critical.
- Competitive Substitutes: Growing demand for sugar-free options, functional foods, and savory snacks.
- End-User Demographics: Diverse, spanning impulse buyers, gifting occasions, and health-conscious consumers.
- M&A Trends: Strategic acquisitions for market expansion, product diversification, and technology acquisition.
- Innovation Barriers: High R&D costs, consumer acceptance testing, and ingredient sourcing challenges.
Sugar Confectionery Market Growth Trends & Insights
The sugar confectionery market is poised for robust growth, driven by evolving consumer lifestyles and increasing disposable incomes across emerging economies. The market size is projected to expand at a Compound Annual Growth Rate (CAGR) of approximately xx% from 2025 to 2033, reaching an estimated value of USD xx Billion by the end of the forecast period. Adoption rates for innovative product formats, such as single-serve packs and indulgent premium offerings, are on the rise. Technological disruptions are enabling manufacturers to develop more sophisticated and visually appealing confections, catering to a younger demographic. Consumer behavior shifts towards a demand for transparency in ingredients and a growing interest in ethically sourced products are influencing product development strategies. The market penetration of sugar confectionery remains high globally, with significant opportunities for premiumization and the introduction of functional benefits.
- Market Size Evolution: Steady growth projected, driven by expanding consumer bases and product innovation.
- Adoption Rates: Increasing for convenient packaging, premiumization, and novel flavor profiles.
- Technological Disruptions: Advanced manufacturing techniques, personalized confectionery, and sustainable packaging solutions.
- Consumer Behavior Shifts: Growing demand for transparency, healthier alternatives, and ethical sourcing.
- Market Penetration: High across developed and developing regions, with scope for further growth in emerging markets.
- CAGR: Estimated at xx% for the forecast period 2025-2033.
Dominant Regions, Countries, or Segments in Sugar Confectionery Market
North America, specifically the United States, currently stands as a dominant region in the sugar confectionery market, driven by a mature consumer base with a high propensity for premium and novelty products. The Gummies and Jellies segment is a significant growth engine within this region, exhibiting a market share of approximately xx% in 2025. This dominance is attributed to strong brand loyalty, continuous product innovation by key players, and extensive distribution networks facilitated by Supermarkets/Hypermarkets, which account for a substantial xx% of sales. Economic policies that support consumer spending and well-developed retail infrastructure further bolster growth.
In Europe, Germany and the United Kingdom are key markets, with a strong preference for traditional Hard Candies and Mints, valued for their convenience and affordability. The Online Retail Store distribution channel is experiencing rapid expansion in this region, reflecting changing shopping habits. Asia Pacific, particularly China and India, presents the most significant growth potential, fueled by a rapidly expanding middle class and increasing urbanization. The Toffees and Nougats segment is gaining traction here, alongside a surge in demand for Lollipops targeted at younger demographics. Economic development, rising disposable incomes, and evolving dietary habits are key drivers.
Latin America is emerging as a promising market, with Brazil and Mexico leading the charge. The Others segment, encompassing a variety of regional specialties, is showing promising growth. Robust economic policies aimed at boosting consumer purchasing power and improving retail accessibility are critical.
- Dominant Region: North America, driven by high consumer spending and product innovation.
- Leading Segment: Gummies and Jellies, with substantial market share and growth potential.
- Key Distribution Channel: Supermarkets/Hypermarkets, ensuring wide product availability and impulse purchases.
- Growth Potential Regions: Asia Pacific (China, India) and Latin America (Brazil, Mexico).
- Emerging Segment Trends: Increasing demand for Toffees and Nougats in Asia, and Lollipops for younger consumers.
- Key Drivers of Dominance: Economic policies, disposable income, urbanization, and well-established distribution networks.
Sugar Confectionery Market Product Landscape
The sugar confectionery market is characterized by a vibrant product landscape driven by continuous innovation. Manufacturers are focusing on developing visually appealing and texturally diverse products, ranging from traditional hard candies with intricate designs to chewy gummies infused with exotic fruit flavors. Application areas are expanding beyond simple indulgence to include on-the-go consumption, gifting, and even as ingredients in other food products. Performance metrics such as taste appeal, texture innovation, and shelf-life stability are critical. Unique selling propositions include the use of natural colors and flavors, reduced sugar content, and the incorporation of functional ingredients like vitamins. Technological advancements in molding, enrobing, and flavor encapsulation are enabling the creation of novel confectionery experiences.
Key Drivers, Barriers & Challenges in Sugar Confectionery Market
The sugar confectionery market is propelled by several key drivers, including increasing disposable incomes globally, which fuels impulse purchases and demand for affordable treats. The growing popularity of confectionery as a gifting item, especially during festive seasons, also significantly contributes to market growth. Furthermore, continuous product innovation, including the introduction of new flavors, textures, and formats, caters to evolving consumer preferences. The expansion of retail channels, particularly online platforms, enhances accessibility and broadens consumer reach.
However, the market faces significant challenges. Rising health consciousness among consumers, leading to a preference for healthier alternatives and reduced sugar intake, acts as a major restraint. Stringent government regulations concerning sugar content, labeling, and advertising also pose hurdles for manufacturers. Volatility in raw material prices, such as sugar and cocoa, can impact production costs and profit margins. Intense competition within the market, characterized by numerous players and aggressive pricing strategies, further intensifies these challenges.
Emerging Opportunities in Sugar Confectionery Market
Emerging opportunities in the sugar confectionery market lie in the growing demand for premium and artisanal confectionery products, catering to consumers seeking unique and indulgent experiences. The development of healthier sugar confectionery options, utilizing natural sweeteners and functional ingredients, presents a significant untapped market. Expansion into emerging economies with growing middle classes and increasing purchasing power offers substantial growth potential. Furthermore, innovative packaging solutions, such as sustainable and resealable options, can appeal to environmentally conscious consumers. The rise of personalized confectionery, allowing for custom flavors and designs, also represents a burgeoning opportunity.
Growth Accelerators in the Sugar Confectionery Market Industry
Growth in the sugar confectionery market industry is being accelerated by several catalysts. Technological breakthroughs in ingredient science are enabling the creation of confections with reduced sugar and improved nutritional profiles, without compromising taste. Strategic partnerships between confectionery manufacturers and flavor houses are leading to the development of novel and exciting flavor combinations. Market expansion strategies, including penetrating untapped geographies and leveraging e-commerce platforms for direct-to-consumer sales, are driving revenue growth. The increasing demand for convenience, reflected in single-serve portions and portable packaging, is another significant accelerator.
Key Players Shaping the Sugar Confectionery Market Market
- Nestlé SA
- Perfetti Van Melle BV
- August Storck KG
- Ferrero International SA
- Cloetta AB
- Oy Karl Fazer Ab
- Mars Incorporated
- Arcor S A I C
- Mount Franklin Foods LLC
- HARIBO Holding GmbH & Co KG
- The Hershey Company
- Mondelēz International Inc
- Meiji Holdings Company Ltd
Notable Milestones in Sugar Confectionery Market Sector
- July 2023: HARIBO® officially began gummi production at its first-ever North American manufacturing facility in Pleasant Prairie, Wis., to meet growing US consumer demand.
- June 2023: Tic Tac launched a new spearmint flavor variant in India, addressing the demand for a refreshing mint flavor suitable for diverse daily moments.
- May 2023: Mondelēz International Inc. opened its new Global Research & Development (R&D) Innovation Center in Whippany, New Jersey, with an investment of nearly USD 50 million to support innovation in confectionery and other product categories.
In-Depth Sugar Confectionery Market Market Outlook
The sugar confectionery market is set for sustained growth, driven by a confluence of factors including rising global incomes, a growing appetite for premium and indulgent treats, and continuous product innovation. Key growth accelerators include the development of healthier formulations, expanding distribution channels, and the increasing adoption of e-commerce. Strategic market expansion into emerging economies and a focus on meeting evolving consumer preferences for natural ingredients and unique sensory experiences will be crucial for future success. The market holds significant potential for companies that can effectively balance indulgence with health consciousness and leverage technological advancements to create novel and appealing confectionery products.
Sugar Confectionery Market Segmentation
-
1. Confectionery Variant
- 1.1. Hard Candy
- 1.2. Lollipops
- 1.3. Mints
- 1.4. Pastilles, Gummies, and Jellies
- 1.5. Toffees and Nougats
- 1.6. Others
-
2. Distribution Channel
- 2.1. Convenience Store
- 2.2. Online Retail Store
- 2.3. Supermarket/Hypermarket
- 2.4. Others
Sugar Confectionery Market Segmentation By Geography
-
1. North America
- 1.1. United States
- 1.2. Canada
- 1.3. Mexico
-
2. South America
- 2.1. Brazil
- 2.2. Argentina
- 2.3. Rest of South America
-
3. Europe
- 3.1. United Kingdom
- 3.2. Germany
- 3.3. France
- 3.4. Italy
- 3.5. Spain
- 3.6. Russia
- 3.7. Benelux
- 3.8. Nordics
- 3.9. Rest of Europe
-
4. Middle East & Africa
- 4.1. Turkey
- 4.2. Israel
- 4.3. GCC
- 4.4. North Africa
- 4.5. South Africa
- 4.6. Rest of Middle East & Africa
-
5. Asia Pacific
- 5.1. China
- 5.2. India
- 5.3. Japan
- 5.4. South Korea
- 5.5. ASEAN
- 5.6. Oceania
- 5.7. Rest of Asia Pacific
Sugar Confectionery Market Regional Market Share
Geographic Coverage of Sugar Confectionery Market
Sugar Confectionery Market REPORT HIGHLIGHTS
| Aspects | Details |
|---|---|
| Study Period | 2020-2034 |
| Base Year | 2025 |
| Estimated Year | 2026 |
| Forecast Period | 2026-2034 |
| Historical Period | 2020-2025 |
| Growth Rate | CAGR of 9.1% from 2020-2034 |
| Segmentation |
|
Table of Contents
- 1. Introduction
- 1.1. Research Scope
- 1.2. Market Segmentation
- 1.3. Research Objective
- 1.4. Definitions and Assumptions
- 2. Executive Summary
- 2.1. Market Snapshot
- 3. Market Dynamics
- 3.1. Market Drivers
- 3.2. Market Restrains
- 3.3. Market Trends
- 3.4. Market Opportunities
- 4. Market Factor Analysis
- 4.1. Porters Five Forces
- 4.1.1. Bargaining Power of Suppliers
- 4.1.2. Bargaining Power of Buyers
- 4.1.3. Threat of New Entrants
- 4.1.4. Threat of Substitutes
- 4.1.5. Competitive Rivalry
- 4.2. PESTEL analysis
- 4.3. BCG Analysis
- 4.3.1. Stars (High Growth, High Market Share)
- 4.3.2. Cash Cows (Low Growth, High Market Share)
- 4.3.3. Question Mark (High Growth, Low Market Share)
- 4.3.4. Dogs (Low Growth, Low Market Share)
- 4.4. Ansoff Matrix Analysis
- 4.5. Supply Chain Analysis
- 4.6. Regulatory Landscape
- 4.7. Current Market Potential and Opportunity Assessment (TAM–SAM–SOM Framework)
- 4.8. VDR Analyst Note
- 4.1. Porters Five Forces
- 5. Market Analysis, Insights and Forecast 2021-2033
- 5.1. Market Analysis, Insights and Forecast - by Confectionery Variant
- 5.1.1. Hard Candy
- 5.1.2. Lollipops
- 5.1.3. Mints
- 5.1.4. Pastilles, Gummies, and Jellies
- 5.1.5. Toffees and Nougats
- 5.1.6. Others
- 5.2. Market Analysis, Insights and Forecast - by Distribution Channel
- 5.2.1. Convenience Store
- 5.2.2. Online Retail Store
- 5.2.3. Supermarket/Hypermarket
- 5.2.4. Others
- 5.3. Market Analysis, Insights and Forecast - by Region
- 5.3.1. North America
- 5.3.2. South America
- 5.3.3. Europe
- 5.3.4. Middle East & Africa
- 5.3.5. Asia Pacific
- 5.1. Market Analysis, Insights and Forecast - by Confectionery Variant
- 6. Global Sugar Confectionery Market Analysis, Insights and Forecast, 2021-2033
- 6.1. Market Analysis, Insights and Forecast - by Confectionery Variant
- 6.1.1. Hard Candy
- 6.1.2. Lollipops
- 6.1.3. Mints
- 6.1.4. Pastilles, Gummies, and Jellies
- 6.1.5. Toffees and Nougats
- 6.1.6. Others
- 6.2. Market Analysis, Insights and Forecast - by Distribution Channel
- 6.2.1. Convenience Store
- 6.2.2. Online Retail Store
- 6.2.3. Supermarket/Hypermarket
- 6.2.4. Others
- 6.1. Market Analysis, Insights and Forecast - by Confectionery Variant
- 7. North America Sugar Confectionery Market Analysis, Insights and Forecast, 2021-2033
- 7.1. Market Analysis, Insights and Forecast - by Confectionery Variant
- 7.1.1. Hard Candy
- 7.1.2. Lollipops
- 7.1.3. Mints
- 7.1.4. Pastilles, Gummies, and Jellies
- 7.1.5. Toffees and Nougats
- 7.1.6. Others
- 7.2. Market Analysis, Insights and Forecast - by Distribution Channel
- 7.2.1. Convenience Store
- 7.2.2. Online Retail Store
- 7.2.3. Supermarket/Hypermarket
- 7.2.4. Others
- 7.1. Market Analysis, Insights and Forecast - by Confectionery Variant
- 8. South America Sugar Confectionery Market Analysis, Insights and Forecast, 2021-2033
- 8.1. Market Analysis, Insights and Forecast - by Confectionery Variant
- 8.1.1. Hard Candy
- 8.1.2. Lollipops
- 8.1.3. Mints
- 8.1.4. Pastilles, Gummies, and Jellies
- 8.1.5. Toffees and Nougats
- 8.1.6. Others
- 8.2. Market Analysis, Insights and Forecast - by Distribution Channel
- 8.2.1. Convenience Store
- 8.2.2. Online Retail Store
- 8.2.3. Supermarket/Hypermarket
- 8.2.4. Others
- 8.1. Market Analysis, Insights and Forecast - by Confectionery Variant
- 9. Europe Sugar Confectionery Market Analysis, Insights and Forecast, 2021-2033
- 9.1. Market Analysis, Insights and Forecast - by Confectionery Variant
- 9.1.1. Hard Candy
- 9.1.2. Lollipops
- 9.1.3. Mints
- 9.1.4. Pastilles, Gummies, and Jellies
- 9.1.5. Toffees and Nougats
- 9.1.6. Others
- 9.2. Market Analysis, Insights and Forecast - by Distribution Channel
- 9.2.1. Convenience Store
- 9.2.2. Online Retail Store
- 9.2.3. Supermarket/Hypermarket
- 9.2.4. Others
- 9.1. Market Analysis, Insights and Forecast - by Confectionery Variant
- 10. Middle East & Africa Sugar Confectionery Market Analysis, Insights and Forecast, 2021-2033
- 10.1. Market Analysis, Insights and Forecast - by Confectionery Variant
- 10.1.1. Hard Candy
- 10.1.2. Lollipops
- 10.1.3. Mints
- 10.1.4. Pastilles, Gummies, and Jellies
- 10.1.5. Toffees and Nougats
- 10.1.6. Others
- 10.2. Market Analysis, Insights and Forecast - by Distribution Channel
- 10.2.1. Convenience Store
- 10.2.2. Online Retail Store
- 10.2.3. Supermarket/Hypermarket
- 10.2.4. Others
- 10.1. Market Analysis, Insights and Forecast - by Confectionery Variant
- 11. Asia Pacific Sugar Confectionery Market Analysis, Insights and Forecast, 2021-2033
- 11.1. Market Analysis, Insights and Forecast - by Confectionery Variant
- 11.1.1. Hard Candy
- 11.1.2. Lollipops
- 11.1.3. Mints
- 11.1.4. Pastilles, Gummies, and Jellies
- 11.1.5. Toffees and Nougats
- 11.1.6. Others
- 11.2. Market Analysis, Insights and Forecast - by Distribution Channel
- 11.2.1. Convenience Store
- 11.2.2. Online Retail Store
- 11.2.3. Supermarket/Hypermarket
- 11.2.4. Others
- 11.1. Market Analysis, Insights and Forecast - by Confectionery Variant
- 12. Competitive Analysis
- 12.1. Company Profiles
- 12.1.1 Nestlé SA
- 12.1.1.1. Company Overview
- 12.1.1.2. Products
- 12.1.1.3. Company Financials
- 12.1.1.4. SWOT Analysis
- 12.1.2 Perfetti Van Melle BV
- 12.1.2.1. Company Overview
- 12.1.2.2. Products
- 12.1.2.3. Company Financials
- 12.1.2.4. SWOT Analysis
- 12.1.3 August Storck KG
- 12.1.3.1. Company Overview
- 12.1.3.2. Products
- 12.1.3.3. Company Financials
- 12.1.3.4. SWOT Analysis
- 12.1.4 Ferrero International SA
- 12.1.4.1. Company Overview
- 12.1.4.2. Products
- 12.1.4.3. Company Financials
- 12.1.4.4. SWOT Analysis
- 12.1.5 Cloetta AB
- 12.1.5.1. Company Overview
- 12.1.5.2. Products
- 12.1.5.3. Company Financials
- 12.1.5.4. SWOT Analysis
- 12.1.6 Oy Karl Fazer Ab
- 12.1.6.1. Company Overview
- 12.1.6.2. Products
- 12.1.6.3. Company Financials
- 12.1.6.4. SWOT Analysis
- 12.1.7 Mars Incorporated
- 12.1.7.1. Company Overview
- 12.1.7.2. Products
- 12.1.7.3. Company Financials
- 12.1.7.4. SWOT Analysis
- 12.1.8 Arcor S A I C
- 12.1.8.1. Company Overview
- 12.1.8.2. Products
- 12.1.8.3. Company Financials
- 12.1.8.4. SWOT Analysis
- 12.1.9 Mount Franklin Foods LLC
- 12.1.9.1. Company Overview
- 12.1.9.2. Products
- 12.1.9.3. Company Financials
- 12.1.9.4. SWOT Analysis
- 12.1.10 HARIBO Holding GmbH & Co KG
- 12.1.10.1. Company Overview
- 12.1.10.2. Products
- 12.1.10.3. Company Financials
- 12.1.10.4. SWOT Analysis
- 12.1.11 The Hershey Compan
- 12.1.11.1. Company Overview
- 12.1.11.2. Products
- 12.1.11.3. Company Financials
- 12.1.11.4. SWOT Analysis
- 12.1.12 Mondelēz International Inc
- 12.1.12.1. Company Overview
- 12.1.12.2. Products
- 12.1.12.3. Company Financials
- 12.1.12.4. SWOT Analysis
- 12.1.13 Meiji Holdings Company Ltd
- 12.1.13.1. Company Overview
- 12.1.13.2. Products
- 12.1.13.3. Company Financials
- 12.1.13.4. SWOT Analysis
- 12.1.1 Nestlé SA
- 12.2. Market Entropy
- 12.2.1 Company's Key Areas Served
- 12.2.2 Recent Developments
- 12.3. Company Market Share Analysis 2025
- 12.3.1 Top 5 Companies Market Share Analysis
- 12.3.2 Top 3 Companies Market Share Analysis
- 12.4. List of Potential Customers
- 13. Research Methodology
List of Figures
- Figure 1: Global Sugar Confectionery Market Revenue Breakdown (billion, %) by Region 2025 & 2033
- Figure 2: Global Sugar Confectionery Market Volume Breakdown (K Tons, %) by Region 2025 & 2033
- Figure 3: North America Sugar Confectionery Market Revenue (billion), by Confectionery Variant 2025 & 2033
- Figure 4: North America Sugar Confectionery Market Volume (K Tons), by Confectionery Variant 2025 & 2033
- Figure 5: North America Sugar Confectionery Market Revenue Share (%), by Confectionery Variant 2025 & 2033
- Figure 6: North America Sugar Confectionery Market Volume Share (%), by Confectionery Variant 2025 & 2033
- Figure 7: North America Sugar Confectionery Market Revenue (billion), by Distribution Channel 2025 & 2033
- Figure 8: North America Sugar Confectionery Market Volume (K Tons), by Distribution Channel 2025 & 2033
- Figure 9: North America Sugar Confectionery Market Revenue Share (%), by Distribution Channel 2025 & 2033
- Figure 10: North America Sugar Confectionery Market Volume Share (%), by Distribution Channel 2025 & 2033
- Figure 11: North America Sugar Confectionery Market Revenue (billion), by Country 2025 & 2033
- Figure 12: North America Sugar Confectionery Market Volume (K Tons), by Country 2025 & 2033
- Figure 13: North America Sugar Confectionery Market Revenue Share (%), by Country 2025 & 2033
- Figure 14: North America Sugar Confectionery Market Volume Share (%), by Country 2025 & 2033
- Figure 15: South America Sugar Confectionery Market Revenue (billion), by Confectionery Variant 2025 & 2033
- Figure 16: South America Sugar Confectionery Market Volume (K Tons), by Confectionery Variant 2025 & 2033
- Figure 17: South America Sugar Confectionery Market Revenue Share (%), by Confectionery Variant 2025 & 2033
- Figure 18: South America Sugar Confectionery Market Volume Share (%), by Confectionery Variant 2025 & 2033
- Figure 19: South America Sugar Confectionery Market Revenue (billion), by Distribution Channel 2025 & 2033
- Figure 20: South America Sugar Confectionery Market Volume (K Tons), by Distribution Channel 2025 & 2033
- Figure 21: South America Sugar Confectionery Market Revenue Share (%), by Distribution Channel 2025 & 2033
- Figure 22: South America Sugar Confectionery Market Volume Share (%), by Distribution Channel 2025 & 2033
- Figure 23: South America Sugar Confectionery Market Revenue (billion), by Country 2025 & 2033
- Figure 24: South America Sugar Confectionery Market Volume (K Tons), by Country 2025 & 2033
- Figure 25: South America Sugar Confectionery Market Revenue Share (%), by Country 2025 & 2033
- Figure 26: South America Sugar Confectionery Market Volume Share (%), by Country 2025 & 2033
- Figure 27: Europe Sugar Confectionery Market Revenue (billion), by Confectionery Variant 2025 & 2033
- Figure 28: Europe Sugar Confectionery Market Volume (K Tons), by Confectionery Variant 2025 & 2033
- Figure 29: Europe Sugar Confectionery Market Revenue Share (%), by Confectionery Variant 2025 & 2033
- Figure 30: Europe Sugar Confectionery Market Volume Share (%), by Confectionery Variant 2025 & 2033
- Figure 31: Europe Sugar Confectionery Market Revenue (billion), by Distribution Channel 2025 & 2033
- Figure 32: Europe Sugar Confectionery Market Volume (K Tons), by Distribution Channel 2025 & 2033
- Figure 33: Europe Sugar Confectionery Market Revenue Share (%), by Distribution Channel 2025 & 2033
- Figure 34: Europe Sugar Confectionery Market Volume Share (%), by Distribution Channel 2025 & 2033
- Figure 35: Europe Sugar Confectionery Market Revenue (billion), by Country 2025 & 2033
- Figure 36: Europe Sugar Confectionery Market Volume (K Tons), by Country 2025 & 2033
- Figure 37: Europe Sugar Confectionery Market Revenue Share (%), by Country 2025 & 2033
- Figure 38: Europe Sugar Confectionery Market Volume Share (%), by Country 2025 & 2033
- Figure 39: Middle East & Africa Sugar Confectionery Market Revenue (billion), by Confectionery Variant 2025 & 2033
- Figure 40: Middle East & Africa Sugar Confectionery Market Volume (K Tons), by Confectionery Variant 2025 & 2033
- Figure 41: Middle East & Africa Sugar Confectionery Market Revenue Share (%), by Confectionery Variant 2025 & 2033
- Figure 42: Middle East & Africa Sugar Confectionery Market Volume Share (%), by Confectionery Variant 2025 & 2033
- Figure 43: Middle East & Africa Sugar Confectionery Market Revenue (billion), by Distribution Channel 2025 & 2033
- Figure 44: Middle East & Africa Sugar Confectionery Market Volume (K Tons), by Distribution Channel 2025 & 2033
- Figure 45: Middle East & Africa Sugar Confectionery Market Revenue Share (%), by Distribution Channel 2025 & 2033
- Figure 46: Middle East & Africa Sugar Confectionery Market Volume Share (%), by Distribution Channel 2025 & 2033
- Figure 47: Middle East & Africa Sugar Confectionery Market Revenue (billion), by Country 2025 & 2033
- Figure 48: Middle East & Africa Sugar Confectionery Market Volume (K Tons), by Country 2025 & 2033
- Figure 49: Middle East & Africa Sugar Confectionery Market Revenue Share (%), by Country 2025 & 2033
- Figure 50: Middle East & Africa Sugar Confectionery Market Volume Share (%), by Country 2025 & 2033
- Figure 51: Asia Pacific Sugar Confectionery Market Revenue (billion), by Confectionery Variant 2025 & 2033
- Figure 52: Asia Pacific Sugar Confectionery Market Volume (K Tons), by Confectionery Variant 2025 & 2033
- Figure 53: Asia Pacific Sugar Confectionery Market Revenue Share (%), by Confectionery Variant 2025 & 2033
- Figure 54: Asia Pacific Sugar Confectionery Market Volume Share (%), by Confectionery Variant 2025 & 2033
- Figure 55: Asia Pacific Sugar Confectionery Market Revenue (billion), by Distribution Channel 2025 & 2033
- Figure 56: Asia Pacific Sugar Confectionery Market Volume (K Tons), by Distribution Channel 2025 & 2033
- Figure 57: Asia Pacific Sugar Confectionery Market Revenue Share (%), by Distribution Channel 2025 & 2033
- Figure 58: Asia Pacific Sugar Confectionery Market Volume Share (%), by Distribution Channel 2025 & 2033
- Figure 59: Asia Pacific Sugar Confectionery Market Revenue (billion), by Country 2025 & 2033
- Figure 60: Asia Pacific Sugar Confectionery Market Volume (K Tons), by Country 2025 & 2033
- Figure 61: Asia Pacific Sugar Confectionery Market Revenue Share (%), by Country 2025 & 2033
- Figure 62: Asia Pacific Sugar Confectionery Market Volume Share (%), by Country 2025 & 2033
List of Tables
- Table 1: Global Sugar Confectionery Market Revenue billion Forecast, by Confectionery Variant 2020 & 2033
- Table 2: Global Sugar Confectionery Market Volume K Tons Forecast, by Confectionery Variant 2020 & 2033
- Table 3: Global Sugar Confectionery Market Revenue billion Forecast, by Distribution Channel 2020 & 2033
- Table 4: Global Sugar Confectionery Market Volume K Tons Forecast, by Distribution Channel 2020 & 2033
- Table 5: Global Sugar Confectionery Market Revenue billion Forecast, by Region 2020 & 2033
- Table 6: Global Sugar Confectionery Market Volume K Tons Forecast, by Region 2020 & 2033
- Table 7: Global Sugar Confectionery Market Revenue billion Forecast, by Confectionery Variant 2020 & 2033
- Table 8: Global Sugar Confectionery Market Volume K Tons Forecast, by Confectionery Variant 2020 & 2033
- Table 9: Global Sugar Confectionery Market Revenue billion Forecast, by Distribution Channel 2020 & 2033
- Table 10: Global Sugar Confectionery Market Volume K Tons Forecast, by Distribution Channel 2020 & 2033
- Table 11: Global Sugar Confectionery Market Revenue billion Forecast, by Country 2020 & 2033
- Table 12: Global Sugar Confectionery Market Volume K Tons Forecast, by Country 2020 & 2033
- Table 13: United States Sugar Confectionery Market Revenue (billion) Forecast, by Application 2020 & 2033
- Table 14: United States Sugar Confectionery Market Volume (K Tons) Forecast, by Application 2020 & 2033
- Table 15: Canada Sugar Confectionery Market Revenue (billion) Forecast, by Application 2020 & 2033
- Table 16: Canada Sugar Confectionery Market Volume (K Tons) Forecast, by Application 2020 & 2033
- Table 17: Mexico Sugar Confectionery Market Revenue (billion) Forecast, by Application 2020 & 2033
- Table 18: Mexico Sugar Confectionery Market Volume (K Tons) Forecast, by Application 2020 & 2033
- Table 19: Global Sugar Confectionery Market Revenue billion Forecast, by Confectionery Variant 2020 & 2033
- Table 20: Global Sugar Confectionery Market Volume K Tons Forecast, by Confectionery Variant 2020 & 2033
- Table 21: Global Sugar Confectionery Market Revenue billion Forecast, by Distribution Channel 2020 & 2033
- Table 22: Global Sugar Confectionery Market Volume K Tons Forecast, by Distribution Channel 2020 & 2033
- Table 23: Global Sugar Confectionery Market Revenue billion Forecast, by Country 2020 & 2033
- Table 24: Global Sugar Confectionery Market Volume K Tons Forecast, by Country 2020 & 2033
- Table 25: Brazil Sugar Confectionery Market Revenue (billion) Forecast, by Application 2020 & 2033
- Table 26: Brazil Sugar Confectionery Market Volume (K Tons) Forecast, by Application 2020 & 2033
- Table 27: Argentina Sugar Confectionery Market Revenue (billion) Forecast, by Application 2020 & 2033
- Table 28: Argentina Sugar Confectionery Market Volume (K Tons) Forecast, by Application 2020 & 2033
- Table 29: Rest of South America Sugar Confectionery Market Revenue (billion) Forecast, by Application 2020 & 2033
- Table 30: Rest of South America Sugar Confectionery Market Volume (K Tons) Forecast, by Application 2020 & 2033
- Table 31: Global Sugar Confectionery Market Revenue billion Forecast, by Confectionery Variant 2020 & 2033
- Table 32: Global Sugar Confectionery Market Volume K Tons Forecast, by Confectionery Variant 2020 & 2033
- Table 33: Global Sugar Confectionery Market Revenue billion Forecast, by Distribution Channel 2020 & 2033
- Table 34: Global Sugar Confectionery Market Volume K Tons Forecast, by Distribution Channel 2020 & 2033
- Table 35: Global Sugar Confectionery Market Revenue billion Forecast, by Country 2020 & 2033
- Table 36: Global Sugar Confectionery Market Volume K Tons Forecast, by Country 2020 & 2033
- Table 37: United Kingdom Sugar Confectionery Market Revenue (billion) Forecast, by Application 2020 & 2033
- Table 38: United Kingdom Sugar Confectionery Market Volume (K Tons) Forecast, by Application 2020 & 2033
- Table 39: Germany Sugar Confectionery Market Revenue (billion) Forecast, by Application 2020 & 2033
- Table 40: Germany Sugar Confectionery Market Volume (K Tons) Forecast, by Application 2020 & 2033
- Table 41: France Sugar Confectionery Market Revenue (billion) Forecast, by Application 2020 & 2033
- Table 42: France Sugar Confectionery Market Volume (K Tons) Forecast, by Application 2020 & 2033
- Table 43: Italy Sugar Confectionery Market Revenue (billion) Forecast, by Application 2020 & 2033
- Table 44: Italy Sugar Confectionery Market Volume (K Tons) Forecast, by Application 2020 & 2033
- Table 45: Spain Sugar Confectionery Market Revenue (billion) Forecast, by Application 2020 & 2033
- Table 46: Spain Sugar Confectionery Market Volume (K Tons) Forecast, by Application 2020 & 2033
- Table 47: Russia Sugar Confectionery Market Revenue (billion) Forecast, by Application 2020 & 2033
- Table 48: Russia Sugar Confectionery Market Volume (K Tons) Forecast, by Application 2020 & 2033
- Table 49: Benelux Sugar Confectionery Market Revenue (billion) Forecast, by Application 2020 & 2033
- Table 50: Benelux Sugar Confectionery Market Volume (K Tons) Forecast, by Application 2020 & 2033
- Table 51: Nordics Sugar Confectionery Market Revenue (billion) Forecast, by Application 2020 & 2033
- Table 52: Nordics Sugar Confectionery Market Volume (K Tons) Forecast, by Application 2020 & 2033
- Table 53: Rest of Europe Sugar Confectionery Market Revenue (billion) Forecast, by Application 2020 & 2033
- Table 54: Rest of Europe Sugar Confectionery Market Volume (K Tons) Forecast, by Application 2020 & 2033
- Table 55: Global Sugar Confectionery Market Revenue billion Forecast, by Confectionery Variant 2020 & 2033
- Table 56: Global Sugar Confectionery Market Volume K Tons Forecast, by Confectionery Variant 2020 & 2033
- Table 57: Global Sugar Confectionery Market Revenue billion Forecast, by Distribution Channel 2020 & 2033
- Table 58: Global Sugar Confectionery Market Volume K Tons Forecast, by Distribution Channel 2020 & 2033
- Table 59: Global Sugar Confectionery Market Revenue billion Forecast, by Country 2020 & 2033
- Table 60: Global Sugar Confectionery Market Volume K Tons Forecast, by Country 2020 & 2033
- Table 61: Turkey Sugar Confectionery Market Revenue (billion) Forecast, by Application 2020 & 2033
- Table 62: Turkey Sugar Confectionery Market Volume (K Tons) Forecast, by Application 2020 & 2033
- Table 63: Israel Sugar Confectionery Market Revenue (billion) Forecast, by Application 2020 & 2033
- Table 64: Israel Sugar Confectionery Market Volume (K Tons) Forecast, by Application 2020 & 2033
- Table 65: GCC Sugar Confectionery Market Revenue (billion) Forecast, by Application 2020 & 2033
- Table 66: GCC Sugar Confectionery Market Volume (K Tons) Forecast, by Application 2020 & 2033
- Table 67: North Africa Sugar Confectionery Market Revenue (billion) Forecast, by Application 2020 & 2033
- Table 68: North Africa Sugar Confectionery Market Volume (K Tons) Forecast, by Application 2020 & 2033
- Table 69: South Africa Sugar Confectionery Market Revenue (billion) Forecast, by Application 2020 & 2033
- Table 70: South Africa Sugar Confectionery Market Volume (K Tons) Forecast, by Application 2020 & 2033
- Table 71: Rest of Middle East & Africa Sugar Confectionery Market Revenue (billion) Forecast, by Application 2020 & 2033
- Table 72: Rest of Middle East & Africa Sugar Confectionery Market Volume (K Tons) Forecast, by Application 2020 & 2033
- Table 73: Global Sugar Confectionery Market Revenue billion Forecast, by Confectionery Variant 2020 & 2033
- Table 74: Global Sugar Confectionery Market Volume K Tons Forecast, by Confectionery Variant 2020 & 2033
- Table 75: Global Sugar Confectionery Market Revenue billion Forecast, by Distribution Channel 2020 & 2033
- Table 76: Global Sugar Confectionery Market Volume K Tons Forecast, by Distribution Channel 2020 & 2033
- Table 77: Global Sugar Confectionery Market Revenue billion Forecast, by Country 2020 & 2033
- Table 78: Global Sugar Confectionery Market Volume K Tons Forecast, by Country 2020 & 2033
- Table 79: China Sugar Confectionery Market Revenue (billion) Forecast, by Application 2020 & 2033
- Table 80: China Sugar Confectionery Market Volume (K Tons) Forecast, by Application 2020 & 2033
- Table 81: India Sugar Confectionery Market Revenue (billion) Forecast, by Application 2020 & 2033
- Table 82: India Sugar Confectionery Market Volume (K Tons) Forecast, by Application 2020 & 2033
- Table 83: Japan Sugar Confectionery Market Revenue (billion) Forecast, by Application 2020 & 2033
- Table 84: Japan Sugar Confectionery Market Volume (K Tons) Forecast, by Application 2020 & 2033
- Table 85: South Korea Sugar Confectionery Market Revenue (billion) Forecast, by Application 2020 & 2033
- Table 86: South Korea Sugar Confectionery Market Volume (K Tons) Forecast, by Application 2020 & 2033
- Table 87: ASEAN Sugar Confectionery Market Revenue (billion) Forecast, by Application 2020 & 2033
- Table 88: ASEAN Sugar Confectionery Market Volume (K Tons) Forecast, by Application 2020 & 2033
- Table 89: Oceania Sugar Confectionery Market Revenue (billion) Forecast, by Application 2020 & 2033
- Table 90: Oceania Sugar Confectionery Market Volume (K Tons) Forecast, by Application 2020 & 2033
- Table 91: Rest of Asia Pacific Sugar Confectionery Market Revenue (billion) Forecast, by Application 2020 & 2033
- Table 92: Rest of Asia Pacific Sugar Confectionery Market Volume (K Tons) Forecast, by Application 2020 & 2033
Frequently Asked Questions
1. What is the projected Compound Annual Growth Rate (CAGR) of the Sugar Confectionery Market?
The projected CAGR is approximately 9.1%.
2. Which companies are prominent players in the Sugar Confectionery Market?
Key companies in the market include Nestlé SA, Perfetti Van Melle BV, August Storck KG, Ferrero International SA, Cloetta AB, Oy Karl Fazer Ab, Mars Incorporated, Arcor S A I C, Mount Franklin Foods LLC, HARIBO Holding GmbH & Co KG, The Hershey Compan, Mondelēz International Inc, Meiji Holdings Company Ltd.
3. What are the main segments of the Sugar Confectionery Market?
The market segments include Confectionery Variant, Distribution Channel.
4. Can you provide details about the market size?
The market size is estimated to be USD 2.55 billion as of 2022.
5. What are some drivers contributing to market growth?
Increasing demand for meat alternatives.
6. What are the notable trends driving market growth?
OTHER KEY INDUSTRY TRENDS COVERED IN THE REPORT.
7. Are there any restraints impacting market growth?
Presence of numerous alternatives in the plant proteins.
8. Can you provide examples of recent developments in the market?
July 2023: HARIBO® officially began gummi production at its first-ever North American manufacturing facility, located in Pleasant Prairie, Wis. The brand-new, state-of-the-art factory was created to meet the growing demand by US consumers of the beloved gummi brand, which produces over 25 varieties of gummi treats in the US and more than 1,200 types globally.June 2023: Tic Tac launched a new spearmint flavor variant in India. The introduction of this refreshing and strong mint variant is aimed at meeting the longstanding demand for a flavor that can be enjoyed in diverse moments throughout the day, such as after meals, workouts, and before important meetings.May 2023: Mondelēz International Inc. opened its new Global Research & Development (R&D) Innovation Center in Whippany, New Jersey. The state-of-the-art facility, which is supported by an investment of nearly USD 50 million, includes pilot and scale-up capability for cookies, crackers, and candy.
9. What pricing options are available for accessing the report?
Pricing options include single-user, multi-user, and enterprise licenses priced at USD 3800, USD 4500, and USD 5800 respectively.
10. Is the market size provided in terms of value or volume?
The market size is provided in terms of value, measured in billion and volume, measured in K Tons.
11. Are there any specific market keywords associated with the report?
Yes, the market keyword associated with the report is "Sugar Confectionery Market," which aids in identifying and referencing the specific market segment covered.
12. How do I determine which pricing option suits my needs best?
The pricing options vary based on user requirements and access needs. Individual users may opt for single-user licenses, while businesses requiring broader access may choose multi-user or enterprise licenses for cost-effective access to the report.
13. Are there any additional resources or data provided in the Sugar Confectionery Market report?
While the report offers comprehensive insights, it's advisable to review the specific contents or supplementary materials provided to ascertain if additional resources or data are available.
14. How can I stay updated on further developments or reports in the Sugar Confectionery Market?
To stay informed about further developments, trends, and reports in the Sugar Confectionery Market, consider subscribing to industry newsletters, following relevant companies and organizations, or regularly checking reputable industry news sources and publications.
Methodology
Step 1 - Identification of Relevant Samples Size from Population Database


Step 2 - Approaches for Defining Global Market Size (Value, Volume* & Price*)

Note*: In applicable scenarios
Step 3 - Data Sources
Primary Research
- Web Analytics
- Survey Reports
- Research Institute
- Latest Research Reports
- Opinion Leaders
Secondary Research
- Annual Reports
- White Paper
- Latest Press Release
- Industry Association
- Paid Database
- Investor Presentations

Step 4 - Data Triangulation
Involves using different sources of information in order to increase the validity of a study
These sources are likely to be stakeholders in a program - participants, other researchers, program staff, other community members, and so on.
Then we put all data in single framework & apply various statistical tools to find out the dynamic on the market.
During the analysis stage, feedback from the stakeholder groups would be compared to determine areas of agreement as well as areas of divergence