
Key Insights
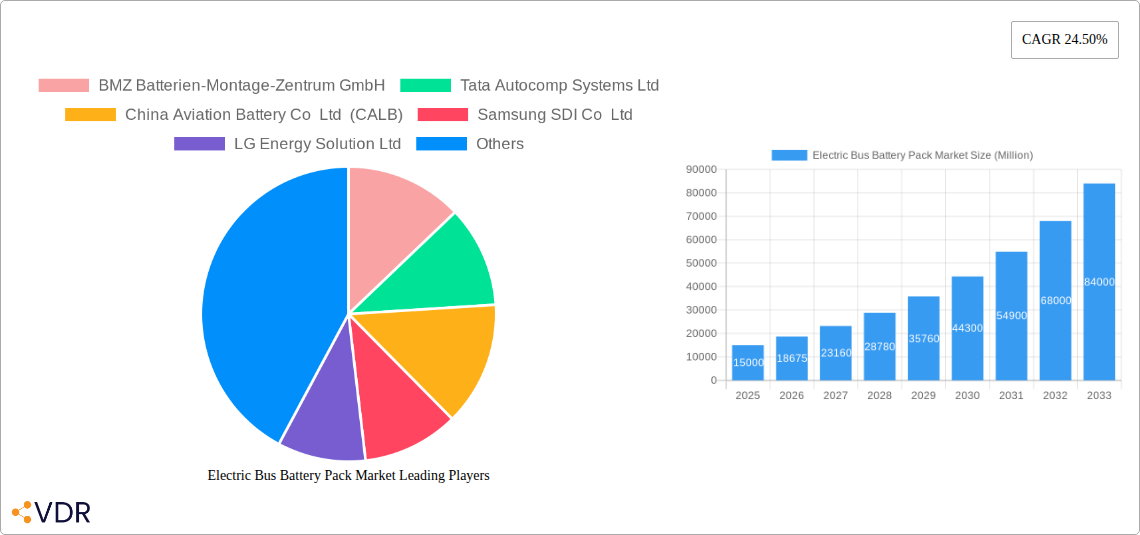
The electric bus battery pack market is experiencing robust growth, driven by stringent emission regulations globally and the increasing adoption of electric vehicles (EVs) for public transportation. The market's Compound Annual Growth Rate (CAGR) of 24.50% from 2019 to 2024 indicates significant expansion, projected to continue into the forecast period (2025-2033). Several factors contribute to this growth, including technological advancements leading to higher energy density and longer battery life, improved charging infrastructure, and government incentives promoting the transition to electric public transport. The diverse range of battery chemistries (LFP, NCA, NCM, NMC), form factors (cylindrical, pouch, prismatic), and capacities (from less than 15 kWh to above 80 kWh) cater to varying bus sizes and operational requirements. Leading manufacturers like CATL, BYD, LG Energy Solution, and Samsung SDI are driving innovation and expanding production capacity to meet the surging demand. While challenges remain, such as high initial investment costs and the need for efficient battery recycling solutions, the overall market outlook remains positive.
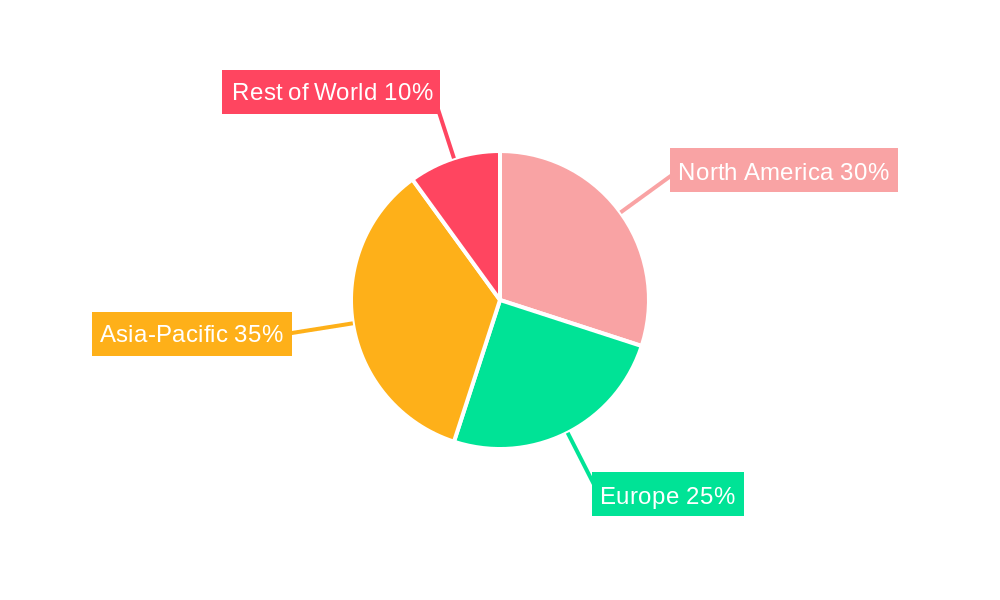
The market segmentation reveals significant opportunities across various aspects. The high-capacity battery segment (above 80 kWh) is expected to witness substantial growth due to the increasing demand for longer operational ranges in electric buses. Similarly, the NMC and NCM battery chemistries are gaining traction due to their superior energy density and performance characteristics. Regionally, mature markets like North America and Europe are expected to maintain strong growth, while emerging economies in Asia-Pacific are poised to experience rapid expansion. The competitive landscape is characterized by both established battery manufacturers and emerging players, leading to continuous innovation and price competition, benefiting consumers and contributing to broader market penetration. The long-term outlook suggests that the electric bus battery pack market will continue its upward trajectory, fueled by sustainable transportation initiatives and technological advancements.
Electric Bus Battery Pack Market: A Comprehensive Report (2019-2033)
This comprehensive report provides a detailed analysis of the Electric Bus Battery Pack market, encompassing its current state, future trajectory, and key players. We delve into the parent market of electric vehicle batteries and the child market specifically focusing on electric bus battery packs, offering invaluable insights for industry professionals, investors, and strategic decision-makers. The report covers the period from 2019 to 2033, with 2025 serving as the base and estimated year. The market size is presented in million units.
Electric Bus Battery Pack Market Dynamics & Structure
The electric bus battery pack market is characterized by a moderately concentrated landscape with several key players vying for market share. Technological innovation, particularly in battery chemistry (LFP, NCA, NCM, NMC) and capacity (15 kWh to 40 kWh, 40 kWh to 80 kWh, above 80 kWh), is a major driver of growth. Stringent government regulations promoting electric mobility and reducing carbon emissions are further propelling market expansion. However, the high initial investment costs and limited battery lifespan present significant challenges. The market also witnesses competitive pressure from alternative propulsion systems (PHEV) and ongoing developments in battery recycling and reuse technologies. M&A activity remains significant, with xx deals recorded between 2019 and 2024, representing a xx% increase compared to the previous period. Market concentration is estimated at xx% in 2025, with the top 5 players holding xx% of the market share.
- Market Concentration: Moderately concentrated, top 5 players holding xx% of market share in 2025.
- Technological Innovation: Focus on improving energy density, lifespan, and safety.
- Regulatory Landscape: Stringent emission norms driving adoption.
- Competitive Substitutes: Internal combustion engine buses, hybrid electric buses.
- End-User Demographics: Primarily public transportation agencies and private bus operators.
- M&A Trends: xx deals between 2019-2024, representing a xx% increase.
Electric Bus Battery Pack Market Growth Trends & Insights
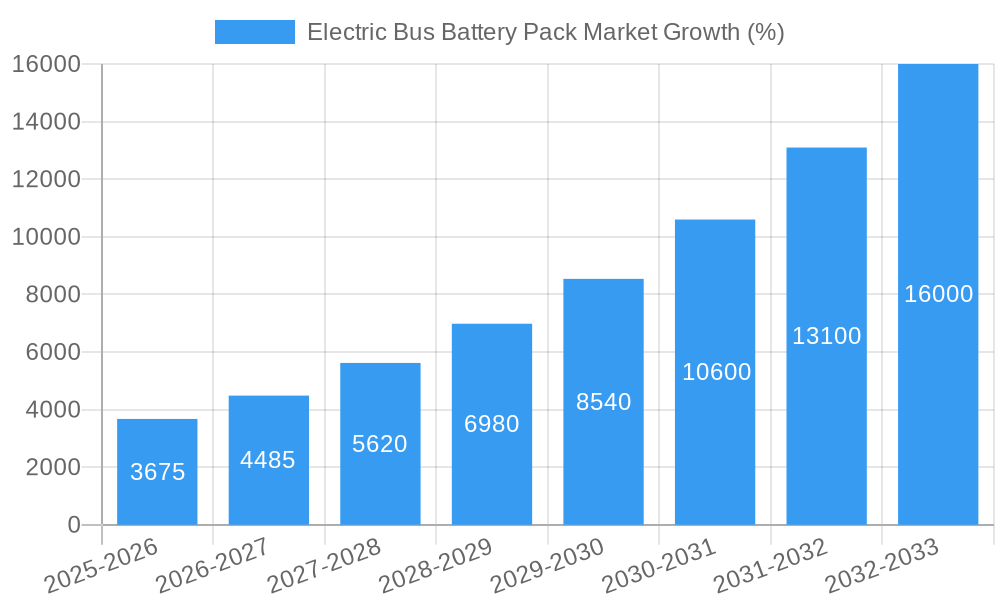
The global electric bus battery pack market is experiencing robust growth, driven by the increasing adoption of electric buses across various regions. The market size expanded from xx million units in 2019 to xx million units in 2024, exhibiting a CAGR of xx% during the historical period. This growth is fueled by government incentives, rising environmental concerns, and the decreasing cost of battery technology. Technological disruptions, such as advancements in solid-state batteries and improved battery management systems (BMS), are further enhancing the market outlook. Consumer behavior shifts towards sustainable transportation options are also contributing positively. We project a CAGR of xx% from 2025 to 2033, with the market size reaching xx million units by 2033. Market penetration is projected to reach xx% by 2033. Factors like improving charging infrastructure and advancements in battery technology are major growth catalysts.
Dominant Regions, Countries, or Segments in Electric Bus Battery Pack Market
The electric bus battery pack market is witnessing significant growth across several regions and segments. China continues to dominate the market, driven by strong government support for electric vehicle adoption and a large-scale deployment of electric bus fleets. Europe and North America are also experiencing substantial growth, fueled by increasing environmental concerns and supportive government policies. Among the segments, the prismatic battery form factor holds the largest market share due to its high energy density and cost-effectiveness, followed by cylindrical and pouch. The lithium-ion battery chemistry, particularly LFP and NCM, dominates the market owing to its high energy density and relatively low cost. The BEV (Battery Electric Vehicle) propulsion type dominates the market due to its higher efficiency. The high capacity segment (above 80 kWh) is expanding rapidly due to increasing demand for longer range electric buses.
- Key Drivers: Stringent emission regulations, government subsidies, and increasing environmental awareness.
- Dominant Regions: China, Europe, and North America.
- Dominant Segments: Prismatic battery form factor, lithium-ion chemistry (LFP and NCM), BEV propulsion type, and above 80 kWh capacity.
Electric Bus Battery Pack Market Product Landscape
Electric bus battery packs are continuously evolving, with advancements in energy density, safety features, and thermal management systems. Innovations focus on improving battery life, reducing weight, and enhancing charging speeds. Key applications include urban transit, intercity transport, and school buses. Performance metrics such as energy density (Wh/kg), cycle life, and charging time are crucial factors influencing market adoption. Unique selling propositions include enhanced safety features, improved thermal management, and optimized battery management systems. Technological advancements are focused on solid-state batteries, faster charging technologies, and improved battery life cycles.
Key Drivers, Barriers & Challenges in Electric Bus Battery Pack Market
Key Drivers:
- Growing demand for sustainable transportation.
- Stringent government regulations on emissions.
- Advances in battery technology leading to increased energy density and reduced costs.
- Government incentives and subsidies promoting electric bus adoption.
Challenges & Restraints:
- High initial cost of electric bus battery packs.
- Limited battery lifespan and high replacement costs.
- Concerns regarding battery safety and thermal runaway.
- Supply chain disruptions affecting the availability of raw materials. This resulted in a xx% increase in battery pack costs in 2024.
Emerging Opportunities in Electric Bus Battery Pack Market
- Growth in developing economies with increasing urbanization and transportation needs.
- Development of fast-charging infrastructure to overcome range anxiety.
- Integration of advanced battery management systems for improved battery performance and safety.
- Exploration of alternative battery chemistries like solid-state batteries for enhanced energy density and lifespan.
Growth Accelerators in the Electric Bus Battery Pack Market Industry
Long-term growth in the electric bus battery pack market is expected to be driven by continuous technological advancements, particularly in battery chemistry and energy density. Strategic partnerships between battery manufacturers, bus manufacturers, and charging infrastructure providers will play a crucial role in accelerating market expansion. Government policies promoting electric mobility and investments in research and development will further stimulate market growth. Expansion into untapped markets in developing countries and the integration of smart technologies will also contribute to the market's continued growth.
Key Players Shaping the Electric Bus Battery Pack Market Market
- BMZ Batterien-Montage-Zentrum GmbH
- Tata Autocomp Systems Ltd
- China Aviation Battery Co Ltd (CALB)
- Samsung SDI Co Ltd
- LG Energy Solution Ltd
- Guoxuan High-tech Co Ltd
- Farasis Energy (Ganzhou) Co Ltd
- Gotion High-Tech Co Ltd
- TOSHIBA Corp
- Contemporary Amperex Technology Co Ltd (CATL)
- NFI Group Inc
- Leclanché SA
- BYD Company Ltd
- Sunwoda Electric Vehicle Battery Co Ltd (Sunwoda)
- Proterra Operating Company Inc
- Panasonic Holdings Corporation
Notable Milestones in Electric Bus Battery Pack Market Sector
- November 2022: Samsung SDI partnered with Sungkyunkwan University to develop battery technology expertise.
- January 2023: Samsung SDI reported record profits driven by strong EV battery demand.
- February 2023: Samsung SDI expanded its Hungary plant to meet growing demand for mid- to large-size batteries.
In-Depth Electric Bus Battery Pack Market Market Outlook
The future of the electric bus battery pack market appears bright, driven by a confluence of factors. Continued technological innovation, particularly in solid-state batteries and improved energy density, will lower costs and enhance performance. Government regulations promoting electric mobility will continue to drive adoption, while increasing urbanization and the need for sustainable transportation solutions will further expand the market. Strategic partnerships and investments in charging infrastructure will address range anxiety and improve the overall electric bus user experience. This will lead to a sustained period of high growth, with significant opportunities for market players who can adapt to technological advancements and changing market dynamics.
Electric Bus Battery Pack Market Segmentation
-
1. Propulsion Type
- 1.1. BEV
- 1.2. PHEV
-
2. Battery Chemistry
- 2.1. LFP
- 2.2. NCA
- 2.3. NCM
- 2.4. NMC
- 2.5. Others
-
3. Capacity
- 3.1. 15 kWh to 40 kWh
- 3.2. 40 kWh to 80 kWh
- 3.3. Above 80 kWh
- 3.4. Less than 15 kWh
-
4. Battery Form
- 4.1. Cylindrical
- 4.2. Pouch
- 4.3. Prismatic
-
5. Method
- 5.1. Laser
- 5.2. Wire
-
6. Component
- 6.1. Anode
- 6.2. Cathode
- 6.3. Electrolyte
- 6.4. Separator
-
7. Material Type
- 7.1. Cobalt
- 7.2. Lithium
- 7.3. Manganese
- 7.4. Natural Graphite
- 7.5. Nickel
- 7.6. Other Materials
Electric Bus Battery Pack Market Segmentation By Geography
-
1. North America
- 1.1. United States
- 1.2. Canada
- 1.3. Mexico
-
2. South America
- 2.1. Brazil
- 2.2. Argentina
- 2.3. Rest of South America
-
3. Europe
- 3.1. United Kingdom
- 3.2. Germany
- 3.3. France
- 3.4. Italy
- 3.5. Spain
- 3.6. Russia
- 3.7. Benelux
- 3.8. Nordics
- 3.9. Rest of Europe
-
4. Middle East & Africa
- 4.1. Turkey
- 4.2. Israel
- 4.3. GCC
- 4.4. North Africa
- 4.5. South Africa
- 4.6. Rest of Middle East & Africa
-
5. Asia Pacific
- 5.1. China
- 5.2. India
- 5.3. Japan
- 5.4. South Korea
- 5.5. ASEAN
- 5.6. Oceania
- 5.7. Rest of Asia Pacific
Electric Bus Battery Pack Market REPORT HIGHLIGHTS
| Aspects | Details |
|---|---|
| Study Period | 2019-2033 |
| Base Year | 2024 |
| Estimated Year | 2025 |
| Forecast Period | 2025-2033 |
| Historical Period | 2019-2024 |
| Growth Rate | CAGR of 24.50% from 2019-2033 |
| Segmentation |
|
Table of Contents
- 1. Introduction
- 1.1. Research Scope
- 1.2. Market Segmentation
- 1.3. Research Methodology
- 1.4. Definitions and Assumptions
- 2. Executive Summary
- 2.1. Introduction
- 3. Market Dynamics
- 3.1. Introduction
- 3.2. Market Drivers
- 3.2.1. Exponential Increase in Automotive Sector
- 3.3. Market Restrains
- 3.3.1. Digitization of R&D Operations in Automotive Sector
- 3.4. Market Trends
- 3.4.1. OTHER KEY INDUSTRY TRENDS COVERED IN THE REPORT
- 4. Market Factor Analysis
- 4.1. Porters Five Forces
- 4.2. Supply/Value Chain
- 4.3. PESTEL analysis
- 4.4. Market Entropy
- 4.5. Patent/Trademark Analysis
- 5. Global Electric Bus Battery Pack Market Analysis, Insights and Forecast, 2019-2031
- 5.1. Market Analysis, Insights and Forecast - by Propulsion Type
- 5.1.1. BEV
- 5.1.2. PHEV
- 5.2. Market Analysis, Insights and Forecast - by Battery Chemistry
- 5.2.1. LFP
- 5.2.2. NCA
- 5.2.3. NCM
- 5.2.4. NMC
- 5.2.5. Others
- 5.3. Market Analysis, Insights and Forecast - by Capacity
- 5.3.1. 15 kWh to 40 kWh
- 5.3.2. 40 kWh to 80 kWh
- 5.3.3. Above 80 kWh
- 5.3.4. Less than 15 kWh
- 5.4. Market Analysis, Insights and Forecast - by Battery Form
- 5.4.1. Cylindrical
- 5.4.2. Pouch
- 5.4.3. Prismatic
- 5.5. Market Analysis, Insights and Forecast - by Method
- 5.5.1. Laser
- 5.5.2. Wire
- 5.6. Market Analysis, Insights and Forecast - by Component
- 5.6.1. Anode
- 5.6.2. Cathode
- 5.6.3. Electrolyte
- 5.6.4. Separator
- 5.7. Market Analysis, Insights and Forecast - by Material Type
- 5.7.1. Cobalt
- 5.7.2. Lithium
- 5.7.3. Manganese
- 5.7.4. Natural Graphite
- 5.7.5. Nickel
- 5.7.6. Other Materials
- 5.8. Market Analysis, Insights and Forecast - by Region
- 5.8.1. North America
- 5.8.2. South America
- 5.8.3. Europe
- 5.8.4. Middle East & Africa
- 5.8.5. Asia Pacific
- 5.1. Market Analysis, Insights and Forecast - by Propulsion Type
- 6. North America Electric Bus Battery Pack Market Analysis, Insights and Forecast, 2019-2031
- 6.1. Market Analysis, Insights and Forecast - by Propulsion Type
- 6.1.1. BEV
- 6.1.2. PHEV
- 6.2. Market Analysis, Insights and Forecast - by Battery Chemistry
- 6.2.1. LFP
- 6.2.2. NCA
- 6.2.3. NCM
- 6.2.4. NMC
- 6.2.5. Others
- 6.3. Market Analysis, Insights and Forecast - by Capacity
- 6.3.1. 15 kWh to 40 kWh
- 6.3.2. 40 kWh to 80 kWh
- 6.3.3. Above 80 kWh
- 6.3.4. Less than 15 kWh
- 6.4. Market Analysis, Insights and Forecast - by Battery Form
- 6.4.1. Cylindrical
- 6.4.2. Pouch
- 6.4.3. Prismatic
- 6.5. Market Analysis, Insights and Forecast - by Method
- 6.5.1. Laser
- 6.5.2. Wire
- 6.6. Market Analysis, Insights and Forecast - by Component
- 6.6.1. Anode
- 6.6.2. Cathode
- 6.6.3. Electrolyte
- 6.6.4. Separator
- 6.7. Market Analysis, Insights and Forecast - by Material Type
- 6.7.1. Cobalt
- 6.7.2. Lithium
- 6.7.3. Manganese
- 6.7.4. Natural Graphite
- 6.7.5. Nickel
- 6.7.6. Other Materials
- 6.1. Market Analysis, Insights and Forecast - by Propulsion Type
- 7. South America Electric Bus Battery Pack Market Analysis, Insights and Forecast, 2019-2031
- 7.1. Market Analysis, Insights and Forecast - by Propulsion Type
- 7.1.1. BEV
- 7.1.2. PHEV
- 7.2. Market Analysis, Insights and Forecast - by Battery Chemistry
- 7.2.1. LFP
- 7.2.2. NCA
- 7.2.3. NCM
- 7.2.4. NMC
- 7.2.5. Others
- 7.3. Market Analysis, Insights and Forecast - by Capacity
- 7.3.1. 15 kWh to 40 kWh
- 7.3.2. 40 kWh to 80 kWh
- 7.3.3. Above 80 kWh
- 7.3.4. Less than 15 kWh
- 7.4. Market Analysis, Insights and Forecast - by Battery Form
- 7.4.1. Cylindrical
- 7.4.2. Pouch
- 7.4.3. Prismatic
- 7.5. Market Analysis, Insights and Forecast - by Method
- 7.5.1. Laser
- 7.5.2. Wire
- 7.6. Market Analysis, Insights and Forecast - by Component
- 7.6.1. Anode
- 7.6.2. Cathode
- 7.6.3. Electrolyte
- 7.6.4. Separator
- 7.7. Market Analysis, Insights and Forecast - by Material Type
- 7.7.1. Cobalt
- 7.7.2. Lithium
- 7.7.3. Manganese
- 7.7.4. Natural Graphite
- 7.7.5. Nickel
- 7.7.6. Other Materials
- 7.1. Market Analysis, Insights and Forecast - by Propulsion Type
- 8. Europe Electric Bus Battery Pack Market Analysis, Insights and Forecast, 2019-2031
- 8.1. Market Analysis, Insights and Forecast - by Propulsion Type
- 8.1.1. BEV
- 8.1.2. PHEV
- 8.2. Market Analysis, Insights and Forecast - by Battery Chemistry
- 8.2.1. LFP
- 8.2.2. NCA
- 8.2.3. NCM
- 8.2.4. NMC
- 8.2.5. Others
- 8.3. Market Analysis, Insights and Forecast - by Capacity
- 8.3.1. 15 kWh to 40 kWh
- 8.3.2. 40 kWh to 80 kWh
- 8.3.3. Above 80 kWh
- 8.3.4. Less than 15 kWh
- 8.4. Market Analysis, Insights and Forecast - by Battery Form
- 8.4.1. Cylindrical
- 8.4.2. Pouch
- 8.4.3. Prismatic
- 8.5. Market Analysis, Insights and Forecast - by Method
- 8.5.1. Laser
- 8.5.2. Wire
- 8.6. Market Analysis, Insights and Forecast - by Component
- 8.6.1. Anode
- 8.6.2. Cathode
- 8.6.3. Electrolyte
- 8.6.4. Separator
- 8.7. Market Analysis, Insights and Forecast - by Material Type
- 8.7.1. Cobalt
- 8.7.2. Lithium
- 8.7.3. Manganese
- 8.7.4. Natural Graphite
- 8.7.5. Nickel
- 8.7.6. Other Materials
- 8.1. Market Analysis, Insights and Forecast - by Propulsion Type
- 9. Middle East & Africa Electric Bus Battery Pack Market Analysis, Insights and Forecast, 2019-2031
- 9.1. Market Analysis, Insights and Forecast - by Propulsion Type
- 9.1.1. BEV
- 9.1.2. PHEV
- 9.2. Market Analysis, Insights and Forecast - by Battery Chemistry
- 9.2.1. LFP
- 9.2.2. NCA
- 9.2.3. NCM
- 9.2.4. NMC
- 9.2.5. Others
- 9.3. Market Analysis, Insights and Forecast - by Capacity
- 9.3.1. 15 kWh to 40 kWh
- 9.3.2. 40 kWh to 80 kWh
- 9.3.3. Above 80 kWh
- 9.3.4. Less than 15 kWh
- 9.4. Market Analysis, Insights and Forecast - by Battery Form
- 9.4.1. Cylindrical
- 9.4.2. Pouch
- 9.4.3. Prismatic
- 9.5. Market Analysis, Insights and Forecast - by Method
- 9.5.1. Laser
- 9.5.2. Wire
- 9.6. Market Analysis, Insights and Forecast - by Component
- 9.6.1. Anode
- 9.6.2. Cathode
- 9.6.3. Electrolyte
- 9.6.4. Separator
- 9.7. Market Analysis, Insights and Forecast - by Material Type
- 9.7.1. Cobalt
- 9.7.2. Lithium
- 9.7.3. Manganese
- 9.7.4. Natural Graphite
- 9.7.5. Nickel
- 9.7.6. Other Materials
- 9.1. Market Analysis, Insights and Forecast - by Propulsion Type
- 10. Asia Pacific Electric Bus Battery Pack Market Analysis, Insights and Forecast, 2019-2031
- 10.1. Market Analysis, Insights and Forecast - by Propulsion Type
- 10.1.1. BEV
- 10.1.2. PHEV
- 10.2. Market Analysis, Insights and Forecast - by Battery Chemistry
- 10.2.1. LFP
- 10.2.2. NCA
- 10.2.3. NCM
- 10.2.4. NMC
- 10.2.5. Others
- 10.3. Market Analysis, Insights and Forecast - by Capacity
- 10.3.1. 15 kWh to 40 kWh
- 10.3.2. 40 kWh to 80 kWh
- 10.3.3. Above 80 kWh
- 10.3.4. Less than 15 kWh
- 10.4. Market Analysis, Insights and Forecast - by Battery Form
- 10.4.1. Cylindrical
- 10.4.2. Pouch
- 10.4.3. Prismatic
- 10.5. Market Analysis, Insights and Forecast - by Method
- 10.5.1. Laser
- 10.5.2. Wire
- 10.6. Market Analysis, Insights and Forecast - by Component
- 10.6.1. Anode
- 10.6.2. Cathode
- 10.6.3. Electrolyte
- 10.6.4. Separator
- 10.7. Market Analysis, Insights and Forecast - by Material Type
- 10.7.1. Cobalt
- 10.7.2. Lithium
- 10.7.3. Manganese
- 10.7.4. Natural Graphite
- 10.7.5. Nickel
- 10.7.6. Other Materials
- 10.1. Market Analysis, Insights and Forecast - by Propulsion Type
- 11. Competitive Analysis
- 11.1. Global Market Share Analysis 2024
- 11.2. Company Profiles
- 11.2.1 BMZ Batterien-Montage-Zentrum GmbH
- 11.2.1.1. Overview
- 11.2.1.2. Products
- 11.2.1.3. SWOT Analysis
- 11.2.1.4. Recent Developments
- 11.2.1.5. Financials (Based on Availability)
- 11.2.2 Tata Autocomp Systems Ltd
- 11.2.2.1. Overview
- 11.2.2.2. Products
- 11.2.2.3. SWOT Analysis
- 11.2.2.4. Recent Developments
- 11.2.2.5. Financials (Based on Availability)
- 11.2.3 China Aviation Battery Co Ltd (CALB)
- 11.2.3.1. Overview
- 11.2.3.2. Products
- 11.2.3.3. SWOT Analysis
- 11.2.3.4. Recent Developments
- 11.2.3.5. Financials (Based on Availability)
- 11.2.4 Samsung SDI Co Ltd
- 11.2.4.1. Overview
- 11.2.4.2. Products
- 11.2.4.3. SWOT Analysis
- 11.2.4.4. Recent Developments
- 11.2.4.5. Financials (Based on Availability)
- 11.2.5 LG Energy Solution Ltd
- 11.2.5.1. Overview
- 11.2.5.2. Products
- 11.2.5.3. SWOT Analysis
- 11.2.5.4. Recent Developments
- 11.2.5.5. Financials (Based on Availability)
- 11.2.6 Guoxuan High-tech Co Ltd
- 11.2.6.1. Overview
- 11.2.6.2. Products
- 11.2.6.3. SWOT Analysis
- 11.2.6.4. Recent Developments
- 11.2.6.5. Financials (Based on Availability)
- 11.2.7 Farasis Energy (Ganzhou) Co Ltd
- 11.2.7.1. Overview
- 11.2.7.2. Products
- 11.2.7.3. SWOT Analysis
- 11.2.7.4. Recent Developments
- 11.2.7.5. Financials (Based on Availability)
- 11.2.8 Gotion High-Tech Co Ltd
- 11.2.8.1. Overview
- 11.2.8.2. Products
- 11.2.8.3. SWOT Analysis
- 11.2.8.4. Recent Developments
- 11.2.8.5. Financials (Based on Availability)
- 11.2.9 TOSHIBA Corp
- 11.2.9.1. Overview
- 11.2.9.2. Products
- 11.2.9.3. SWOT Analysis
- 11.2.9.4. Recent Developments
- 11.2.9.5. Financials (Based on Availability)
- 11.2.10 Contemporary Amperex Technology Co Ltd (CATL)
- 11.2.10.1. Overview
- 11.2.10.2. Products
- 11.2.10.3. SWOT Analysis
- 11.2.10.4. Recent Developments
- 11.2.10.5. Financials (Based on Availability)
- 11.2.11 NFI Group Inc
- 11.2.11.1. Overview
- 11.2.11.2. Products
- 11.2.11.3. SWOT Analysis
- 11.2.11.4. Recent Developments
- 11.2.11.5. Financials (Based on Availability)
- 11.2.12 Leclanché SA
- 11.2.12.1. Overview
- 11.2.12.2. Products
- 11.2.12.3. SWOT Analysis
- 11.2.12.4. Recent Developments
- 11.2.12.5. Financials (Based on Availability)
- 11.2.13 BYD Company Ltd
- 11.2.13.1. Overview
- 11.2.13.2. Products
- 11.2.13.3. SWOT Analysis
- 11.2.13.4. Recent Developments
- 11.2.13.5. Financials (Based on Availability)
- 11.2.14 Sunwoda Electric Vehicle Battery Co Ltd (Sunwoda)
- 11.2.14.1. Overview
- 11.2.14.2. Products
- 11.2.14.3. SWOT Analysis
- 11.2.14.4. Recent Developments
- 11.2.14.5. Financials (Based on Availability)
- 11.2.15 Proterra Operating Company Inc
- 11.2.15.1. Overview
- 11.2.15.2. Products
- 11.2.15.3. SWOT Analysis
- 11.2.15.4. Recent Developments
- 11.2.15.5. Financials (Based on Availability)
- 11.2.16 Panasonic Holdings Corporation
- 11.2.16.1. Overview
- 11.2.16.2. Products
- 11.2.16.3. SWOT Analysis
- 11.2.16.4. Recent Developments
- 11.2.16.5. Financials (Based on Availability)
- 11.2.1 BMZ Batterien-Montage-Zentrum GmbH
List of Figures
- Figure 1: Global Electric Bus Battery Pack Market Revenue Breakdown (Million, %) by Region 2024 & 2032
- Figure 2: North America Electric Bus Battery Pack Market Revenue (Million), by Propulsion Type 2024 & 2032
- Figure 3: North America Electric Bus Battery Pack Market Revenue Share (%), by Propulsion Type 2024 & 2032
- Figure 4: North America Electric Bus Battery Pack Market Revenue (Million), by Battery Chemistry 2024 & 2032
- Figure 5: North America Electric Bus Battery Pack Market Revenue Share (%), by Battery Chemistry 2024 & 2032
- Figure 6: North America Electric Bus Battery Pack Market Revenue (Million), by Capacity 2024 & 2032
- Figure 7: North America Electric Bus Battery Pack Market Revenue Share (%), by Capacity 2024 & 2032
- Figure 8: North America Electric Bus Battery Pack Market Revenue (Million), by Battery Form 2024 & 2032
- Figure 9: North America Electric Bus Battery Pack Market Revenue Share (%), by Battery Form 2024 & 2032
- Figure 10: North America Electric Bus Battery Pack Market Revenue (Million), by Method 2024 & 2032
- Figure 11: North America Electric Bus Battery Pack Market Revenue Share (%), by Method 2024 & 2032
- Figure 12: North America Electric Bus Battery Pack Market Revenue (Million), by Component 2024 & 2032
- Figure 13: North America Electric Bus Battery Pack Market Revenue Share (%), by Component 2024 & 2032
- Figure 14: North America Electric Bus Battery Pack Market Revenue (Million), by Material Type 2024 & 2032
- Figure 15: North America Electric Bus Battery Pack Market Revenue Share (%), by Material Type 2024 & 2032
- Figure 16: North America Electric Bus Battery Pack Market Revenue (Million), by Country 2024 & 2032
- Figure 17: North America Electric Bus Battery Pack Market Revenue Share (%), by Country 2024 & 2032
- Figure 18: South America Electric Bus Battery Pack Market Revenue (Million), by Propulsion Type 2024 & 2032
- Figure 19: South America Electric Bus Battery Pack Market Revenue Share (%), by Propulsion Type 2024 & 2032
- Figure 20: South America Electric Bus Battery Pack Market Revenue (Million), by Battery Chemistry 2024 & 2032
- Figure 21: South America Electric Bus Battery Pack Market Revenue Share (%), by Battery Chemistry 2024 & 2032
- Figure 22: South America Electric Bus Battery Pack Market Revenue (Million), by Capacity 2024 & 2032
- Figure 23: South America Electric Bus Battery Pack Market Revenue Share (%), by Capacity 2024 & 2032
- Figure 24: South America Electric Bus Battery Pack Market Revenue (Million), by Battery Form 2024 & 2032
- Figure 25: South America Electric Bus Battery Pack Market Revenue Share (%), by Battery Form 2024 & 2032
- Figure 26: South America Electric Bus Battery Pack Market Revenue (Million), by Method 2024 & 2032
- Figure 27: South America Electric Bus Battery Pack Market Revenue Share (%), by Method 2024 & 2032
- Figure 28: South America Electric Bus Battery Pack Market Revenue (Million), by Component 2024 & 2032
- Figure 29: South America Electric Bus Battery Pack Market Revenue Share (%), by Component 2024 & 2032
- Figure 30: South America Electric Bus Battery Pack Market Revenue (Million), by Material Type 2024 & 2032
- Figure 31: South America Electric Bus Battery Pack Market Revenue Share (%), by Material Type 2024 & 2032
- Figure 32: South America Electric Bus Battery Pack Market Revenue (Million), by Country 2024 & 2032
- Figure 33: South America Electric Bus Battery Pack Market Revenue Share (%), by Country 2024 & 2032
- Figure 34: Europe Electric Bus Battery Pack Market Revenue (Million), by Propulsion Type 2024 & 2032
- Figure 35: Europe Electric Bus Battery Pack Market Revenue Share (%), by Propulsion Type 2024 & 2032
- Figure 36: Europe Electric Bus Battery Pack Market Revenue (Million), by Battery Chemistry 2024 & 2032
- Figure 37: Europe Electric Bus Battery Pack Market Revenue Share (%), by Battery Chemistry 2024 & 2032
- Figure 38: Europe Electric Bus Battery Pack Market Revenue (Million), by Capacity 2024 & 2032
- Figure 39: Europe Electric Bus Battery Pack Market Revenue Share (%), by Capacity 2024 & 2032
- Figure 40: Europe Electric Bus Battery Pack Market Revenue (Million), by Battery Form 2024 & 2032
- Figure 41: Europe Electric Bus Battery Pack Market Revenue Share (%), by Battery Form 2024 & 2032
- Figure 42: Europe Electric Bus Battery Pack Market Revenue (Million), by Method 2024 & 2032
- Figure 43: Europe Electric Bus Battery Pack Market Revenue Share (%), by Method 2024 & 2032
- Figure 44: Europe Electric Bus Battery Pack Market Revenue (Million), by Component 2024 & 2032
- Figure 45: Europe Electric Bus Battery Pack Market Revenue Share (%), by Component 2024 & 2032
- Figure 46: Europe Electric Bus Battery Pack Market Revenue (Million), by Material Type 2024 & 2032
- Figure 47: Europe Electric Bus Battery Pack Market Revenue Share (%), by Material Type 2024 & 2032
- Figure 48: Europe Electric Bus Battery Pack Market Revenue (Million), by Country 2024 & 2032
- Figure 49: Europe Electric Bus Battery Pack Market Revenue Share (%), by Country 2024 & 2032
- Figure 50: Middle East & Africa Electric Bus Battery Pack Market Revenue (Million), by Propulsion Type 2024 & 2032
- Figure 51: Middle East & Africa Electric Bus Battery Pack Market Revenue Share (%), by Propulsion Type 2024 & 2032
- Figure 52: Middle East & Africa Electric Bus Battery Pack Market Revenue (Million), by Battery Chemistry 2024 & 2032
- Figure 53: Middle East & Africa Electric Bus Battery Pack Market Revenue Share (%), by Battery Chemistry 2024 & 2032
- Figure 54: Middle East & Africa Electric Bus Battery Pack Market Revenue (Million), by Capacity 2024 & 2032
- Figure 55: Middle East & Africa Electric Bus Battery Pack Market Revenue Share (%), by Capacity 2024 & 2032
- Figure 56: Middle East & Africa Electric Bus Battery Pack Market Revenue (Million), by Battery Form 2024 & 2032
- Figure 57: Middle East & Africa Electric Bus Battery Pack Market Revenue Share (%), by Battery Form 2024 & 2032
- Figure 58: Middle East & Africa Electric Bus Battery Pack Market Revenue (Million), by Method 2024 & 2032
- Figure 59: Middle East & Africa Electric Bus Battery Pack Market Revenue Share (%), by Method 2024 & 2032
- Figure 60: Middle East & Africa Electric Bus Battery Pack Market Revenue (Million), by Component 2024 & 2032
- Figure 61: Middle East & Africa Electric Bus Battery Pack Market Revenue Share (%), by Component 2024 & 2032
- Figure 62: Middle East & Africa Electric Bus Battery Pack Market Revenue (Million), by Material Type 2024 & 2032
- Figure 63: Middle East & Africa Electric Bus Battery Pack Market Revenue Share (%), by Material Type 2024 & 2032
- Figure 64: Middle East & Africa Electric Bus Battery Pack Market Revenue (Million), by Country 2024 & 2032
- Figure 65: Middle East & Africa Electric Bus Battery Pack Market Revenue Share (%), by Country 2024 & 2032
- Figure 66: Asia Pacific Electric Bus Battery Pack Market Revenue (Million), by Propulsion Type 2024 & 2032
- Figure 67: Asia Pacific Electric Bus Battery Pack Market Revenue Share (%), by Propulsion Type 2024 & 2032
- Figure 68: Asia Pacific Electric Bus Battery Pack Market Revenue (Million), by Battery Chemistry 2024 & 2032
- Figure 69: Asia Pacific Electric Bus Battery Pack Market Revenue Share (%), by Battery Chemistry 2024 & 2032
- Figure 70: Asia Pacific Electric Bus Battery Pack Market Revenue (Million), by Capacity 2024 & 2032
- Figure 71: Asia Pacific Electric Bus Battery Pack Market Revenue Share (%), by Capacity 2024 & 2032
- Figure 72: Asia Pacific Electric Bus Battery Pack Market Revenue (Million), by Battery Form 2024 & 2032
- Figure 73: Asia Pacific Electric Bus Battery Pack Market Revenue Share (%), by Battery Form 2024 & 2032
- Figure 74: Asia Pacific Electric Bus Battery Pack Market Revenue (Million), by Method 2024 & 2032
- Figure 75: Asia Pacific Electric Bus Battery Pack Market Revenue Share (%), by Method 2024 & 2032
- Figure 76: Asia Pacific Electric Bus Battery Pack Market Revenue (Million), by Component 2024 & 2032
- Figure 77: Asia Pacific Electric Bus Battery Pack Market Revenue Share (%), by Component 2024 & 2032
- Figure 78: Asia Pacific Electric Bus Battery Pack Market Revenue (Million), by Material Type 2024 & 2032
- Figure 79: Asia Pacific Electric Bus Battery Pack Market Revenue Share (%), by Material Type 2024 & 2032
- Figure 80: Asia Pacific Electric Bus Battery Pack Market Revenue (Million), by Country 2024 & 2032
- Figure 81: Asia Pacific Electric Bus Battery Pack Market Revenue Share (%), by Country 2024 & 2032
List of Tables
- Table 1: Global Electric Bus Battery Pack Market Revenue Million Forecast, by Region 2019 & 2032
- Table 2: Global Electric Bus Battery Pack Market Revenue Million Forecast, by Propulsion Type 2019 & 2032
- Table 3: Global Electric Bus Battery Pack Market Revenue Million Forecast, by Battery Chemistry 2019 & 2032
- Table 4: Global Electric Bus Battery Pack Market Revenue Million Forecast, by Capacity 2019 & 2032
- Table 5: Global Electric Bus Battery Pack Market Revenue Million Forecast, by Battery Form 2019 & 2032
- Table 6: Global Electric Bus Battery Pack Market Revenue Million Forecast, by Method 2019 & 2032
- Table 7: Global Electric Bus Battery Pack Market Revenue Million Forecast, by Component 2019 & 2032
- Table 8: Global Electric Bus Battery Pack Market Revenue Million Forecast, by Material Type 2019 & 2032
- Table 9: Global Electric Bus Battery Pack Market Revenue Million Forecast, by Region 2019 & 2032
- Table 10: Global Electric Bus Battery Pack Market Revenue Million Forecast, by Propulsion Type 2019 & 2032
- Table 11: Global Electric Bus Battery Pack Market Revenue Million Forecast, by Battery Chemistry 2019 & 2032
- Table 12: Global Electric Bus Battery Pack Market Revenue Million Forecast, by Capacity 2019 & 2032
- Table 13: Global Electric Bus Battery Pack Market Revenue Million Forecast, by Battery Form 2019 & 2032
- Table 14: Global Electric Bus Battery Pack Market Revenue Million Forecast, by Method 2019 & 2032
- Table 15: Global Electric Bus Battery Pack Market Revenue Million Forecast, by Component 2019 & 2032
- Table 16: Global Electric Bus Battery Pack Market Revenue Million Forecast, by Material Type 2019 & 2032
- Table 17: Global Electric Bus Battery Pack Market Revenue Million Forecast, by Country 2019 & 2032
- Table 18: United States Electric Bus Battery Pack Market Revenue (Million) Forecast, by Application 2019 & 2032
- Table 19: Canada Electric Bus Battery Pack Market Revenue (Million) Forecast, by Application 2019 & 2032
- Table 20: Mexico Electric Bus Battery Pack Market Revenue (Million) Forecast, by Application 2019 & 2032
- Table 21: Global Electric Bus Battery Pack Market Revenue Million Forecast, by Propulsion Type 2019 & 2032
- Table 22: Global Electric Bus Battery Pack Market Revenue Million Forecast, by Battery Chemistry 2019 & 2032
- Table 23: Global Electric Bus Battery Pack Market Revenue Million Forecast, by Capacity 2019 & 2032
- Table 24: Global Electric Bus Battery Pack Market Revenue Million Forecast, by Battery Form 2019 & 2032
- Table 25: Global Electric Bus Battery Pack Market Revenue Million Forecast, by Method 2019 & 2032
- Table 26: Global Electric Bus Battery Pack Market Revenue Million Forecast, by Component 2019 & 2032
- Table 27: Global Electric Bus Battery Pack Market Revenue Million Forecast, by Material Type 2019 & 2032
- Table 28: Global Electric Bus Battery Pack Market Revenue Million Forecast, by Country 2019 & 2032
- Table 29: Brazil Electric Bus Battery Pack Market Revenue (Million) Forecast, by Application 2019 & 2032
- Table 30: Argentina Electric Bus Battery Pack Market Revenue (Million) Forecast, by Application 2019 & 2032
- Table 31: Rest of South America Electric Bus Battery Pack Market Revenue (Million) Forecast, by Application 2019 & 2032
- Table 32: Global Electric Bus Battery Pack Market Revenue Million Forecast, by Propulsion Type 2019 & 2032
- Table 33: Global Electric Bus Battery Pack Market Revenue Million Forecast, by Battery Chemistry 2019 & 2032
- Table 34: Global Electric Bus Battery Pack Market Revenue Million Forecast, by Capacity 2019 & 2032
- Table 35: Global Electric Bus Battery Pack Market Revenue Million Forecast, by Battery Form 2019 & 2032
- Table 36: Global Electric Bus Battery Pack Market Revenue Million Forecast, by Method 2019 & 2032
- Table 37: Global Electric Bus Battery Pack Market Revenue Million Forecast, by Component 2019 & 2032
- Table 38: Global Electric Bus Battery Pack Market Revenue Million Forecast, by Material Type 2019 & 2032
- Table 39: Global Electric Bus Battery Pack Market Revenue Million Forecast, by Country 2019 & 2032
- Table 40: United Kingdom Electric Bus Battery Pack Market Revenue (Million) Forecast, by Application 2019 & 2032
- Table 41: Germany Electric Bus Battery Pack Market Revenue (Million) Forecast, by Application 2019 & 2032
- Table 42: France Electric Bus Battery Pack Market Revenue (Million) Forecast, by Application 2019 & 2032
- Table 43: Italy Electric Bus Battery Pack Market Revenue (Million) Forecast, by Application 2019 & 2032
- Table 44: Spain Electric Bus Battery Pack Market Revenue (Million) Forecast, by Application 2019 & 2032
- Table 45: Russia Electric Bus Battery Pack Market Revenue (Million) Forecast, by Application 2019 & 2032
- Table 46: Benelux Electric Bus Battery Pack Market Revenue (Million) Forecast, by Application 2019 & 2032
- Table 47: Nordics Electric Bus Battery Pack Market Revenue (Million) Forecast, by Application 2019 & 2032
- Table 48: Rest of Europe Electric Bus Battery Pack Market Revenue (Million) Forecast, by Application 2019 & 2032
- Table 49: Global Electric Bus Battery Pack Market Revenue Million Forecast, by Propulsion Type 2019 & 2032
- Table 50: Global Electric Bus Battery Pack Market Revenue Million Forecast, by Battery Chemistry 2019 & 2032
- Table 51: Global Electric Bus Battery Pack Market Revenue Million Forecast, by Capacity 2019 & 2032
- Table 52: Global Electric Bus Battery Pack Market Revenue Million Forecast, by Battery Form 2019 & 2032
- Table 53: Global Electric Bus Battery Pack Market Revenue Million Forecast, by Method 2019 & 2032
- Table 54: Global Electric Bus Battery Pack Market Revenue Million Forecast, by Component 2019 & 2032
- Table 55: Global Electric Bus Battery Pack Market Revenue Million Forecast, by Material Type 2019 & 2032
- Table 56: Global Electric Bus Battery Pack Market Revenue Million Forecast, by Country 2019 & 2032
- Table 57: Turkey Electric Bus Battery Pack Market Revenue (Million) Forecast, by Application 2019 & 2032
- Table 58: Israel Electric Bus Battery Pack Market Revenue (Million) Forecast, by Application 2019 & 2032
- Table 59: GCC Electric Bus Battery Pack Market Revenue (Million) Forecast, by Application 2019 & 2032
- Table 60: North Africa Electric Bus Battery Pack Market Revenue (Million) Forecast, by Application 2019 & 2032
- Table 61: South Africa Electric Bus Battery Pack Market Revenue (Million) Forecast, by Application 2019 & 2032
- Table 62: Rest of Middle East & Africa Electric Bus Battery Pack Market Revenue (Million) Forecast, by Application 2019 & 2032
- Table 63: Global Electric Bus Battery Pack Market Revenue Million Forecast, by Propulsion Type 2019 & 2032
- Table 64: Global Electric Bus Battery Pack Market Revenue Million Forecast, by Battery Chemistry 2019 & 2032
- Table 65: Global Electric Bus Battery Pack Market Revenue Million Forecast, by Capacity 2019 & 2032
- Table 66: Global Electric Bus Battery Pack Market Revenue Million Forecast, by Battery Form 2019 & 2032
- Table 67: Global Electric Bus Battery Pack Market Revenue Million Forecast, by Method 2019 & 2032
- Table 68: Global Electric Bus Battery Pack Market Revenue Million Forecast, by Component 2019 & 2032
- Table 69: Global Electric Bus Battery Pack Market Revenue Million Forecast, by Material Type 2019 & 2032
- Table 70: Global Electric Bus Battery Pack Market Revenue Million Forecast, by Country 2019 & 2032
- Table 71: China Electric Bus Battery Pack Market Revenue (Million) Forecast, by Application 2019 & 2032
- Table 72: India Electric Bus Battery Pack Market Revenue (Million) Forecast, by Application 2019 & 2032
- Table 73: Japan Electric Bus Battery Pack Market Revenue (Million) Forecast, by Application 2019 & 2032
- Table 74: South Korea Electric Bus Battery Pack Market Revenue (Million) Forecast, by Application 2019 & 2032
- Table 75: ASEAN Electric Bus Battery Pack Market Revenue (Million) Forecast, by Application 2019 & 2032
- Table 76: Oceania Electric Bus Battery Pack Market Revenue (Million) Forecast, by Application 2019 & 2032
- Table 77: Rest of Asia Pacific Electric Bus Battery Pack Market Revenue (Million) Forecast, by Application 2019 & 2032
Frequently Asked Questions
1. What is the projected Compound Annual Growth Rate (CAGR) of the Electric Bus Battery Pack Market?
The projected CAGR is approximately 24.50%.
2. Which companies are prominent players in the Electric Bus Battery Pack Market?
Key companies in the market include BMZ Batterien-Montage-Zentrum GmbH, Tata Autocomp Systems Ltd, China Aviation Battery Co Ltd (CALB), Samsung SDI Co Ltd, LG Energy Solution Ltd, Guoxuan High-tech Co Ltd, Farasis Energy (Ganzhou) Co Ltd, Gotion High-Tech Co Ltd, TOSHIBA Corp, Contemporary Amperex Technology Co Ltd (CATL), NFI Group Inc, Leclanché SA, BYD Company Ltd, Sunwoda Electric Vehicle Battery Co Ltd (Sunwoda), Proterra Operating Company Inc, Panasonic Holdings Corporation.
3. What are the main segments of the Electric Bus Battery Pack Market?
The market segments include Propulsion Type, Battery Chemistry, Capacity, Battery Form, Method, Component, Material Type.
4. Can you provide details about the market size?
The market size is estimated to be USD XX Million as of 2022.
5. What are some drivers contributing to market growth?
Exponential Increase in Automotive Sector.
6. What are the notable trends driving market growth?
OTHER KEY INDUSTRY TRENDS COVERED IN THE REPORT.
7. Are there any restraints impacting market growth?
Digitization of R&D Operations in Automotive Sector.
8. Can you provide examples of recent developments in the market?
February 2023: Samsung SDI is expanding investment in its Hungary plant, which has the largest production capacity to respond to the fast-increasing demand for mid- to large-size batteries.January 2023: Korean battery maker Samsung SDI posted record-high profit in 2022, driven by solid demand for electric vehicle batteries and energy storage systems.November 2022: Samsung SDI has signed an agreement with Sungkyunkwan University to establish a course for battery technologies to raise battery experts.
9. What pricing options are available for accessing the report?
Pricing options include single-user, multi-user, and enterprise licenses priced at USD 3800, USD 4500, and USD 5800 respectively.
10. Is the market size provided in terms of value or volume?
The market size is provided in terms of value, measured in Million.
11. Are there any specific market keywords associated with the report?
Yes, the market keyword associated with the report is "Electric Bus Battery Pack Market," which aids in identifying and referencing the specific market segment covered.
12. How do I determine which pricing option suits my needs best?
The pricing options vary based on user requirements and access needs. Individual users may opt for single-user licenses, while businesses requiring broader access may choose multi-user or enterprise licenses for cost-effective access to the report.
13. Are there any additional resources or data provided in the Electric Bus Battery Pack Market report?
While the report offers comprehensive insights, it's advisable to review the specific contents or supplementary materials provided to ascertain if additional resources or data are available.
14. How can I stay updated on further developments or reports in the Electric Bus Battery Pack Market?
To stay informed about further developments, trends, and reports in the Electric Bus Battery Pack Market, consider subscribing to industry newsletters, following relevant companies and organizations, or regularly checking reputable industry news sources and publications.
Methodology
Step 1 - Identification of Relevant Samples Size from Population Database


Step 2 - Approaches for Defining Global Market Size (Value, Volume* & Price*)

Note*: In applicable scenarios
Step 3 - Data Sources
Primary Research
- Web Analytics
- Survey Reports
- Research Institute
- Latest Research Reports
- Opinion Leaders
Secondary Research
- Annual Reports
- White Paper
- Latest Press Release
- Industry Association
- Paid Database
- Investor Presentations

Step 4 - Data Triangulation
Involves using different sources of information in order to increase the validity of a study
These sources are likely to be stakeholders in a program - participants, other researchers, program staff, other community members, and so on.
Then we put all data in single framework & apply various statistical tools to find out the dynamic on the market.
During the analysis stage, feedback from the stakeholder groups would be compared to determine areas of agreement as well as areas of divergence


