
Key Insights
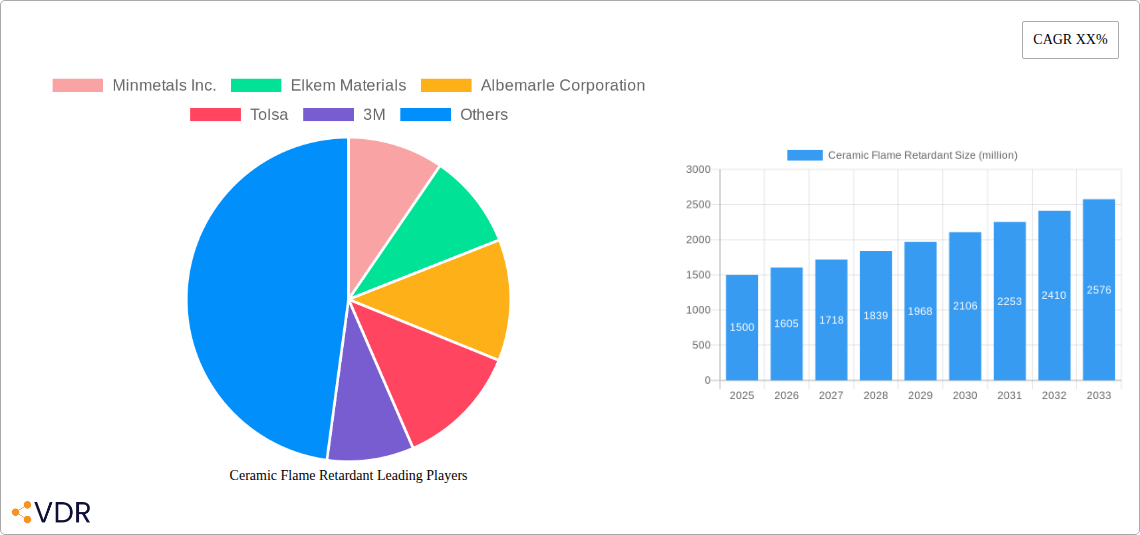
The global ceramic flame retardant market is experiencing robust growth, driven by increasing demand for fire-safe materials across diverse sectors. The market, estimated at $1.5 billion in 2025, is projected to exhibit a Compound Annual Growth Rate (CAGR) of 7% from 2025 to 2033, reaching approximately $2.5 billion by 2033. This expansion is fueled by stringent safety regulations globally, particularly within the construction, transportation, and electronics industries. The rising construction of high-rise buildings and the increasing use of flammable materials in electronics necessitate the adoption of effective flame retardants. Furthermore, the growing awareness of fire safety among consumers and businesses is driving demand for flame-retardant materials. Key market segments include construction, transportation, and electronics, with construction accounting for the largest share. Leading players like Minmetals Inc., Albemarle Corporation, and 3M are investing heavily in R&D to develop advanced ceramic flame retardants with enhanced performance and sustainability features.
However, the market faces certain restraints. The high cost of ceramic flame retardants compared to other alternatives, like halogenated flame retardants, can limit adoption, especially in price-sensitive markets. Concerns regarding the environmental impact of some ceramic flame retardants are also emerging, prompting the need for sustainable and eco-friendly alternatives. Nevertheless, ongoing innovations in material science are leading to the development of more efficient and environmentally benign ceramic flame retardants, mitigating these challenges. The competitive landscape is characterized by a mix of established players and emerging companies, fostering innovation and driving market expansion. Future growth will be significantly influenced by the adoption of stricter building codes, technological advancements, and the growing focus on sustainable flame-retardant solutions.
Ceramic Flame Retardant Market Report: 2019-2033
This comprehensive report provides an in-depth analysis of the global ceramic flame retardant market, encompassing market dynamics, growth trends, regional dominance, product landscape, key players, and future outlook. The study period covers 2019-2033, with 2025 as the base and estimated year. The forecast period spans 2025-2033, and the historical period encompasses 2019-2024. The report is crucial for industry professionals, investors, and researchers seeking a thorough understanding of this rapidly evolving market, valued at xx million units in 2025 and projected to reach xx million units by 2033.
Ceramic Flame Retardant Market Dynamics & Structure
The ceramic flame retardant market is characterized by moderate concentration, with key players holding significant market share. Technological innovation, driven by stringent safety regulations and the growing demand for fire-resistant materials across diverse industries, is a major growth driver. The market is subject to evolving regulatory frameworks globally, impacting product formulations and adoption rates. Competition from alternative flame retardants, such as halogenated and phosphate-based materials, presents a challenge. End-user demographics are diverse, spanning construction, electronics, transportation, and textiles. M&A activity has been relatively modest in recent years, with xx deals recorded between 2019-2024, indicating a potential for consolidation in the future.
- Market Concentration: Moderately concentrated, with the top 5 players holding approximately xx% of the market share in 2025.
- Technological Innovation: Focus on developing eco-friendly, high-performance ceramic flame retardants with improved thermal stability and processability. Innovation barriers include high R&D costs and stringent regulatory approvals.
- Regulatory Frameworks: Stringent fire safety regulations in various regions are driving demand, but also impose compliance challenges for manufacturers.
- Competitive Product Substitutes: Halogenated and phosphate-based flame retardants pose competition, particularly in cost-sensitive applications.
- End-User Demographics: Construction (xx%), Electronics (xx%), Transportation (xx%), Textiles (xx%), and Others (xx%).
- M&A Trends: xx M&A deals recorded between 2019-2024, indicating potential for future consolidation.
Ceramic Flame Retardant Growth Trends & Insights
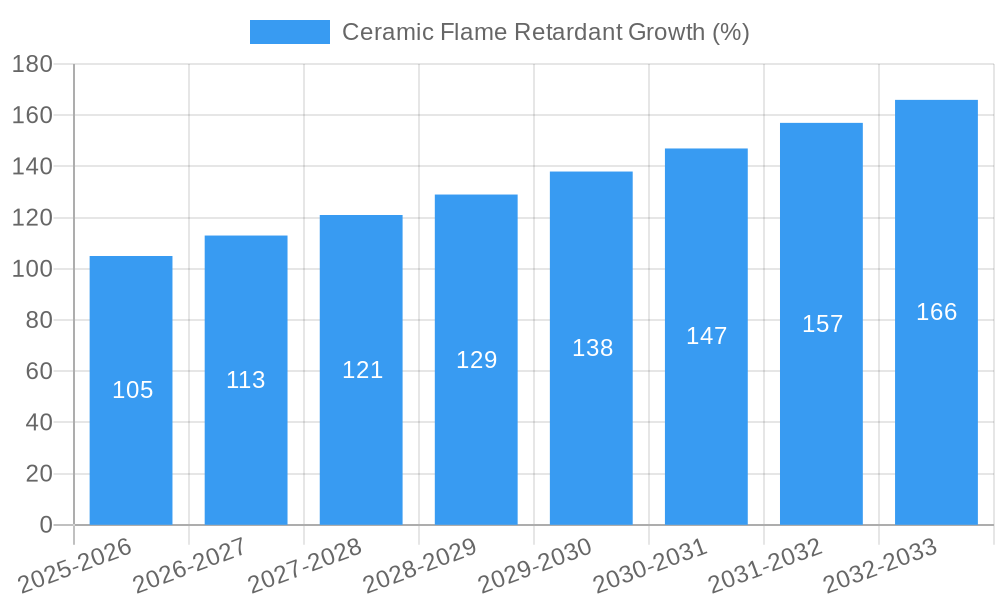
The global ceramic flame retardant market has witnessed significant growth over the historical period, driven by factors such as increasing urbanization, industrialization, and rising consumer awareness of fire safety. The market size expanded from xx million units in 2019 to xx million units in 2024, exhibiting a CAGR of xx%. This growth is anticipated to continue during the forecast period, reaching xx million units by 2033, with a projected CAGR of xx%. Technological advancements, such as the development of nanoceramic flame retardants, are further accelerating market adoption. Consumer preference for safer and more sustainable products is also contributing to market expansion. Market penetration is expected to increase significantly in developing economies due to rapid infrastructure development and rising disposable incomes.
Dominant Regions, Countries, or Segments in Ceramic Flame Retardant
The Asia-Pacific region is currently the dominant market for ceramic flame retardants, accounting for approximately xx% of the global market share in 2025. This dominance is attributed to the region's rapid industrialization, booming construction sector, and expanding electronics manufacturing base. China and India are the key drivers within this region. North America and Europe also hold significant market share, driven by strict building codes and stringent safety regulations.
- Key Drivers in Asia-Pacific:
- Rapid urbanization and infrastructure development.
- Growth in the electronics and automotive industries.
- Favorable government policies supporting fire safety.
- Dominance Factors: High construction activity, robust industrial output, and increasing government regulations on fire safety.
- Growth Potential: Significant untapped potential exists in developing economies within Asia-Pacific and other regions.
Ceramic Flame Retardant Product Landscape
Ceramic flame retardants encompass a range of products, including alumina trihydrate (ATH), magnesium hydroxide (MDH), and various other types of inorganic fillers. These materials offer diverse properties like high thermal stability, non-toxicity, and effective fire suppression. Recent innovations focus on enhancing the dispersibility and compatibility of ceramic flame retardants with various polymer matrices, leading to improved performance and reduced processing challenges. Unique selling propositions include enhanced fire safety, eco-friendly formulations, and cost-effectiveness.
Key Drivers, Barriers & Challenges in Ceramic Flame Retardant
Key Drivers:
- Stringent fire safety regulations across diverse industries.
- Growing demand for fire-resistant materials in construction, transportation, and electronics.
- Increasing awareness of fire safety among consumers.
- Technological advancements leading to improved performance and cost-effectiveness.
Key Challenges:
- Competition from alternative flame retardants.
- Supply chain disruptions affecting raw material availability and pricing.
- Regulatory hurdles and compliance complexities.
- Price volatility of raw materials.
Emerging Opportunities in Ceramic Flame Retardant
Emerging opportunities lie in the development of high-performance, eco-friendly ceramic flame retardants for specialized applications, such as aerospace, renewable energy, and advanced materials. Untapped markets in developing economies present significant growth potential. Innovation in nanotechnology and material science holds promise for the development of next-generation products with enhanced properties.
Growth Accelerators in the Ceramic Flame Retardant Industry
Technological breakthroughs in material science and nanotechnology are driving growth, enabling the development of novel ceramic flame retardants with superior performance. Strategic partnerships between raw material suppliers and end-use manufacturers are fostering innovation and supply chain optimization. Market expansion strategies, focusing on emerging economies and new application areas, are further accelerating market growth.
Key Players Shaping the Ceramic Flame Retardant Market
- Minmetals Inc.
- Elkem Materials
- Albemarle Corporation
- Tolsa
- 3M
- Anywhere Powder
- WFHMCHEM
- Spherefiller
- Into Chemicals
- Silike Technology
- Marshall Additives Technologies
- St. Louis Group
- Optimal Tech Co.,Ltd.
- TOR Specialty Minerals
- Polymer Additives Group
Notable Milestones in Ceramic Flame Retardant Sector
- 2020: Introduction of a novel nanoceramic flame retardant by Company X.
- 2021: Merger between Company Y and Company Z, expanding market reach.
- 2022: Implementation of new fire safety regulations in Country A, boosting market demand.
- 2023: Launch of a high-performance eco-friendly ceramic flame retardant by Company W.
- 2024: Significant investment in R&D by Company V for next-generation materials.
In-Depth Ceramic Flame Retardant Market Outlook
The future of the ceramic flame retardant market is bright, driven by sustained growth in key end-use industries and the ongoing development of advanced materials. Strategic partnerships, investments in R&D, and expansion into new markets will be crucial factors in shaping the market landscape in the coming years. The market is poised for significant expansion, with abundant opportunities for companies to capitalize on evolving consumer demands and technological advancements.
Ceramic Flame Retardant Segmentation
-
1. Application
- 1.1. Polymer Flame Retardant
- 1.2. Anti-dripping Agent
- 1.3. Smoke Suppressant
- 1.4. Others
-
2. Types
- 2.1. 2-3μm
- 2.2. 4-6μm
- 2.3. 6-8μm
- 2.4. Others
Ceramic Flame Retardant Segmentation By Geography
-
1. North America
- 1.1. United States
- 1.2. Canada
- 1.3. Mexico
-
2. South America
- 2.1. Brazil
- 2.2. Argentina
- 2.3. Rest of South America
-
3. Europe
- 3.1. United Kingdom
- 3.2. Germany
- 3.3. France
- 3.4. Italy
- 3.5. Spain
- 3.6. Russia
- 3.7. Benelux
- 3.8. Nordics
- 3.9. Rest of Europe
-
4. Middle East & Africa
- 4.1. Turkey
- 4.2. Israel
- 4.3. GCC
- 4.4. North Africa
- 4.5. South Africa
- 4.6. Rest of Middle East & Africa
-
5. Asia Pacific
- 5.1. China
- 5.2. India
- 5.3. Japan
- 5.4. South Korea
- 5.5. ASEAN
- 5.6. Oceania
- 5.7. Rest of Asia Pacific

Ceramic Flame Retardant REPORT HIGHLIGHTS
| Aspects | Details |
|---|---|
| Study Period | 2019-2033 |
| Base Year | 2024 |
| Estimated Year | 2025 |
| Forecast Period | 2025-2033 |
| Historical Period | 2019-2024 |
| Growth Rate | CAGR of XX% from 2019-2033 |
| Segmentation |
|
Table of Contents
- 1. Introduction
- 1.1. Research Scope
- 1.2. Market Segmentation
- 1.3. Research Methodology
- 1.4. Definitions and Assumptions
- 2. Executive Summary
- 2.1. Introduction
- 3. Market Dynamics
- 3.1. Introduction
- 3.2. Market Drivers
- 3.3. Market Restrains
- 3.4. Market Trends
- 4. Market Factor Analysis
- 4.1. Porters Five Forces
- 4.2. Supply/Value Chain
- 4.3. PESTEL analysis
- 4.4. Market Entropy
- 4.5. Patent/Trademark Analysis
- 5. Global Ceramic Flame Retardant Analysis, Insights and Forecast, 2019-2031
- 5.1. Market Analysis, Insights and Forecast - by Application
- 5.1.1. Polymer Flame Retardant
- 5.1.2. Anti-dripping Agent
- 5.1.3. Smoke Suppressant
- 5.1.4. Others
- 5.2. Market Analysis, Insights and Forecast - by Types
- 5.2.1. 2-3μm
- 5.2.2. 4-6μm
- 5.2.3. 6-8μm
- 5.2.4. Others
- 5.3. Market Analysis, Insights and Forecast - by Region
- 5.3.1. North America
- 5.3.2. South America
- 5.3.3. Europe
- 5.3.4. Middle East & Africa
- 5.3.5. Asia Pacific
- 5.1. Market Analysis, Insights and Forecast - by Application
- 6. North America Ceramic Flame Retardant Analysis, Insights and Forecast, 2019-2031
- 6.1. Market Analysis, Insights and Forecast - by Application
- 6.1.1. Polymer Flame Retardant
- 6.1.2. Anti-dripping Agent
- 6.1.3. Smoke Suppressant
- 6.1.4. Others
- 6.2. Market Analysis, Insights and Forecast - by Types
- 6.2.1. 2-3μm
- 6.2.2. 4-6μm
- 6.2.3. 6-8μm
- 6.2.4. Others
- 6.1. Market Analysis, Insights and Forecast - by Application
- 7. South America Ceramic Flame Retardant Analysis, Insights and Forecast, 2019-2031
- 7.1. Market Analysis, Insights and Forecast - by Application
- 7.1.1. Polymer Flame Retardant
- 7.1.2. Anti-dripping Agent
- 7.1.3. Smoke Suppressant
- 7.1.4. Others
- 7.2. Market Analysis, Insights and Forecast - by Types
- 7.2.1. 2-3μm
- 7.2.2. 4-6μm
- 7.2.3. 6-8μm
- 7.2.4. Others
- 7.1. Market Analysis, Insights and Forecast - by Application
- 8. Europe Ceramic Flame Retardant Analysis, Insights and Forecast, 2019-2031
- 8.1. Market Analysis, Insights and Forecast - by Application
- 8.1.1. Polymer Flame Retardant
- 8.1.2. Anti-dripping Agent
- 8.1.3. Smoke Suppressant
- 8.1.4. Others
- 8.2. Market Analysis, Insights and Forecast - by Types
- 8.2.1. 2-3μm
- 8.2.2. 4-6μm
- 8.2.3. 6-8μm
- 8.2.4. Others
- 8.1. Market Analysis, Insights and Forecast - by Application
- 9. Middle East & Africa Ceramic Flame Retardant Analysis, Insights and Forecast, 2019-2031
- 9.1. Market Analysis, Insights and Forecast - by Application
- 9.1.1. Polymer Flame Retardant
- 9.1.2. Anti-dripping Agent
- 9.1.3. Smoke Suppressant
- 9.1.4. Others
- 9.2. Market Analysis, Insights and Forecast - by Types
- 9.2.1. 2-3μm
- 9.2.2. 4-6μm
- 9.2.3. 6-8μm
- 9.2.4. Others
- 9.1. Market Analysis, Insights and Forecast - by Application
- 10. Asia Pacific Ceramic Flame Retardant Analysis, Insights and Forecast, 2019-2031
- 10.1. Market Analysis, Insights and Forecast - by Application
- 10.1.1. Polymer Flame Retardant
- 10.1.2. Anti-dripping Agent
- 10.1.3. Smoke Suppressant
- 10.1.4. Others
- 10.2. Market Analysis, Insights and Forecast - by Types
- 10.2.1. 2-3μm
- 10.2.2. 4-6μm
- 10.2.3. 6-8μm
- 10.2.4. Others
- 10.1. Market Analysis, Insights and Forecast - by Application
- 11. Competitive Analysis
- 11.1. Global Market Share Analysis 2024
- 11.2. Company Profiles
- 11.2.1 Minmetals Inc.
- 11.2.1.1. Overview
- 11.2.1.2. Products
- 11.2.1.3. SWOT Analysis
- 11.2.1.4. Recent Developments
- 11.2.1.5. Financials (Based on Availability)
- 11.2.2 Elkem Materials
- 11.2.2.1. Overview
- 11.2.2.2. Products
- 11.2.2.3. SWOT Analysis
- 11.2.2.4. Recent Developments
- 11.2.2.5. Financials (Based on Availability)
- 11.2.3 Albemarle Corporation
- 11.2.3.1. Overview
- 11.2.3.2. Products
- 11.2.3.3. SWOT Analysis
- 11.2.3.4. Recent Developments
- 11.2.3.5. Financials (Based on Availability)
- 11.2.4 Tolsa
- 11.2.4.1. Overview
- 11.2.4.2. Products
- 11.2.4.3. SWOT Analysis
- 11.2.4.4. Recent Developments
- 11.2.4.5. Financials (Based on Availability)
- 11.2.5 3M
- 11.2.5.1. Overview
- 11.2.5.2. Products
- 11.2.5.3. SWOT Analysis
- 11.2.5.4. Recent Developments
- 11.2.5.5. Financials (Based on Availability)
- 11.2.6 Anywhere Powder
- 11.2.6.1. Overview
- 11.2.6.2. Products
- 11.2.6.3. SWOT Analysis
- 11.2.6.4. Recent Developments
- 11.2.6.5. Financials (Based on Availability)
- 11.2.7 WFHMCHEM
- 11.2.7.1. Overview
- 11.2.7.2. Products
- 11.2.7.3. SWOT Analysis
- 11.2.7.4. Recent Developments
- 11.2.7.5. Financials (Based on Availability)
- 11.2.8 Spherefiller
- 11.2.8.1. Overview
- 11.2.8.2. Products
- 11.2.8.3. SWOT Analysis
- 11.2.8.4. Recent Developments
- 11.2.8.5. Financials (Based on Availability)
- 11.2.9 Into Chemicals
- 11.2.9.1. Overview
- 11.2.9.2. Products
- 11.2.9.3. SWOT Analysis
- 11.2.9.4. Recent Developments
- 11.2.9.5. Financials (Based on Availability)
- 11.2.10 Silike Technology
- 11.2.10.1. Overview
- 11.2.10.2. Products
- 11.2.10.3. SWOT Analysis
- 11.2.10.4. Recent Developments
- 11.2.10.5. Financials (Based on Availability)
- 11.2.11 Marshall Additives Technologies
- 11.2.11.1. Overview
- 11.2.11.2. Products
- 11.2.11.3. SWOT Analysis
- 11.2.11.4. Recent Developments
- 11.2.11.5. Financials (Based on Availability)
- 11.2.12 St. Louis Group
- 11.2.12.1. Overview
- 11.2.12.2. Products
- 11.2.12.3. SWOT Analysis
- 11.2.12.4. Recent Developments
- 11.2.12.5. Financials (Based on Availability)
- 11.2.13 Optimal Tech Co.
- 11.2.13.1. Overview
- 11.2.13.2. Products
- 11.2.13.3. SWOT Analysis
- 11.2.13.4. Recent Developments
- 11.2.13.5. Financials (Based on Availability)
- 11.2.14 Ltd.
- 11.2.14.1. Overview
- 11.2.14.2. Products
- 11.2.14.3. SWOT Analysis
- 11.2.14.4. Recent Developments
- 11.2.14.5. Financials (Based on Availability)
- 11.2.15 TOR Specialty Minerals
- 11.2.15.1. Overview
- 11.2.15.2. Products
- 11.2.15.3. SWOT Analysis
- 11.2.15.4. Recent Developments
- 11.2.15.5. Financials (Based on Availability)
- 11.2.16 Polymer Additives Group
- 11.2.16.1. Overview
- 11.2.16.2. Products
- 11.2.16.3. SWOT Analysis
- 11.2.16.4. Recent Developments
- 11.2.16.5. Financials (Based on Availability)
- 11.2.1 Minmetals Inc.
List of Figures
- Figure 1: Global Ceramic Flame Retardant Revenue Breakdown (million, %) by Region 2024 & 2032
- Figure 2: North America Ceramic Flame Retardant Revenue (million), by Application 2024 & 2032
- Figure 3: North America Ceramic Flame Retardant Revenue Share (%), by Application 2024 & 2032
- Figure 4: North America Ceramic Flame Retardant Revenue (million), by Types 2024 & 2032
- Figure 5: North America Ceramic Flame Retardant Revenue Share (%), by Types 2024 & 2032
- Figure 6: North America Ceramic Flame Retardant Revenue (million), by Country 2024 & 2032
- Figure 7: North America Ceramic Flame Retardant Revenue Share (%), by Country 2024 & 2032
- Figure 8: South America Ceramic Flame Retardant Revenue (million), by Application 2024 & 2032
- Figure 9: South America Ceramic Flame Retardant Revenue Share (%), by Application 2024 & 2032
- Figure 10: South America Ceramic Flame Retardant Revenue (million), by Types 2024 & 2032
- Figure 11: South America Ceramic Flame Retardant Revenue Share (%), by Types 2024 & 2032
- Figure 12: South America Ceramic Flame Retardant Revenue (million), by Country 2024 & 2032
- Figure 13: South America Ceramic Flame Retardant Revenue Share (%), by Country 2024 & 2032
- Figure 14: Europe Ceramic Flame Retardant Revenue (million), by Application 2024 & 2032
- Figure 15: Europe Ceramic Flame Retardant Revenue Share (%), by Application 2024 & 2032
- Figure 16: Europe Ceramic Flame Retardant Revenue (million), by Types 2024 & 2032
- Figure 17: Europe Ceramic Flame Retardant Revenue Share (%), by Types 2024 & 2032
- Figure 18: Europe Ceramic Flame Retardant Revenue (million), by Country 2024 & 2032
- Figure 19: Europe Ceramic Flame Retardant Revenue Share (%), by Country 2024 & 2032
- Figure 20: Middle East & Africa Ceramic Flame Retardant Revenue (million), by Application 2024 & 2032
- Figure 21: Middle East & Africa Ceramic Flame Retardant Revenue Share (%), by Application 2024 & 2032
- Figure 22: Middle East & Africa Ceramic Flame Retardant Revenue (million), by Types 2024 & 2032
- Figure 23: Middle East & Africa Ceramic Flame Retardant Revenue Share (%), by Types 2024 & 2032
- Figure 24: Middle East & Africa Ceramic Flame Retardant Revenue (million), by Country 2024 & 2032
- Figure 25: Middle East & Africa Ceramic Flame Retardant Revenue Share (%), by Country 2024 & 2032
- Figure 26: Asia Pacific Ceramic Flame Retardant Revenue (million), by Application 2024 & 2032
- Figure 27: Asia Pacific Ceramic Flame Retardant Revenue Share (%), by Application 2024 & 2032
- Figure 28: Asia Pacific Ceramic Flame Retardant Revenue (million), by Types 2024 & 2032
- Figure 29: Asia Pacific Ceramic Flame Retardant Revenue Share (%), by Types 2024 & 2032
- Figure 30: Asia Pacific Ceramic Flame Retardant Revenue (million), by Country 2024 & 2032
- Figure 31: Asia Pacific Ceramic Flame Retardant Revenue Share (%), by Country 2024 & 2032
List of Tables
- Table 1: Global Ceramic Flame Retardant Revenue million Forecast, by Region 2019 & 2032
- Table 2: Global Ceramic Flame Retardant Revenue million Forecast, by Application 2019 & 2032
- Table 3: Global Ceramic Flame Retardant Revenue million Forecast, by Types 2019 & 2032
- Table 4: Global Ceramic Flame Retardant Revenue million Forecast, by Region 2019 & 2032
- Table 5: Global Ceramic Flame Retardant Revenue million Forecast, by Application 2019 & 2032
- Table 6: Global Ceramic Flame Retardant Revenue million Forecast, by Types 2019 & 2032
- Table 7: Global Ceramic Flame Retardant Revenue million Forecast, by Country 2019 & 2032
- Table 8: United States Ceramic Flame Retardant Revenue (million) Forecast, by Application 2019 & 2032
- Table 9: Canada Ceramic Flame Retardant Revenue (million) Forecast, by Application 2019 & 2032
- Table 10: Mexico Ceramic Flame Retardant Revenue (million) Forecast, by Application 2019 & 2032
- Table 11: Global Ceramic Flame Retardant Revenue million Forecast, by Application 2019 & 2032
- Table 12: Global Ceramic Flame Retardant Revenue million Forecast, by Types 2019 & 2032
- Table 13: Global Ceramic Flame Retardant Revenue million Forecast, by Country 2019 & 2032
- Table 14: Brazil Ceramic Flame Retardant Revenue (million) Forecast, by Application 2019 & 2032
- Table 15: Argentina Ceramic Flame Retardant Revenue (million) Forecast, by Application 2019 & 2032
- Table 16: Rest of South America Ceramic Flame Retardant Revenue (million) Forecast, by Application 2019 & 2032
- Table 17: Global Ceramic Flame Retardant Revenue million Forecast, by Application 2019 & 2032
- Table 18: Global Ceramic Flame Retardant Revenue million Forecast, by Types 2019 & 2032
- Table 19: Global Ceramic Flame Retardant Revenue million Forecast, by Country 2019 & 2032
- Table 20: United Kingdom Ceramic Flame Retardant Revenue (million) Forecast, by Application 2019 & 2032
- Table 21: Germany Ceramic Flame Retardant Revenue (million) Forecast, by Application 2019 & 2032
- Table 22: France Ceramic Flame Retardant Revenue (million) Forecast, by Application 2019 & 2032
- Table 23: Italy Ceramic Flame Retardant Revenue (million) Forecast, by Application 2019 & 2032
- Table 24: Spain Ceramic Flame Retardant Revenue (million) Forecast, by Application 2019 & 2032
- Table 25: Russia Ceramic Flame Retardant Revenue (million) Forecast, by Application 2019 & 2032
- Table 26: Benelux Ceramic Flame Retardant Revenue (million) Forecast, by Application 2019 & 2032
- Table 27: Nordics Ceramic Flame Retardant Revenue (million) Forecast, by Application 2019 & 2032
- Table 28: Rest of Europe Ceramic Flame Retardant Revenue (million) Forecast, by Application 2019 & 2032
- Table 29: Global Ceramic Flame Retardant Revenue million Forecast, by Application 2019 & 2032
- Table 30: Global Ceramic Flame Retardant Revenue million Forecast, by Types 2019 & 2032
- Table 31: Global Ceramic Flame Retardant Revenue million Forecast, by Country 2019 & 2032
- Table 32: Turkey Ceramic Flame Retardant Revenue (million) Forecast, by Application 2019 & 2032
- Table 33: Israel Ceramic Flame Retardant Revenue (million) Forecast, by Application 2019 & 2032
- Table 34: GCC Ceramic Flame Retardant Revenue (million) Forecast, by Application 2019 & 2032
- Table 35: North Africa Ceramic Flame Retardant Revenue (million) Forecast, by Application 2019 & 2032
- Table 36: South Africa Ceramic Flame Retardant Revenue (million) Forecast, by Application 2019 & 2032
- Table 37: Rest of Middle East & Africa Ceramic Flame Retardant Revenue (million) Forecast, by Application 2019 & 2032
- Table 38: Global Ceramic Flame Retardant Revenue million Forecast, by Application 2019 & 2032
- Table 39: Global Ceramic Flame Retardant Revenue million Forecast, by Types 2019 & 2032
- Table 40: Global Ceramic Flame Retardant Revenue million Forecast, by Country 2019 & 2032
- Table 41: China Ceramic Flame Retardant Revenue (million) Forecast, by Application 2019 & 2032
- Table 42: India Ceramic Flame Retardant Revenue (million) Forecast, by Application 2019 & 2032
- Table 43: Japan Ceramic Flame Retardant Revenue (million) Forecast, by Application 2019 & 2032
- Table 44: South Korea Ceramic Flame Retardant Revenue (million) Forecast, by Application 2019 & 2032
- Table 45: ASEAN Ceramic Flame Retardant Revenue (million) Forecast, by Application 2019 & 2032
- Table 46: Oceania Ceramic Flame Retardant Revenue (million) Forecast, by Application 2019 & 2032
- Table 47: Rest of Asia Pacific Ceramic Flame Retardant Revenue (million) Forecast, by Application 2019 & 2032
Frequently Asked Questions
1. What is the projected Compound Annual Growth Rate (CAGR) of the Ceramic Flame Retardant?
The projected CAGR is approximately XX%.
2. Which companies are prominent players in the Ceramic Flame Retardant?
Key companies in the market include Minmetals Inc., Elkem Materials, Albemarle Corporation, Tolsa, 3M, Anywhere Powder, WFHMCHEM, Spherefiller, Into Chemicals, Silike Technology, Marshall Additives Technologies, St. Louis Group, Optimal Tech Co., Ltd., TOR Specialty Minerals, Polymer Additives Group.
3. What are the main segments of the Ceramic Flame Retardant?
The market segments include Application, Types.
4. Can you provide details about the market size?
The market size is estimated to be USD XXX million as of 2022.
5. What are some drivers contributing to market growth?
N/A
6. What are the notable trends driving market growth?
N/A
7. Are there any restraints impacting market growth?
N/A
8. Can you provide examples of recent developments in the market?
N/A
9. What pricing options are available for accessing the report?
Pricing options include single-user, multi-user, and enterprise licenses priced at USD 4900.00, USD 7350.00, and USD 9800.00 respectively.
10. Is the market size provided in terms of value or volume?
The market size is provided in terms of value, measured in million.
11. Are there any specific market keywords associated with the report?
Yes, the market keyword associated with the report is "Ceramic Flame Retardant," which aids in identifying and referencing the specific market segment covered.
12. How do I determine which pricing option suits my needs best?
The pricing options vary based on user requirements and access needs. Individual users may opt for single-user licenses, while businesses requiring broader access may choose multi-user or enterprise licenses for cost-effective access to the report.
13. Are there any additional resources or data provided in the Ceramic Flame Retardant report?
While the report offers comprehensive insights, it's advisable to review the specific contents or supplementary materials provided to ascertain if additional resources or data are available.
14. How can I stay updated on further developments or reports in the Ceramic Flame Retardant?
To stay informed about further developments, trends, and reports in the Ceramic Flame Retardant, consider subscribing to industry newsletters, following relevant companies and organizations, or regularly checking reputable industry news sources and publications.
Methodology
Step 1 - Identification of Relevant Samples Size from Population Database


Step 2 - Approaches for Defining Global Market Size (Value, Volume* & Price*)

Note*: In applicable scenarios
Step 3 - Data Sources
Primary Research
- Web Analytics
- Survey Reports
- Research Institute
- Latest Research Reports
- Opinion Leaders
Secondary Research
- Annual Reports
- White Paper
- Latest Press Release
- Industry Association
- Paid Database
- Investor Presentations

Step 4 - Data Triangulation
Involves using different sources of information in order to increase the validity of a study
These sources are likely to be stakeholders in a program - participants, other researchers, program staff, other community members, and so on.
Then we put all data in single framework & apply various statistical tools to find out the dynamic on the market.
During the analysis stage, feedback from the stakeholder groups would be compared to determine areas of agreement as well as areas of divergence


