
Key Insights
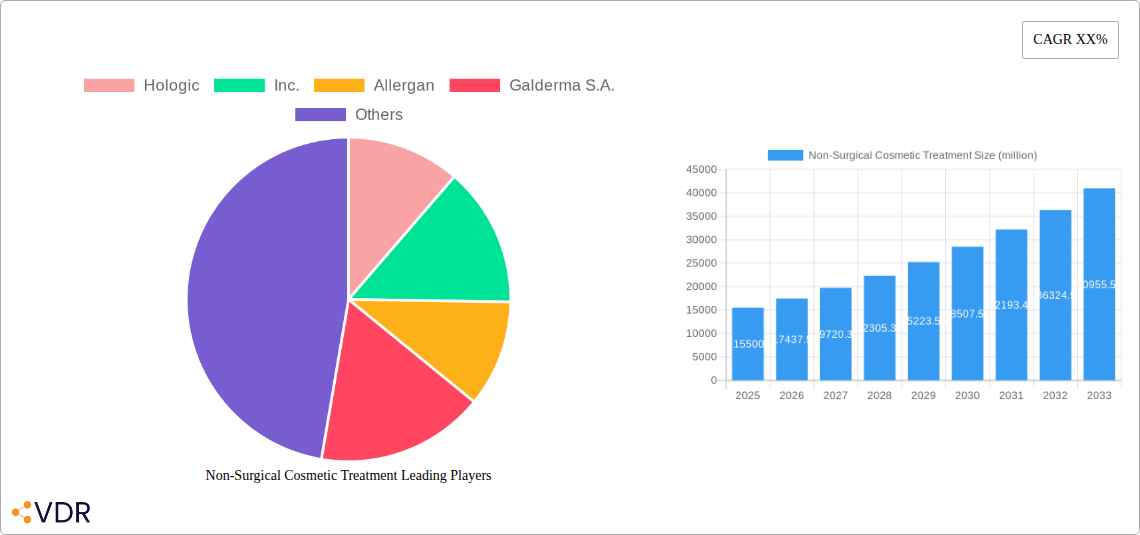
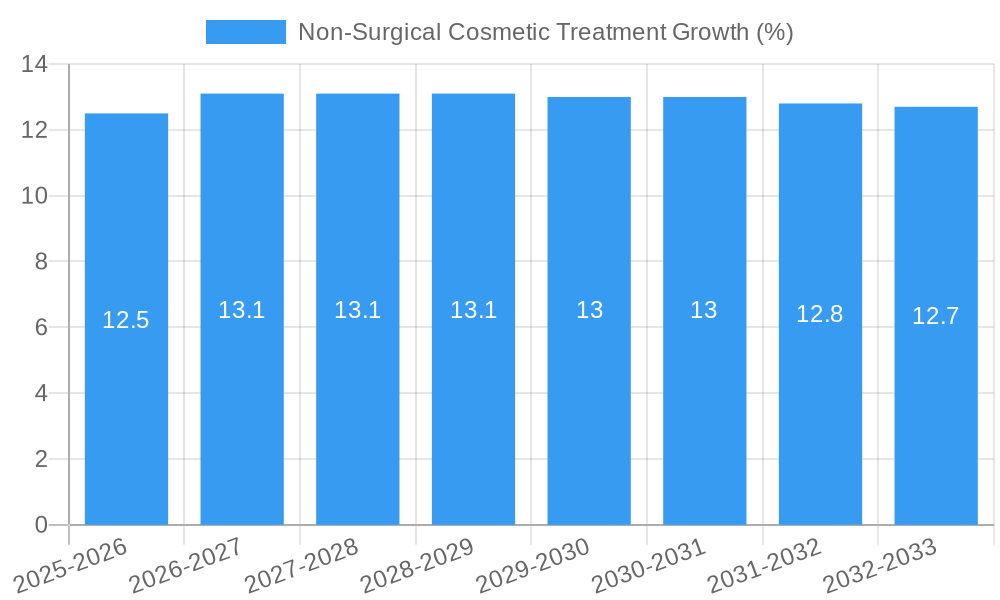
The global Non-Surgical Cosmetic Treatment market is projected to reach an estimated USD 15,500 million by 2025, exhibiting robust growth with a Compound Annual Growth Rate (CAGR) of 12.5% throughout the forecast period of 2025-2033. This dynamic market is propelled by a confluence of factors, including the escalating demand for minimally invasive procedures offering quicker recovery times and fewer risks compared to traditional surgery. A growing emphasis on aesthetic appearance, coupled with increased disposable income and greater accessibility to advanced treatments, are key drivers fueling this expansion. The market is witnessing a significant rise in both men and women seeking to enhance their physical attributes, contributing to a diversified customer base. Innovations in technology, such as advanced laser systems and novel filler materials, are continuously improving treatment efficacy and patient satisfaction, further stimulating market penetration.
The market's growth is further influenced by evolving beauty standards and the pervasive presence of social media, which normalizes and promotes cosmetic enhancements. Key segments contributing to this surge include CoolSculpting and Botox and Dermal Fillers, which remain highly popular due to their proven results and non-invasive nature. Laser Skin Resurfacing and Photofacials, alongside Radiofrequency and Ultrasound treatments, are gaining traction for their efficacy in addressing a range of dermatological concerns, from acne scars to skin aging. Restraints such as high treatment costs for some advanced procedures and potential side effects, though generally minimal, are being mitigated by continuous technological advancements and improved safety protocols. The competitive landscape is characterized by the presence of prominent global players like Hologic, Inc., Allergan, Inc., and Johnson & Johnson, actively engaged in research and development to introduce innovative solutions and expand their market reach across key regions like North America and Europe.
Comprehensive Report: Non-Surgical Cosmetic Treatment Market Dynamics, Growth, and Future Outlook (2019-2033)
This in-depth market research report provides a definitive analysis of the global Non-Surgical Cosmetic Treatment market, offering critical insights for industry stakeholders. Covering a detailed historical, current, and projected landscape from 2019 to 2033, with a base and estimated year of 2025, this report is meticulously structured to deliver actionable intelligence. We explore market dynamics, growth trends, regional dominance, product innovations, key drivers, challenges, emerging opportunities, growth accelerators, and the competitive landscape. With a focus on high-traffic keywords and integration of parent and child market segments, this report is optimized for maximum search engine visibility and industry engagement.
Non-Surgical Cosmetic Treatment Market Dynamics & Structure
The non-surgical cosmetic treatment market is characterized by a moderate concentration, with key players like Allergan, Inc., Galderma S.A., and Johnson & Johnson holding significant market shares, estimated at 18%, 15%, and 12% respectively in 2025. Technological innovation is a primary driver, fueled by advancements in Botox and Dermal Fillers, laser skin resurfacing, and radiofrequency and ultrasound technologies. Regulatory frameworks, such as those overseen by the FDA and EMA, play a crucial role in ensuring product safety and efficacy, influencing market entry and product development.
- Market Concentration: Moderate, with a few dominant players and a growing number of specialized niche providers.
- Technological Innovation Drivers: Focus on minimally invasive procedures, longer-lasting results, and personalized treatment plans.
- Regulatory Frameworks: Strict adherence to safety and efficacy standards, impacting R&D and product launches.
- Competitive Product Substitutes: Competition exists between different treatment modalities (e.g., injectables vs. energy-based devices) and also from surgical alternatives.
- End-User Demographics: Increasing demand from both Women (estimated 85% of the market) and Men (estimated 15% of the market), with a growing segment of younger consumers seeking preventative treatments.
- M&A Trends: Strategic acquisitions and partnerships are prevalent as companies seek to expand their product portfolios and market reach. The volume of M&A deals in the historical period (2019-2024) was approximately 25, valued at over $500 million in total transaction value. Innovation barriers include the high cost of clinical trials and the need for continuous technological upgrades.
Non-Surgical Cosmetic Treatment Growth Trends & Insights
The global non-surgical cosmetic treatment market is experiencing robust growth, driven by increasing consumer awareness, rising disposable incomes, and a growing preference for minimally invasive procedures over traditional surgery. The market size is projected to grow from an estimated $15,500 million in 2025 to $28,200 million by 2033, exhibiting a compound annual growth rate (CAGR) of approximately 7.8% during the forecast period (2025–2033). Adoption rates for Botox and Dermal Fillers continue to surge, with an estimated 12 million procedures performed globally in 2025.
Technological disruptions are at the forefront of market evolution. Advancements in laser skin resurfacing and photofacials are offering more precise and effective treatments for various skin concerns, with an estimated market penetration of 25% by 2025 in developed regions. Radiofrequency and Ultrasound technologies are also gaining traction due to their ability to stimulate collagen production and tighten skin non-invasively, contributing an estimated $2,500 million to the market in 2025.
Consumer behavior shifts are significantly influencing market dynamics. There is a noticeable trend towards "tweakments" – subtle enhancements rather than drastic changes – and a growing demand for preventative aesthetic treatments, particularly among millennials and Gen Z. This demographic, accounting for an estimated 30% of new patient inquiries in 2025, is driving innovation in less invasive and more natural-looking results. The demand for treatments targeting male aesthetic concerns is also rising, indicating a market expansion into the Men segment, which is predicted to grow at a CAGR of 9.5% from 2025 to 2033. The overall non-surgical cosmetic procedures market continues to benefit from increased social media influence and a greater acceptance of aesthetic enhancements in mainstream culture. The estimated market penetration of non-surgical treatments within the broader cosmetic procedures market is expected to reach 60% by 2033.
Dominant Regions, Countries, or Segments in Non-Surgical Cosmetic Treatment
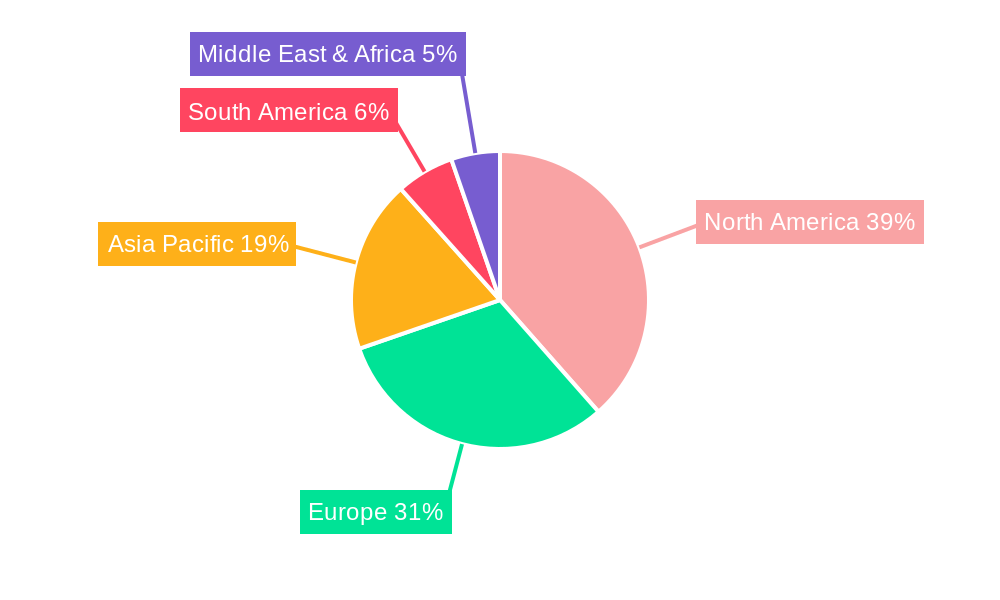
The North America region is the dominant force in the global non-surgical cosmetic treatment market, projected to hold a significant market share of approximately 35% in 2025, translating to an estimated market value of $5,425 million. This dominance is driven by a confluence of factors, including high disposable incomes, a strong culture of aesthetic consciousness, widespread availability of advanced technologies, and a well-established regulatory framework that fosters innovation and consumer trust. The United States, in particular, is a powerhouse, contributing over 80% to the regional market, with an estimated $4,340 million in non-surgical cosmetic treatment expenditure in 2025.
Within this dominant region and globally, the Women segment, representing an estimated 85% of the total market, remains the primary consumer of non-surgical cosmetic treatments. However, the Men segment is experiencing a faster growth trajectory, projected to grow at a CAGR of 9.5% from 2025 to 2033, indicating a significant expansion opportunity.
Analyzing the treatment types, Botox and Dermal Fillers continue to lead the market, accounting for an estimated 45% of the total market value in 2025, with an estimated market size of $6,975 million. This segment's popularity stems from their efficacy in treating wrinkles, fine lines, and volume loss, coupled with minimal downtime and relatively quick results. The increasing adoption of these injectables by younger demographics for preventative anti-aging measures further bolsters their market dominance.
- North America: Leading region due to high disposable income, aesthetic consciousness, and advanced technology.
- United States: Primary contributor to regional growth, with high per capita spending on cosmetic procedures.
- Women Segment: Continues to be the largest consumer base, driving demand for a wide range of treatments.
- Botox and Dermal Fillers: The most popular treatment type due to efficacy, minimal downtime, and versatility.
- Preventative anti-aging: Growing demand from younger demographics is a key driver.
- Asia-Pacific: Emerging as a rapidly growing market, driven by increasing disposable incomes and a rising middle class, particularly in countries like China and South Korea. Its projected market share is expected to reach 25% by 2033.
- Europe: Holds a substantial market share, driven by a mature aesthetic market and increasing adoption of advanced technologies.
Non-Surgical Cosmetic Treatment Product Landscape
The non-surgical cosmetic treatment landscape is marked by continuous product innovation aimed at enhancing efficacy, safety, and patient comfort. Leading companies like Allergan, Inc. and Galderma S.A. are at the forefront of developing next-generation Botox and Dermal Fillers with improved longevity and more natural-looking results. Hologic, Inc. is a significant player in energy-based devices, with its CoolSculpting technology revolutionizing non-invasive fat reduction. Alma Lasers and Syneron Candela are driving advancements in Laser Skin Resurfacing and Photofacials, offering sophisticated solutions for skin rejuvenation and treatment of various dermatological conditions. The performance metrics for these treatments are increasingly focused on patient satisfaction, minimal side effects, and faster recovery times. Unique selling propositions include personalized treatment plans, combination therapies, and the integration of AI for precise treatment delivery.
Key Drivers, Barriers & Challenges in Non-Surgical Cosmetic Treatment
Key Drivers:
- Growing Consumer Demand for Aesthetics: An increasing global emphasis on appearance and self-confidence fuels the demand for non-surgical cosmetic treatments.
- Technological Advancements: Innovations in Botox and Dermal Fillers, laser technology, and energy-based devices offer safer, more effective, and less invasive alternatives to surgery.
- Minimally Invasive Nature: Shorter recovery times and reduced risks compared to surgical procedures attract a wider demographic.
- Increasing Disposable Income: A rising global middle class has more discretionary income to spend on aesthetic enhancements.
- Social Media Influence: The visibility of aesthetic transformations on social media platforms normalizes and popularizes these treatments.
Barriers & Challenges:
- High Cost of Treatments: While less expensive than surgery, some advanced non-surgical treatments remain costly for a significant portion of the population, limiting accessibility.
- Regulatory Hurdles and Approvals: Stringent approval processes for new devices and injectables can be time-consuming and expensive, impacting the speed of innovation.
- Public Perception and Misinformation: Misconceptions about the safety and efficacy of treatments, along with the risk of unqualified practitioners, can deter potential patients.
- Competition from Unregulated Markets: The proliferation of low-cost, potentially unsafe treatments from unverified sources poses a challenge to legitimate providers.
- Maintenance and Repeat Treatments: Many non-surgical treatments require ongoing sessions or touch-ups to maintain results, impacting long-term patient commitment and cost. Supply chain disruptions for key ingredients or components can also impact market availability and pricing.
Emerging Opportunities in Non-Surgical Cosmetic Treatment
Emerging opportunities in the non-surgical cosmetic treatment market lie in the expansion of treatments for the Men segment, which is currently underserved compared to the Women segment. The development of more targeted and effective CoolSculpting alternatives and advanced radiofrequency and ultrasound devices for body contouring also presents significant potential. Furthermore, the growing demand for combination therapies that integrate various modalities like injectables with laser treatments for comprehensive facial rejuvenation is an area ripe for innovation. Untapped markets in developing economies, coupled with evolving consumer preferences for natural-looking results and preventative anti-aging strategies, will drive future growth.
Growth Accelerators in the Non-Surgical Cosmetic Treatment Industry
Long-term growth in the non-surgical cosmetic treatment industry will be accelerated by continuous technological breakthroughs, particularly in areas like personalized medicine and AI-driven treatment planning. Strategic partnerships between device manufacturers, pharmaceutical companies, and aesthetic practitioners will foster innovation and market penetration. Expansion into emerging markets with growing disposable incomes and increasing aesthetic awareness will also be crucial growth catalysts. Furthermore, advancements in biologics and regenerative medicine could lead to novel non-surgical solutions with enhanced efficacy and longer-lasting results, further propelling the industry forward.
Key Players Shaping the Non-Surgical Cosmetic Treatment Market
- Hologic, Inc.
- Allergan, Inc.
- Galderma S.A.
- Alma Lasers
- Syneron Candela
- Johnson & Johnson
- Merz Pharma
- Lumenis
- Solta Medical
- Cutera, Inc.
- Revance Therapeutics, Inc.
- LANCY
Notable Milestones in Non-Surgical Cosmetic Treatment Sector
- 2019: Increased FDA approvals for new dermal filler formulations focusing on enhanced longevity and natural integration.
- 2020: Significant growth in demand for at-home and minimally invasive treatments driven by the global pandemic.
- 2021: Advancements in energy-based devices for skin tightening and collagen stimulation gain wider adoption.
- 2022: Growing interest and development of treatments specifically catering to the male aesthetic market.
- 2023: Introduction of novel injectables with improved safety profiles and reduced side effects.
- 2024: Expansion of CoolSculpting capabilities and newer cryolipolysis technologies offering more precise fat reduction.
In-Depth Non-Surgical Cosmetic Treatment Market Outlook
The future outlook for the non-surgical cosmetic treatment market is exceptionally promising, characterized by sustained growth driven by innovation and evolving consumer desires. Strategic opportunities lie in the further development of personalized treatment protocols leveraging AI and big data analytics, enhancing patient outcomes. The growing demand for preventative and restorative aesthetic solutions will continue to fuel advancements in injectables, energy-based devices, and minimally invasive procedures. Companies focusing on expanding their portfolios to include a comprehensive range of non-surgical options and strategically entering emerging markets are poised for significant success. The increasing acceptance of aesthetic treatments across all demographics and genders solidifies the long-term growth trajectory of this dynamic market.
Non-Surgical Cosmetic Treatment Segmentation
-
1. Application
- 1.1. Men
- 1.2. Women
-
2. Types
- 2.1. CoolSculpting
- 2.2. Botox and Dermal Fillers
- 2.3. Exfoliation
- 2.4. Laser Skin Resurfacing and Photofacials
- 2.5. Radio frequency and Ultrasound
- 2.6. Thread Lift
- 2.7. Others
Non-Surgical Cosmetic Treatment Segmentation By Geography
-
1. North America
- 1.1. United States
- 1.2. Canada
- 1.3. Mexico
-
2. South America
- 2.1. Brazil
- 2.2. Argentina
- 2.3. Rest of South America
-
3. Europe
- 3.1. United Kingdom
- 3.2. Germany
- 3.3. France
- 3.4. Italy
- 3.5. Spain
- 3.6. Russia
- 3.7. Benelux
- 3.8. Nordics
- 3.9. Rest of Europe
-
4. Middle East & Africa
- 4.1. Turkey
- 4.2. Israel
- 4.3. GCC
- 4.4. North Africa
- 4.5. South Africa
- 4.6. Rest of Middle East & Africa
-
5. Asia Pacific
- 5.1. China
- 5.2. India
- 5.3. Japan
- 5.4. South Korea
- 5.5. ASEAN
- 5.6. Oceania
- 5.7. Rest of Asia Pacific
Non-Surgical Cosmetic Treatment REPORT HIGHLIGHTS
| Aspects | Details |
|---|---|
| Study Period | 2019-2033 |
| Base Year | 2024 |
| Estimated Year | 2025 |
| Forecast Period | 2025-2033 |
| Historical Period | 2019-2024 |
| Growth Rate | CAGR of XX% from 2019-2033 |
| Segmentation |
|
Table of Contents
- 1. Introduction
- 1.1. Research Scope
- 1.2. Market Segmentation
- 1.3. Research Methodology
- 1.4. Definitions and Assumptions
- 2. Executive Summary
- 2.1. Introduction
- 3. Market Dynamics
- 3.1. Introduction
- 3.2. Market Drivers
- 3.3. Market Restrains
- 3.4. Market Trends
- 4. Market Factor Analysis
- 4.1. Porters Five Forces
- 4.2. Supply/Value Chain
- 4.3. PESTEL analysis
- 4.4. Market Entropy
- 4.5. Patent/Trademark Analysis
- 5. Global Non-Surgical Cosmetic Treatment Analysis, Insights and Forecast, 2019-2031
- 5.1. Market Analysis, Insights and Forecast - by Application
- 5.1.1. Men
- 5.1.2. Women
- 5.2. Market Analysis, Insights and Forecast - by Types
- 5.2.1. CoolSculpting
- 5.2.2. Botox and Dermal Fillers
- 5.2.3. Exfoliation
- 5.2.4. Laser Skin Resurfacing and Photofacials
- 5.2.5. Radio frequency and Ultrasound
- 5.2.6. Thread Lift
- 5.2.7. Others
- 5.3. Market Analysis, Insights and Forecast - by Region
- 5.3.1. North America
- 5.3.2. South America
- 5.3.3. Europe
- 5.3.4. Middle East & Africa
- 5.3.5. Asia Pacific
- 5.1. Market Analysis, Insights and Forecast - by Application
- 6. North America Non-Surgical Cosmetic Treatment Analysis, Insights and Forecast, 2019-2031
- 6.1. Market Analysis, Insights and Forecast - by Application
- 6.1.1. Men
- 6.1.2. Women
- 6.2. Market Analysis, Insights and Forecast - by Types
- 6.2.1. CoolSculpting
- 6.2.2. Botox and Dermal Fillers
- 6.2.3. Exfoliation
- 6.2.4. Laser Skin Resurfacing and Photofacials
- 6.2.5. Radio frequency and Ultrasound
- 6.2.6. Thread Lift
- 6.2.7. Others
- 6.1. Market Analysis, Insights and Forecast - by Application
- 7. South America Non-Surgical Cosmetic Treatment Analysis, Insights and Forecast, 2019-2031
- 7.1. Market Analysis, Insights and Forecast - by Application
- 7.1.1. Men
- 7.1.2. Women
- 7.2. Market Analysis, Insights and Forecast - by Types
- 7.2.1. CoolSculpting
- 7.2.2. Botox and Dermal Fillers
- 7.2.3. Exfoliation
- 7.2.4. Laser Skin Resurfacing and Photofacials
- 7.2.5. Radio frequency and Ultrasound
- 7.2.6. Thread Lift
- 7.2.7. Others
- 7.1. Market Analysis, Insights and Forecast - by Application
- 8. Europe Non-Surgical Cosmetic Treatment Analysis, Insights and Forecast, 2019-2031
- 8.1. Market Analysis, Insights and Forecast - by Application
- 8.1.1. Men
- 8.1.2. Women
- 8.2. Market Analysis, Insights and Forecast - by Types
- 8.2.1. CoolSculpting
- 8.2.2. Botox and Dermal Fillers
- 8.2.3. Exfoliation
- 8.2.4. Laser Skin Resurfacing and Photofacials
- 8.2.5. Radio frequency and Ultrasound
- 8.2.6. Thread Lift
- 8.2.7. Others
- 8.1. Market Analysis, Insights and Forecast - by Application
- 9. Middle East & Africa Non-Surgical Cosmetic Treatment Analysis, Insights and Forecast, 2019-2031
- 9.1. Market Analysis, Insights and Forecast - by Application
- 9.1.1. Men
- 9.1.2. Women
- 9.2. Market Analysis, Insights and Forecast - by Types
- 9.2.1. CoolSculpting
- 9.2.2. Botox and Dermal Fillers
- 9.2.3. Exfoliation
- 9.2.4. Laser Skin Resurfacing and Photofacials
- 9.2.5. Radio frequency and Ultrasound
- 9.2.6. Thread Lift
- 9.2.7. Others
- 9.1. Market Analysis, Insights and Forecast - by Application
- 10. Asia Pacific Non-Surgical Cosmetic Treatment Analysis, Insights and Forecast, 2019-2031
- 10.1. Market Analysis, Insights and Forecast - by Application
- 10.1.1. Men
- 10.1.2. Women
- 10.2. Market Analysis, Insights and Forecast - by Types
- 10.2.1. CoolSculpting
- 10.2.2. Botox and Dermal Fillers
- 10.2.3. Exfoliation
- 10.2.4. Laser Skin Resurfacing and Photofacials
- 10.2.5. Radio frequency and Ultrasound
- 10.2.6. Thread Lift
- 10.2.7. Others
- 10.1. Market Analysis, Insights and Forecast - by Application
- 11. Competitive Analysis
- 11.1. Global Market Share Analysis 2024
- 11.2. Company Profiles
- 11.2.1 Hologic
- 11.2.1.1. Overview
- 11.2.1.2. Products
- 11.2.1.3. SWOT Analysis
- 11.2.1.4. Recent Developments
- 11.2.1.5. Financials (Based on Availability)
- 11.2.2 Inc.
- 11.2.2.1. Overview
- 11.2.2.2. Products
- 11.2.2.3. SWOT Analysis
- 11.2.2.4. Recent Developments
- 11.2.2.5. Financials (Based on Availability)
- 11.2.3 Allergan
- 11.2.3.1. Overview
- 11.2.3.2. Products
- 11.2.3.3. SWOT Analysis
- 11.2.3.4. Recent Developments
- 11.2.3.5. Financials (Based on Availability)
- 11.2.4 Inc.
- 11.2.4.1. Overview
- 11.2.4.2. Products
- 11.2.4.3. SWOT Analysis
- 11.2.4.4. Recent Developments
- 11.2.4.5. Financials (Based on Availability)
- 11.2.5 Galderma S.A.
- 11.2.5.1. Overview
- 11.2.5.2. Products
- 11.2.5.3. SWOT Analysis
- 11.2.5.4. Recent Developments
- 11.2.5.5. Financials (Based on Availability)
- 11.2.6 Alma Lasers
- 11.2.6.1. Overview
- 11.2.6.2. Products
- 11.2.6.3. SWOT Analysis
- 11.2.6.4. Recent Developments
- 11.2.6.5. Financials (Based on Availability)
- 11.2.7 Syneron Candela
- 11.2.7.1. Overview
- 11.2.7.2. Products
- 11.2.7.3. SWOT Analysis
- 11.2.7.4. Recent Developments
- 11.2.7.5. Financials (Based on Availability)
- 11.2.8 Johnson & Johnson
- 11.2.8.1. Overview
- 11.2.8.2. Products
- 11.2.8.3. SWOT Analysis
- 11.2.8.4. Recent Developments
- 11.2.8.5. Financials (Based on Availability)
- 11.2.9 Merz Pharma
- 11.2.9.1. Overview
- 11.2.9.2. Products
- 11.2.9.3. SWOT Analysis
- 11.2.9.4. Recent Developments
- 11.2.9.5. Financials (Based on Availability)
- 11.2.10 Lumenis
- 11.2.10.1. Overview
- 11.2.10.2. Products
- 11.2.10.3. SWOT Analysis
- 11.2.10.4. Recent Developments
- 11.2.10.5. Financials (Based on Availability)
- 11.2.11 Solta Medical
- 11.2.11.1. Overview
- 11.2.11.2. Products
- 11.2.11.3. SWOT Analysis
- 11.2.11.4. Recent Developments
- 11.2.11.5. Financials (Based on Availability)
- 11.2.12 Cutera
- 11.2.12.1. Overview
- 11.2.12.2. Products
- 11.2.12.3. SWOT Analysis
- 11.2.12.4. Recent Developments
- 11.2.12.5. Financials (Based on Availability)
- 11.2.13 Inc.
- 11.2.13.1. Overview
- 11.2.13.2. Products
- 11.2.13.3. SWOT Analysis
- 11.2.13.4. Recent Developments
- 11.2.13.5. Financials (Based on Availability)
- 11.2.14 Revance Therapeutics
- 11.2.14.1. Overview
- 11.2.14.2. Products
- 11.2.14.3. SWOT Analysis
- 11.2.14.4. Recent Developments
- 11.2.14.5. Financials (Based on Availability)
- 11.2.15 Inc.
- 11.2.15.1. Overview
- 11.2.15.2. Products
- 11.2.15.3. SWOT Analysis
- 11.2.15.4. Recent Developments
- 11.2.15.5. Financials (Based on Availability)
- 11.2.16 LANCY
- 11.2.16.1. Overview
- 11.2.16.2. Products
- 11.2.16.3. SWOT Analysis
- 11.2.16.4. Recent Developments
- 11.2.16.5. Financials (Based on Availability)
- 11.2.1 Hologic
List of Figures
- Figure 1: Global Non-Surgical Cosmetic Treatment Revenue Breakdown (million, %) by Region 2024 & 2032
- Figure 2: North America Non-Surgical Cosmetic Treatment Revenue (million), by Application 2024 & 2032
- Figure 3: North America Non-Surgical Cosmetic Treatment Revenue Share (%), by Application 2024 & 2032
- Figure 4: North America Non-Surgical Cosmetic Treatment Revenue (million), by Types 2024 & 2032
- Figure 5: North America Non-Surgical Cosmetic Treatment Revenue Share (%), by Types 2024 & 2032
- Figure 6: North America Non-Surgical Cosmetic Treatment Revenue (million), by Country 2024 & 2032
- Figure 7: North America Non-Surgical Cosmetic Treatment Revenue Share (%), by Country 2024 & 2032
- Figure 8: South America Non-Surgical Cosmetic Treatment Revenue (million), by Application 2024 & 2032
- Figure 9: South America Non-Surgical Cosmetic Treatment Revenue Share (%), by Application 2024 & 2032
- Figure 10: South America Non-Surgical Cosmetic Treatment Revenue (million), by Types 2024 & 2032
- Figure 11: South America Non-Surgical Cosmetic Treatment Revenue Share (%), by Types 2024 & 2032
- Figure 12: South America Non-Surgical Cosmetic Treatment Revenue (million), by Country 2024 & 2032
- Figure 13: South America Non-Surgical Cosmetic Treatment Revenue Share (%), by Country 2024 & 2032
- Figure 14: Europe Non-Surgical Cosmetic Treatment Revenue (million), by Application 2024 & 2032
- Figure 15: Europe Non-Surgical Cosmetic Treatment Revenue Share (%), by Application 2024 & 2032
- Figure 16: Europe Non-Surgical Cosmetic Treatment Revenue (million), by Types 2024 & 2032
- Figure 17: Europe Non-Surgical Cosmetic Treatment Revenue Share (%), by Types 2024 & 2032
- Figure 18: Europe Non-Surgical Cosmetic Treatment Revenue (million), by Country 2024 & 2032
- Figure 19: Europe Non-Surgical Cosmetic Treatment Revenue Share (%), by Country 2024 & 2032
- Figure 20: Middle East & Africa Non-Surgical Cosmetic Treatment Revenue (million), by Application 2024 & 2032
- Figure 21: Middle East & Africa Non-Surgical Cosmetic Treatment Revenue Share (%), by Application 2024 & 2032
- Figure 22: Middle East & Africa Non-Surgical Cosmetic Treatment Revenue (million), by Types 2024 & 2032
- Figure 23: Middle East & Africa Non-Surgical Cosmetic Treatment Revenue Share (%), by Types 2024 & 2032
- Figure 24: Middle East & Africa Non-Surgical Cosmetic Treatment Revenue (million), by Country 2024 & 2032
- Figure 25: Middle East & Africa Non-Surgical Cosmetic Treatment Revenue Share (%), by Country 2024 & 2032
- Figure 26: Asia Pacific Non-Surgical Cosmetic Treatment Revenue (million), by Application 2024 & 2032
- Figure 27: Asia Pacific Non-Surgical Cosmetic Treatment Revenue Share (%), by Application 2024 & 2032
- Figure 28: Asia Pacific Non-Surgical Cosmetic Treatment Revenue (million), by Types 2024 & 2032
- Figure 29: Asia Pacific Non-Surgical Cosmetic Treatment Revenue Share (%), by Types 2024 & 2032
- Figure 30: Asia Pacific Non-Surgical Cosmetic Treatment Revenue (million), by Country 2024 & 2032
- Figure 31: Asia Pacific Non-Surgical Cosmetic Treatment Revenue Share (%), by Country 2024 & 2032
List of Tables
- Table 1: Global Non-Surgical Cosmetic Treatment Revenue million Forecast, by Region 2019 & 2032
- Table 2: Global Non-Surgical Cosmetic Treatment Revenue million Forecast, by Application 2019 & 2032
- Table 3: Global Non-Surgical Cosmetic Treatment Revenue million Forecast, by Types 2019 & 2032
- Table 4: Global Non-Surgical Cosmetic Treatment Revenue million Forecast, by Region 2019 & 2032
- Table 5: Global Non-Surgical Cosmetic Treatment Revenue million Forecast, by Application 2019 & 2032
- Table 6: Global Non-Surgical Cosmetic Treatment Revenue million Forecast, by Types 2019 & 2032
- Table 7: Global Non-Surgical Cosmetic Treatment Revenue million Forecast, by Country 2019 & 2032
- Table 8: United States Non-Surgical Cosmetic Treatment Revenue (million) Forecast, by Application 2019 & 2032
- Table 9: Canada Non-Surgical Cosmetic Treatment Revenue (million) Forecast, by Application 2019 & 2032
- Table 10: Mexico Non-Surgical Cosmetic Treatment Revenue (million) Forecast, by Application 2019 & 2032
- Table 11: Global Non-Surgical Cosmetic Treatment Revenue million Forecast, by Application 2019 & 2032
- Table 12: Global Non-Surgical Cosmetic Treatment Revenue million Forecast, by Types 2019 & 2032
- Table 13: Global Non-Surgical Cosmetic Treatment Revenue million Forecast, by Country 2019 & 2032
- Table 14: Brazil Non-Surgical Cosmetic Treatment Revenue (million) Forecast, by Application 2019 & 2032
- Table 15: Argentina Non-Surgical Cosmetic Treatment Revenue (million) Forecast, by Application 2019 & 2032
- Table 16: Rest of South America Non-Surgical Cosmetic Treatment Revenue (million) Forecast, by Application 2019 & 2032
- Table 17: Global Non-Surgical Cosmetic Treatment Revenue million Forecast, by Application 2019 & 2032
- Table 18: Global Non-Surgical Cosmetic Treatment Revenue million Forecast, by Types 2019 & 2032
- Table 19: Global Non-Surgical Cosmetic Treatment Revenue million Forecast, by Country 2019 & 2032
- Table 20: United Kingdom Non-Surgical Cosmetic Treatment Revenue (million) Forecast, by Application 2019 & 2032
- Table 21: Germany Non-Surgical Cosmetic Treatment Revenue (million) Forecast, by Application 2019 & 2032
- Table 22: France Non-Surgical Cosmetic Treatment Revenue (million) Forecast, by Application 2019 & 2032
- Table 23: Italy Non-Surgical Cosmetic Treatment Revenue (million) Forecast, by Application 2019 & 2032
- Table 24: Spain Non-Surgical Cosmetic Treatment Revenue (million) Forecast, by Application 2019 & 2032
- Table 25: Russia Non-Surgical Cosmetic Treatment Revenue (million) Forecast, by Application 2019 & 2032
- Table 26: Benelux Non-Surgical Cosmetic Treatment Revenue (million) Forecast, by Application 2019 & 2032
- Table 27: Nordics Non-Surgical Cosmetic Treatment Revenue (million) Forecast, by Application 2019 & 2032
- Table 28: Rest of Europe Non-Surgical Cosmetic Treatment Revenue (million) Forecast, by Application 2019 & 2032
- Table 29: Global Non-Surgical Cosmetic Treatment Revenue million Forecast, by Application 2019 & 2032
- Table 30: Global Non-Surgical Cosmetic Treatment Revenue million Forecast, by Types 2019 & 2032
- Table 31: Global Non-Surgical Cosmetic Treatment Revenue million Forecast, by Country 2019 & 2032
- Table 32: Turkey Non-Surgical Cosmetic Treatment Revenue (million) Forecast, by Application 2019 & 2032
- Table 33: Israel Non-Surgical Cosmetic Treatment Revenue (million) Forecast, by Application 2019 & 2032
- Table 34: GCC Non-Surgical Cosmetic Treatment Revenue (million) Forecast, by Application 2019 & 2032
- Table 35: North Africa Non-Surgical Cosmetic Treatment Revenue (million) Forecast, by Application 2019 & 2032
- Table 36: South Africa Non-Surgical Cosmetic Treatment Revenue (million) Forecast, by Application 2019 & 2032
- Table 37: Rest of Middle East & Africa Non-Surgical Cosmetic Treatment Revenue (million) Forecast, by Application 2019 & 2032
- Table 38: Global Non-Surgical Cosmetic Treatment Revenue million Forecast, by Application 2019 & 2032
- Table 39: Global Non-Surgical Cosmetic Treatment Revenue million Forecast, by Types 2019 & 2032
- Table 40: Global Non-Surgical Cosmetic Treatment Revenue million Forecast, by Country 2019 & 2032
- Table 41: China Non-Surgical Cosmetic Treatment Revenue (million) Forecast, by Application 2019 & 2032
- Table 42: India Non-Surgical Cosmetic Treatment Revenue (million) Forecast, by Application 2019 & 2032
- Table 43: Japan Non-Surgical Cosmetic Treatment Revenue (million) Forecast, by Application 2019 & 2032
- Table 44: South Korea Non-Surgical Cosmetic Treatment Revenue (million) Forecast, by Application 2019 & 2032
- Table 45: ASEAN Non-Surgical Cosmetic Treatment Revenue (million) Forecast, by Application 2019 & 2032
- Table 46: Oceania Non-Surgical Cosmetic Treatment Revenue (million) Forecast, by Application 2019 & 2032
- Table 47: Rest of Asia Pacific Non-Surgical Cosmetic Treatment Revenue (million) Forecast, by Application 2019 & 2032
Frequently Asked Questions
1. What is the projected Compound Annual Growth Rate (CAGR) of the Non-Surgical Cosmetic Treatment?
The projected CAGR is approximately XX%.
2. Which companies are prominent players in the Non-Surgical Cosmetic Treatment?
Key companies in the market include Hologic, Inc., Allergan, Inc., Galderma S.A., Alma Lasers, Syneron Candela, Johnson & Johnson, Merz Pharma, Lumenis, Solta Medical, Cutera, Inc., Revance Therapeutics, Inc., LANCY.
3. What are the main segments of the Non-Surgical Cosmetic Treatment?
The market segments include Application, Types.
4. Can you provide details about the market size?
The market size is estimated to be USD XXX million as of 2022.
5. What are some drivers contributing to market growth?
N/A
6. What are the notable trends driving market growth?
N/A
7. Are there any restraints impacting market growth?
N/A
8. Can you provide examples of recent developments in the market?
N/A
9. What pricing options are available for accessing the report?
Pricing options include single-user, multi-user, and enterprise licenses priced at USD 3350.00, USD 5025.00, and USD 6700.00 respectively.
10. Is the market size provided in terms of value or volume?
The market size is provided in terms of value, measured in million.
11. Are there any specific market keywords associated with the report?
Yes, the market keyword associated with the report is "Non-Surgical Cosmetic Treatment," which aids in identifying and referencing the specific market segment covered.
12. How do I determine which pricing option suits my needs best?
The pricing options vary based on user requirements and access needs. Individual users may opt for single-user licenses, while businesses requiring broader access may choose multi-user or enterprise licenses for cost-effective access to the report.
13. Are there any additional resources or data provided in the Non-Surgical Cosmetic Treatment report?
While the report offers comprehensive insights, it's advisable to review the specific contents or supplementary materials provided to ascertain if additional resources or data are available.
14. How can I stay updated on further developments or reports in the Non-Surgical Cosmetic Treatment?
To stay informed about further developments, trends, and reports in the Non-Surgical Cosmetic Treatment, consider subscribing to industry newsletters, following relevant companies and organizations, or regularly checking reputable industry news sources and publications.
Methodology
Step 1 - Identification of Relevant Samples Size from Population Database


Step 2 - Approaches for Defining Global Market Size (Value, Volume* & Price*)

Note*: In applicable scenarios
Step 3 - Data Sources
Primary Research
- Web Analytics
- Survey Reports
- Research Institute
- Latest Research Reports
- Opinion Leaders
Secondary Research
- Annual Reports
- White Paper
- Latest Press Release
- Industry Association
- Paid Database
- Investor Presentations

Step 4 - Data Triangulation
Involves using different sources of information in order to increase the validity of a study
These sources are likely to be stakeholders in a program - participants, other researchers, program staff, other community members, and so on.
Then we put all data in single framework & apply various statistical tools to find out the dynamic on the market.
During the analysis stage, feedback from the stakeholder groups would be compared to determine areas of agreement as well as areas of divergence


