

Key Insights
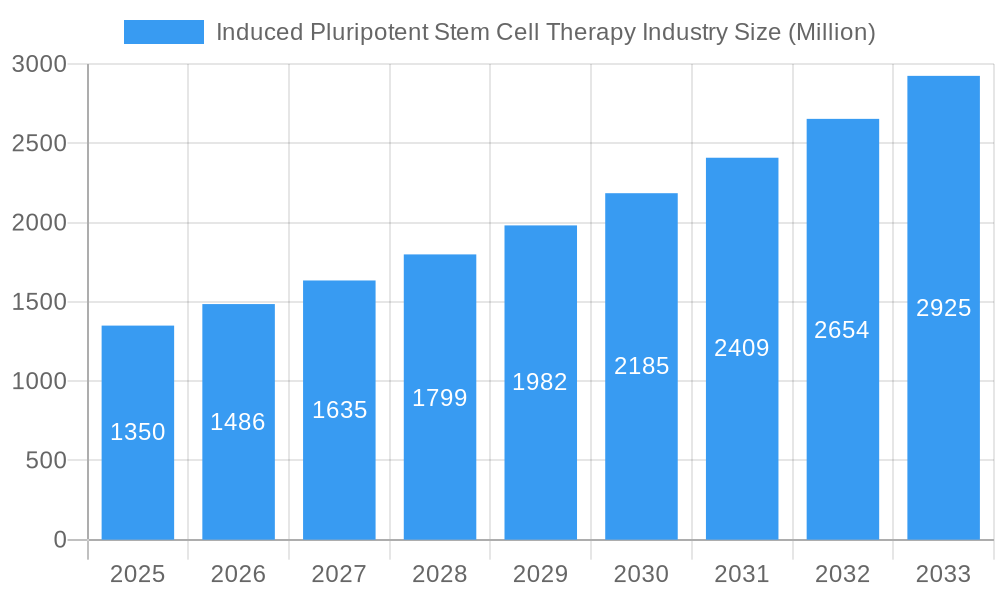
The Induced Pluripotent Stem Cell (iPSC) Therapy market is poised for substantial expansion, projected to reach an estimated \$1.35 billion in 2025 with a robust Compound Annual Growth Rate (CAGR) of 10.10%. This significant growth is propelled by several key drivers, including the escalating demand for personalized medicine, advancements in gene editing technologies like CRISPR-Cas9, and the increasing prevalence of chronic diseases requiring novel therapeutic interventions. The ability of iPSCs to differentiate into virtually any cell type makes them an invaluable tool in regenerative medicine, offering hope for treating conditions such as Parkinson's disease, diabetes, and heart failure. Furthermore, iPSCs are revolutionizing drug development and toxicity testing by providing more accurate and human-relevant disease models, thereby reducing the reliance on animal testing and accelerating the drug discovery pipeline. The market's dynamism is further fueled by ongoing research and development, leading to improved differentiation protocols and enhanced safety profiles for iPSC-derived therapies.
Induced Pluripotent Stem Cell Therapy Industry Market Size (In Billion)
The market segmentation reveals a diverse landscape, with Hepatocytes, Fibroblasts, and Neurons emerging as prominent derived cell types due to their critical roles in various therapeutic applications and research. In terms of applications, Drug Development and Regenerative Medicine are anticipated to lead the market, reflecting their immediate and future potential. The increasing focus on personalized therapies and the exploration of iPSC-based treatments for a wide range of conditions underscore this dominance. The end-user landscape is primarily characterized by Research Institutions, which are at the forefront of iPSC innovation. However, the burgeoning clinical applications are gradually increasing the presence of other end-users, including biotechnology companies and healthcare providers. Geographically, North America and Europe are expected to maintain their leading positions, driven by substantial R&D investments, well-established healthcare infrastructures, and supportive regulatory frameworks. The Asia Pacific region, particularly China and Japan, is demonstrating rapid growth due to increasing healthcare expenditure and a growing focus on stem cell research. While the market faces restraints such as the high cost of therapy development and ethical considerations, the overwhelming potential for disease treatment and the continuous innovation in the field suggest a promising trajectory for the iPSC therapy industry.
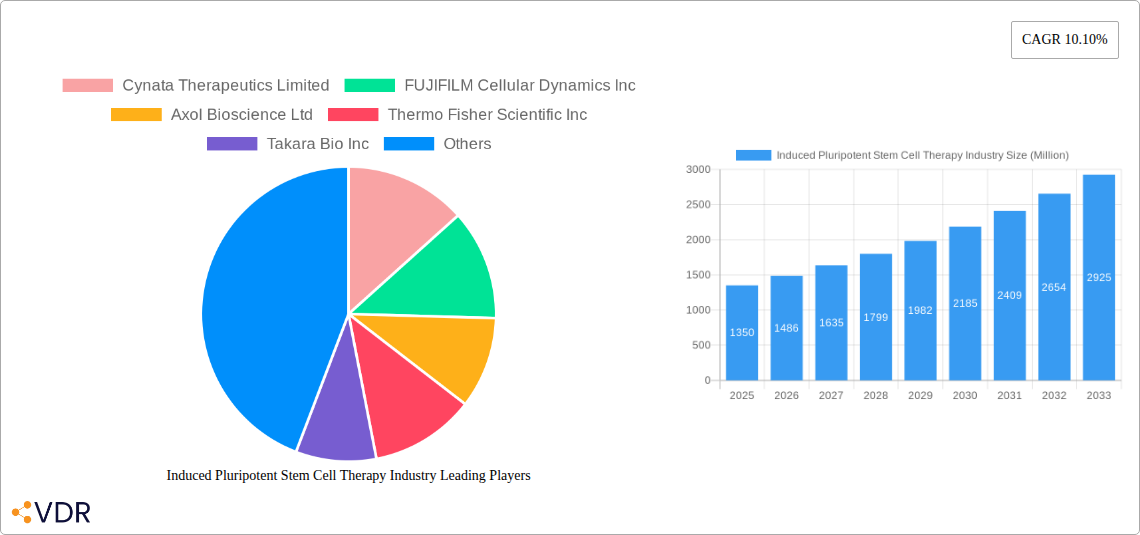
Induced Pluripotent Stem Cell Therapy Industry Company Market Share
Induced Pluripotent Stem Cell Therapy Industry Report: Comprehensive Market Analysis & Forecast (2019–2033)
This in-depth report provides a definitive analysis of the Induced Pluripotent Stem Cell (iPSC) Therapy industry, offering granular insights into market dynamics, growth trends, competitive landscape, and future opportunities. Leveraging extensive research and proprietary data, this report is an indispensable resource for stakeholders seeking to understand and capitalize on the burgeoning iPSC market. The study period spans from 2019 to 2033, with a base year of 2025.
Induced Pluripotent Stem Cell Therapy Industry Market Dynamics & Structure
The Induced Pluripotent Stem Cell (iPSC) therapy market is characterized by a dynamic interplay of technological innovation, evolving regulatory frameworks, and increasing investor interest. Market concentration varies across different segments, with specialized iPSC providers and large pharmaceutical companies vying for dominance. Technological advancements in reprogramming efficiency, differentiation protocols, and gene editing techniques are key drivers, fueling rapid innovation in disease modeling and regenerative medicine applications. Regulatory bodies are actively establishing guidelines for iPSC-based therapies, creating both opportunities and challenges for market entrants. While competitive product substitutes exist, such as other stem cell types and cell-free therapies, the unique potential of iPSCs for personalized medicine and disease-specific therapies provides a strong competitive advantage. End-user demographics are shifting towards academic research institutions and biopharmaceutical companies actively engaged in early-stage drug discovery and clinical development. Mergers and acquisitions (M&A) are becoming increasingly prevalent as companies seek to consolidate their positions, acquire novel technologies, and expand their therapeutic portfolios.
- Market Concentration: Moderate to high in niche technology segments, with emerging consolidation.
- Technological Innovation Drivers: Enhanced reprogramming efficiency, CRISPR integration, scalable manufacturing.
- Regulatory Frameworks: Evolving guidelines from FDA, EMA, influencing clinical trial design and market access.
- Competitive Product Substitutes: Adult stem cells, allogeneic cell therapies, gene therapies.
- End-User Demographics: Predominantly research institutions and pharmaceutical companies, with growing interest from contract development and manufacturing organizations (CDMOs).
- M&A Trends: Strategic acquisitions to secure intellectual property and expand clinical pipelines.
Induced Pluripotent Stem Cell Therapy Industry Growth Trends & Insights
The Induced Pluripotent Stem Cell (iPSC) therapy industry is poised for significant growth, driven by advancements in regenerative medicine and drug development. The market size is projected to witness a robust Compound Annual Growth Rate (CAGR) of XX% from 2025 to 2033. Adoption rates of iPSC technologies are accelerating as researchers and clinicians recognize their potential in creating patient-specific disease models and developing novel therapeutic interventions for currently untreatable conditions. Technological disruptions, including the development of more efficient and cost-effective reprogramming methods and advanced differentiation protocols, are paving the way for broader clinical application. Consumer behavior, particularly within the research community and among patients seeking advanced treatment options, is increasingly favoring stem cell-based solutions. The expanding understanding of iPSC biology and its therapeutic applications, coupled with substantial investments in research and development, will further fuel market penetration. The shift towards personalized medicine and the growing demand for effective treatments for chronic and degenerative diseases are critical factors contributing to this upward trajectory. The market penetration is expected to reach XX% by 2033, reflecting a substantial increase from historical levels.
Dominant Regions, Countries, or Segments in Induced Pluripotent Stem Cell Therapy Industry
North America, particularly the United States, currently dominates the Induced Pluripotent Stem Cell (iPSC) therapy industry. This dominance is attributed to a robust research ecosystem, significant government funding for stem cell research, and the presence of leading biopharmaceutical companies and academic institutions. The region's advanced regulatory pathways, while rigorous, also foster innovation and facilitate clinical translation. The Regenerative Medicine application segment is a key growth driver, with substantial investment in therapies for conditions like cardiovascular diseases, neurodegenerative disorders, and diabetes. Within the Derived Cell Type segment, Neurons are witnessing significant traction due to their crucial role in treating neurological disorders, followed closely by Hepatocytes for liver diseases. Research Institutions constitute the largest End User segment, actively utilizing iPSCs for disease modeling, drug discovery, and preclinical studies.
- Dominant Region: North America (USA) – driven by funding, innovation, and regulatory support.
- Key Application Driver: Regenerative Medicine – immense therapeutic potential and unmet clinical needs.
- Leading Derived Cell Type: Neurons – critical for neurological disease research and therapy development.
- Primary End User: Research Institutions – foundational for iPSC technology advancement and application.
- Growth Potential: Significant, fueled by ongoing clinical trials and increasing investment.
- Market Share: North America holds an estimated XX% market share in 2025.
Induced Pluripotent Stem Cell Therapy Industry Product Landscape
The Induced Pluripotent Stem Cell (iPSC) therapy product landscape is characterized by diverse offerings catering to research and therapeutic development. Products range from iPSC lines and differentiation kits to cell culture media and gene-editing tools. Key innovations include the development of GMP-grade iPSCs for clinical applications, advanced differentiation protocols yielding highly pure cell populations, and novel delivery systems for cell therapies. These products are instrumental in disease modeling, drug toxicity testing, and ultimately, the development of regenerative medicine treatments. Performance metrics focus on pluripotency maintenance, differentiation efficiency, and the absence of tumorigenicity. The unique selling proposition lies in the ability of iPSCs to generate patient-specific cells, enabling personalized approaches to disease treatment and drug development.
Key Drivers, Barriers & Challenges in Induced Pluripotent Stem Cell Therapy Industry
Key Drivers:
- Advancements in Regenerative Medicine: The potential to repair or replace damaged tissues and organs is a primary driver, offering hope for patients with chronic and degenerative diseases.
- Personalized Medicine: iPSCs enable the creation of patient-specific cells for tailored therapies and disease modeling, a cornerstone of modern healthcare.
- Drug Discovery and Development: iPSC-derived cells are invaluable for in vitro screening of drug candidates, improving efficacy and reducing attrition rates in clinical trials.
- Increasing Incidence of Chronic Diseases: The growing global burden of diseases like Alzheimer's, Parkinson's, diabetes, and cardiovascular conditions fuels demand for novel therapeutic solutions.
- Government and Private Funding: Significant investments from governments and venture capitalists are accelerating research and development in the iPSC sector.
Barriers & Challenges:
- High Cost of Production: Manufacturing of GMP-grade iPSCs and subsequent cell therapies remains expensive, posing a significant barrier to widespread adoption.
- Regulatory Hurdles: Navigating complex and evolving regulatory pathways for cell-based therapies can be time-consuming and resource-intensive.
- Ethical Considerations: While iPSCs bypass many ethical concerns associated with embryonic stem cells, discussions around their use and potential applications continue.
- Tumorigenicity Risk: Ensuring the complete absence of tumorigenic potential in differentiated iPSC-derived cells is crucial for therapeutic safety.
- Scalability and Manufacturing Challenges: Scaling up iPSC production to meet clinical demand efficiently and consistently presents significant technical and logistical challenges.
- Immunogenicity: Managing potential immune responses to transplanted iPSC-derived cells requires ongoing research and development.
Emerging Opportunities in Induced Pluripotent Stem Cell Therapy Industry
The Induced Pluripotent Stem Cell (iPSC) therapy industry is ripe with emerging opportunities. The development of novel disease models for rare genetic disorders and complex diseases offers a significant untapped market for research institutions and pharmaceutical companies. Furthermore, advancements in gene editing technologies, such as CRISPR-Cas9, integrated with iPSC technology, open doors for developing curative therapies for inherited diseases. The expansion of contract development and manufacturing organizations (CDMOs) specializing in iPSC production and cell therapy manufacturing presents a substantial growth avenue. Evolving consumer preferences for minimally invasive and personalized treatments will further drive the demand for iPSC-based regenerative medicine solutions. The exploration of off-the-shelf iPSC banks for allogeneic transplantation also presents a promising path to overcome patient-specific production limitations.
Growth Accelerators in the Induced Pluripotent Stem Cell Therapy Industry Industry
Several catalysts are accelerating the growth of the Induced Pluripotent Stem Cell (iPSC) therapy industry. Technological breakthroughs in achieving higher reprogramming efficiencies, developing more precise differentiation protocols, and improving gene-editing integration are fundamental to progress. Strategic partnerships between academic institutions, biotech firms, and pharmaceutical giants are crucial for translating research discoveries into viable clinical applications. Market expansion strategies, including the development of novel therapeutic applications for a wider range of diseases and the establishment of robust manufacturing capabilities, are also key accelerators. Furthermore, supportive government policies and increased venture capital funding are providing the financial impetus for accelerated growth and innovation in this rapidly evolving field. The focus on overcoming existing manufacturing and regulatory challenges is also a significant growth enabler.
Key Players Shaping the Induced Pluripotent Stem Cell Therapy Industry Market
- Cynata Therapeutics Limited
- FUJIFILM Cellular Dynamics Inc
- Axol Bioscience Ltd
- Thermo Fisher Scientific Inc
- Takara Bio Inc
- REPROCELL USA Inc
- LizarBio Therapeutics (Pluricell Biotech)
- Fate Therapeutics Inc
- Sumitomo Dainippon Pharma Co Ltd
- Ncardia
- ViaCyte Inc
- Evotec SE
Notable Milestones in Induced Pluripotent Stem Cell Therapy Industry Sector
- November 2022: Prepaire Labs signed a 5-year agreement with Ncardia to accelerate drug discovery and development, including target discovery, lead optimization, toxicity assessment, and trial design. This initiative focuses on developing iPSCs by reprogramming adult cells into an embryonic stem cell-like state capable of differentiating into any human body cell.
- October 2022: CiRA Foundation and the Cell and Gene Therapy Catapult (CGT Catapult) launched a collaborative research initiative focused on iPS cell characterization, aiming to promote the use of iPS cell technologies in regenerative medicine product development.
In-Depth Induced Pluripotent Stem Cell Therapy Industry Market Outlook
The future outlook for the Induced Pluripotent Stem Cell (iPSC) therapy industry is exceptionally promising, driven by the relentless pursuit of advanced regenerative medicine and personalized treatment strategies. Growth accelerators, including breakthroughs in gene therapy integration, improved manufacturing scalability, and supportive regulatory environments, are poised to unlock the full therapeutic potential of iPSCs. Strategic opportunities lie in expanding the therapeutic applications beyond current targets to address a wider spectrum of degenerative diseases and injuries. The increasing collaboration between key industry players and research institutions will further fuel innovation and accelerate the clinical translation of iPSC-based therapies, ultimately leading to significant advancements in patient care and a substantial expansion of the global iPSC market. The projected market size and adoption rates indicate a transformative impact on healthcare.
Induced Pluripotent Stem Cell Therapy Industry Segmentation
-
1. Derived Cell Type
- 1.1. Hepatocytes
- 1.2. Fibroblasts
- 1.3. Keratinocytes
- 1.4. Neurons
- 1.5. Others
-
2. Application
- 2.1. Drug Development
- 2.2. Regenerative Medicine
- 2.3. Toxicity Testing
- 2.4. Tissue Engineering
- 2.5. Cell Therapy
- 2.6. Disease Modeling
-
3. End User
- 3.1. Research Institutions
- 3.2. Other End Users
Induced Pluripotent Stem Cell Therapy Industry Segmentation By Geography
-
1. North America
- 1.1. United States
- 1.2. Canada
- 1.3. Mexico
-
2. Europe
- 2.1. Germany
- 2.2. United Kingdom
- 2.3. France
- 2.4. Italy
- 2.5. Spain
- 2.6. Rest of Europe
-
3. Asia Pacific
- 3.1. China
- 3.2. Japan
- 3.3. India
- 3.4. Australia
- 3.5. South Korea
- 3.6. Rest of Asia Pacific
-
4. Middle East and Africa
- 4.1. GCC
- 4.2. South Africa
- 4.3. Rest of Middle East and Africa
-
5. South America
- 5.1. Brazil
- 5.2. Argentina
- 5.3. Rest of South America
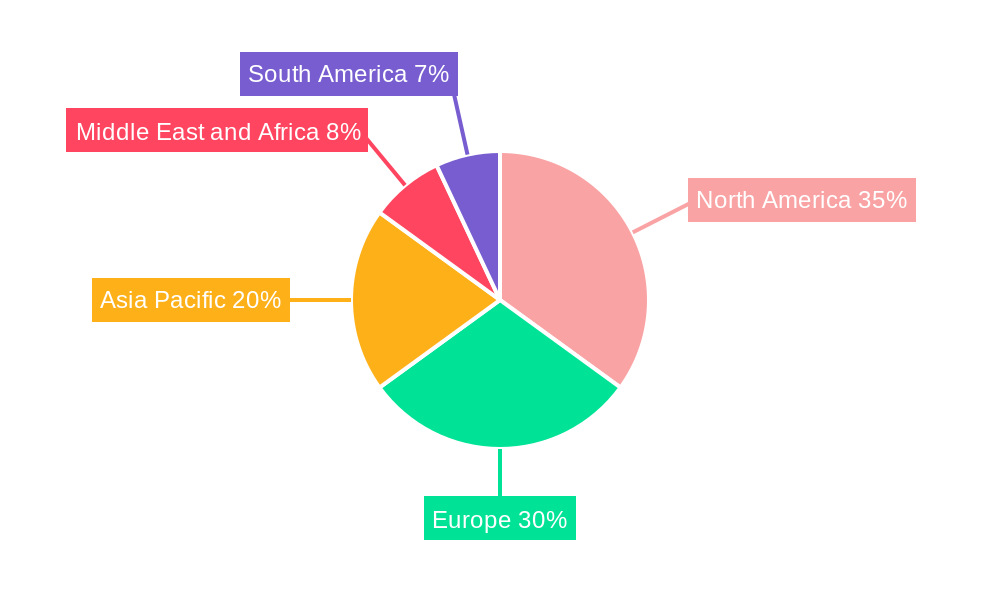
Induced Pluripotent Stem Cell Therapy Industry Regional Market Share
Geographic Coverage of Induced Pluripotent Stem Cell Therapy Industry
Induced Pluripotent Stem Cell Therapy Industry REPORT HIGHLIGHTS
| Aspects | Details |
|---|---|
| Study Period | 2020-2034 |
| Base Year | 2025 |
| Estimated Year | 2026 |
| Forecast Period | 2026-2034 |
| Historical Period | 2020-2025 |
| Growth Rate | CAGR of 10.10% from 2020-2034 |
| Segmentation |
|
Table of Contents
- 1. Introduction
- 1.1. Research Scope
- 1.2. Market Segmentation
- 1.3. Research Objective
- 1.4. Definitions and Assumptions
- 2. Executive Summary
- 2.1. Market Snapshot
- 3. Market Dynamics
- 3.1. Market Drivers
- 3.2. Market Restrains
- 3.3. Market Trends
- 3.4. Market Opportunities
- 4. Market Factor Analysis
- 4.1. Porters Five Forces
- 4.1.1. Bargaining Power of Suppliers
- 4.1.2. Bargaining Power of Buyers
- 4.1.3. Threat of New Entrants
- 4.1.4. Threat of Substitutes
- 4.1.5. Competitive Rivalry
- 4.2. PESTEL analysis
- 4.3. BCG Analysis
- 4.3.1. Stars (High Growth, High Market Share)
- 4.3.2. Cash Cows (Low Growth, High Market Share)
- 4.3.3. Question Mark (High Growth, Low Market Share)
- 4.3.4. Dogs (Low Growth, Low Market Share)
- 4.4. Ansoff Matrix Analysis
- 4.5. Supply Chain Analysis
- 4.6. Regulatory Landscape
- 4.7. Current Market Potential and Opportunity Assessment (TAM–SAM–SOM Framework)
- 4.8. VDR Analyst Note
- 4.1. Porters Five Forces
- 5. Market Analysis, Insights and Forecast 2021-2033
- 5.1. Market Analysis, Insights and Forecast - by Derived Cell Type
- 5.1.1. Hepatocytes
- 5.1.2. Fibroblasts
- 5.1.3. Keratinocytes
- 5.1.4. Neurons
- 5.1.5. Others
- 5.2. Market Analysis, Insights and Forecast - by Application
- 5.2.1. Drug Development
- 5.2.2. Regenerative Medicine
- 5.2.3. Toxicity Testing
- 5.2.4. Tissue Engineering
- 5.2.5. Cell Therapy
- 5.2.6. Disease Modeling
- 5.3. Market Analysis, Insights and Forecast - by End User
- 5.3.1. Research Institutions
- 5.3.2. Other End Users
- 5.4. Market Analysis, Insights and Forecast - by Region
- 5.4.1. North America
- 5.4.2. Europe
- 5.4.3. Asia Pacific
- 5.4.4. Middle East and Africa
- 5.4.5. South America
- 5.1. Market Analysis, Insights and Forecast - by Derived Cell Type
- 6. Global Induced Pluripotent Stem Cell Therapy Industry Analysis, Insights and Forecast, 2021-2033
- 6.1. Market Analysis, Insights and Forecast - by Derived Cell Type
- 6.1.1. Hepatocytes
- 6.1.2. Fibroblasts
- 6.1.3. Keratinocytes
- 6.1.4. Neurons
- 6.1.5. Others
- 6.2. Market Analysis, Insights and Forecast - by Application
- 6.2.1. Drug Development
- 6.2.2. Regenerative Medicine
- 6.2.3. Toxicity Testing
- 6.2.4. Tissue Engineering
- 6.2.5. Cell Therapy
- 6.2.6. Disease Modeling
- 6.3. Market Analysis, Insights and Forecast - by End User
- 6.3.1. Research Institutions
- 6.3.2. Other End Users
- 6.1. Market Analysis, Insights and Forecast - by Derived Cell Type
- 7. North America Induced Pluripotent Stem Cell Therapy Industry Analysis, Insights and Forecast, 2021-2033
- 7.1. Market Analysis, Insights and Forecast - by Derived Cell Type
- 7.1.1. Hepatocytes
- 7.1.2. Fibroblasts
- 7.1.3. Keratinocytes
- 7.1.4. Neurons
- 7.1.5. Others
- 7.2. Market Analysis, Insights and Forecast - by Application
- 7.2.1. Drug Development
- 7.2.2. Regenerative Medicine
- 7.2.3. Toxicity Testing
- 7.2.4. Tissue Engineering
- 7.2.5. Cell Therapy
- 7.2.6. Disease Modeling
- 7.3. Market Analysis, Insights and Forecast - by End User
- 7.3.1. Research Institutions
- 7.3.2. Other End Users
- 7.1. Market Analysis, Insights and Forecast - by Derived Cell Type
- 8. Europe Induced Pluripotent Stem Cell Therapy Industry Analysis, Insights and Forecast, 2021-2033
- 8.1. Market Analysis, Insights and Forecast - by Derived Cell Type
- 8.1.1. Hepatocytes
- 8.1.2. Fibroblasts
- 8.1.3. Keratinocytes
- 8.1.4. Neurons
- 8.1.5. Others
- 8.2. Market Analysis, Insights and Forecast - by Application
- 8.2.1. Drug Development
- 8.2.2. Regenerative Medicine
- 8.2.3. Toxicity Testing
- 8.2.4. Tissue Engineering
- 8.2.5. Cell Therapy
- 8.2.6. Disease Modeling
- 8.3. Market Analysis, Insights and Forecast - by End User
- 8.3.1. Research Institutions
- 8.3.2. Other End Users
- 8.1. Market Analysis, Insights and Forecast - by Derived Cell Type
- 9. Asia Pacific Induced Pluripotent Stem Cell Therapy Industry Analysis, Insights and Forecast, 2021-2033
- 9.1. Market Analysis, Insights and Forecast - by Derived Cell Type
- 9.1.1. Hepatocytes
- 9.1.2. Fibroblasts
- 9.1.3. Keratinocytes
- 9.1.4. Neurons
- 9.1.5. Others
- 9.2. Market Analysis, Insights and Forecast - by Application
- 9.2.1. Drug Development
- 9.2.2. Regenerative Medicine
- 9.2.3. Toxicity Testing
- 9.2.4. Tissue Engineering
- 9.2.5. Cell Therapy
- 9.2.6. Disease Modeling
- 9.3. Market Analysis, Insights and Forecast - by End User
- 9.3.1. Research Institutions
- 9.3.2. Other End Users
- 9.1. Market Analysis, Insights and Forecast - by Derived Cell Type
- 10. Middle East and Africa Induced Pluripotent Stem Cell Therapy Industry Analysis, Insights and Forecast, 2021-2033
- 10.1. Market Analysis, Insights and Forecast - by Derived Cell Type
- 10.1.1. Hepatocytes
- 10.1.2. Fibroblasts
- 10.1.3. Keratinocytes
- 10.1.4. Neurons
- 10.1.5. Others
- 10.2. Market Analysis, Insights and Forecast - by Application
- 10.2.1. Drug Development
- 10.2.2. Regenerative Medicine
- 10.2.3. Toxicity Testing
- 10.2.4. Tissue Engineering
- 10.2.5. Cell Therapy
- 10.2.6. Disease Modeling
- 10.3. Market Analysis, Insights and Forecast - by End User
- 10.3.1. Research Institutions
- 10.3.2. Other End Users
- 10.1. Market Analysis, Insights and Forecast - by Derived Cell Type
- 11. South America Induced Pluripotent Stem Cell Therapy Industry Analysis, Insights and Forecast, 2021-2033
- 11.1. Market Analysis, Insights and Forecast - by Derived Cell Type
- 11.1.1. Hepatocytes
- 11.1.2. Fibroblasts
- 11.1.3. Keratinocytes
- 11.1.4. Neurons
- 11.1.5. Others
- 11.2. Market Analysis, Insights and Forecast - by Application
- 11.2.1. Drug Development
- 11.2.2. Regenerative Medicine
- 11.2.3. Toxicity Testing
- 11.2.4. Tissue Engineering
- 11.2.5. Cell Therapy
- 11.2.6. Disease Modeling
- 11.3. Market Analysis, Insights and Forecast - by End User
- 11.3.1. Research Institutions
- 11.3.2. Other End Users
- 11.1. Market Analysis, Insights and Forecast - by Derived Cell Type
- 12. Competitive Analysis
- 12.1. Company Profiles
- 12.1.1 Cynata Therapeutics Limited
- 12.1.1.1. Company Overview
- 12.1.1.2. Products
- 12.1.1.3. Company Financials
- 12.1.1.4. SWOT Analysis
- 12.1.2 FUJIFILM Cellular Dynamics Inc
- 12.1.2.1. Company Overview
- 12.1.2.2. Products
- 12.1.2.3. Company Financials
- 12.1.2.4. SWOT Analysis
- 12.1.3 Axol Bioscience Ltd
- 12.1.3.1. Company Overview
- 12.1.3.2. Products
- 12.1.3.3. Company Financials
- 12.1.3.4. SWOT Analysis
- 12.1.4 Thermo Fisher Scientific Inc
- 12.1.4.1. Company Overview
- 12.1.4.2. Products
- 12.1.4.3. Company Financials
- 12.1.4.4. SWOT Analysis
- 12.1.5 Takara Bio Inc
- 12.1.5.1. Company Overview
- 12.1.5.2. Products
- 12.1.5.3. Company Financials
- 12.1.5.4. SWOT Analysis
- 12.1.6 REPROCELL USA Inc
- 12.1.6.1. Company Overview
- 12.1.6.2. Products
- 12.1.6.3. Company Financials
- 12.1.6.4. SWOT Analysis
- 12.1.7 LizarBio Therapeutics (Pluricell Biotech)
- 12.1.7.1. Company Overview
- 12.1.7.2. Products
- 12.1.7.3. Company Financials
- 12.1.7.4. SWOT Analysis
- 12.1.8 Fate Therapeutics Inc
- 12.1.8.1. Company Overview
- 12.1.8.2. Products
- 12.1.8.3. Company Financials
- 12.1.8.4. SWOT Analysis
- 12.1.9 Sumitomo Dainippon Pharma Co Ltd
- 12.1.9.1. Company Overview
- 12.1.9.2. Products
- 12.1.9.3. Company Financials
- 12.1.9.4. SWOT Analysis
- 12.1.10 Ncardia
- 12.1.10.1. Company Overview
- 12.1.10.2. Products
- 12.1.10.3. Company Financials
- 12.1.10.4. SWOT Analysis
- 12.1.11 ViaCyte Inc
- 12.1.11.1. Company Overview
- 12.1.11.2. Products
- 12.1.11.3. Company Financials
- 12.1.11.4. SWOT Analysis
- 12.1.12 Evotec SE
- 12.1.12.1. Company Overview
- 12.1.12.2. Products
- 12.1.12.3. Company Financials
- 12.1.12.4. SWOT Analysis
- 12.1.1 Cynata Therapeutics Limited
- 12.2. Market Entropy
- 12.2.1 Company's Key Areas Served
- 12.2.2 Recent Developments
- 12.3. Company Market Share Analysis 2025
- 12.3.1 Top 5 Companies Market Share Analysis
- 12.3.2 Top 3 Companies Market Share Analysis
- 12.4. List of Potential Customers
- 13. Research Methodology
List of Figures
- Figure 1: Global Induced Pluripotent Stem Cell Therapy Industry Revenue Breakdown (Million, %) by Region 2025 & 2033
- Figure 2: Global Induced Pluripotent Stem Cell Therapy Industry Volume Breakdown (K unit, %) by Region 2025 & 2033
- Figure 3: North America Induced Pluripotent Stem Cell Therapy Industry Revenue (Million), by Derived Cell Type 2025 & 2033
- Figure 4: North America Induced Pluripotent Stem Cell Therapy Industry Volume (K unit), by Derived Cell Type 2025 & 2033
- Figure 5: North America Induced Pluripotent Stem Cell Therapy Industry Revenue Share (%), by Derived Cell Type 2025 & 2033
- Figure 6: North America Induced Pluripotent Stem Cell Therapy Industry Volume Share (%), by Derived Cell Type 2025 & 2033
- Figure 7: North America Induced Pluripotent Stem Cell Therapy Industry Revenue (Million), by Application 2025 & 2033
- Figure 8: North America Induced Pluripotent Stem Cell Therapy Industry Volume (K unit), by Application 2025 & 2033
- Figure 9: North America Induced Pluripotent Stem Cell Therapy Industry Revenue Share (%), by Application 2025 & 2033
- Figure 10: North America Induced Pluripotent Stem Cell Therapy Industry Volume Share (%), by Application 2025 & 2033
- Figure 11: North America Induced Pluripotent Stem Cell Therapy Industry Revenue (Million), by End User 2025 & 2033
- Figure 12: North America Induced Pluripotent Stem Cell Therapy Industry Volume (K unit), by End User 2025 & 2033
- Figure 13: North America Induced Pluripotent Stem Cell Therapy Industry Revenue Share (%), by End User 2025 & 2033
- Figure 14: North America Induced Pluripotent Stem Cell Therapy Industry Volume Share (%), by End User 2025 & 2033
- Figure 15: North America Induced Pluripotent Stem Cell Therapy Industry Revenue (Million), by Country 2025 & 2033
- Figure 16: North America Induced Pluripotent Stem Cell Therapy Industry Volume (K unit), by Country 2025 & 2033
- Figure 17: North America Induced Pluripotent Stem Cell Therapy Industry Revenue Share (%), by Country 2025 & 2033
- Figure 18: North America Induced Pluripotent Stem Cell Therapy Industry Volume Share (%), by Country 2025 & 2033
- Figure 19: Europe Induced Pluripotent Stem Cell Therapy Industry Revenue (Million), by Derived Cell Type 2025 & 2033
- Figure 20: Europe Induced Pluripotent Stem Cell Therapy Industry Volume (K unit), by Derived Cell Type 2025 & 2033
- Figure 21: Europe Induced Pluripotent Stem Cell Therapy Industry Revenue Share (%), by Derived Cell Type 2025 & 2033
- Figure 22: Europe Induced Pluripotent Stem Cell Therapy Industry Volume Share (%), by Derived Cell Type 2025 & 2033
- Figure 23: Europe Induced Pluripotent Stem Cell Therapy Industry Revenue (Million), by Application 2025 & 2033
- Figure 24: Europe Induced Pluripotent Stem Cell Therapy Industry Volume (K unit), by Application 2025 & 2033
- Figure 25: Europe Induced Pluripotent Stem Cell Therapy Industry Revenue Share (%), by Application 2025 & 2033
- Figure 26: Europe Induced Pluripotent Stem Cell Therapy Industry Volume Share (%), by Application 2025 & 2033
- Figure 27: Europe Induced Pluripotent Stem Cell Therapy Industry Revenue (Million), by End User 2025 & 2033
- Figure 28: Europe Induced Pluripotent Stem Cell Therapy Industry Volume (K unit), by End User 2025 & 2033
- Figure 29: Europe Induced Pluripotent Stem Cell Therapy Industry Revenue Share (%), by End User 2025 & 2033
- Figure 30: Europe Induced Pluripotent Stem Cell Therapy Industry Volume Share (%), by End User 2025 & 2033
- Figure 31: Europe Induced Pluripotent Stem Cell Therapy Industry Revenue (Million), by Country 2025 & 2033
- Figure 32: Europe Induced Pluripotent Stem Cell Therapy Industry Volume (K unit), by Country 2025 & 2033
- Figure 33: Europe Induced Pluripotent Stem Cell Therapy Industry Revenue Share (%), by Country 2025 & 2033
- Figure 34: Europe Induced Pluripotent Stem Cell Therapy Industry Volume Share (%), by Country 2025 & 2033
- Figure 35: Asia Pacific Induced Pluripotent Stem Cell Therapy Industry Revenue (Million), by Derived Cell Type 2025 & 2033
- Figure 36: Asia Pacific Induced Pluripotent Stem Cell Therapy Industry Volume (K unit), by Derived Cell Type 2025 & 2033
- Figure 37: Asia Pacific Induced Pluripotent Stem Cell Therapy Industry Revenue Share (%), by Derived Cell Type 2025 & 2033
- Figure 38: Asia Pacific Induced Pluripotent Stem Cell Therapy Industry Volume Share (%), by Derived Cell Type 2025 & 2033
- Figure 39: Asia Pacific Induced Pluripotent Stem Cell Therapy Industry Revenue (Million), by Application 2025 & 2033
- Figure 40: Asia Pacific Induced Pluripotent Stem Cell Therapy Industry Volume (K unit), by Application 2025 & 2033
- Figure 41: Asia Pacific Induced Pluripotent Stem Cell Therapy Industry Revenue Share (%), by Application 2025 & 2033
- Figure 42: Asia Pacific Induced Pluripotent Stem Cell Therapy Industry Volume Share (%), by Application 2025 & 2033
- Figure 43: Asia Pacific Induced Pluripotent Stem Cell Therapy Industry Revenue (Million), by End User 2025 & 2033
- Figure 44: Asia Pacific Induced Pluripotent Stem Cell Therapy Industry Volume (K unit), by End User 2025 & 2033
- Figure 45: Asia Pacific Induced Pluripotent Stem Cell Therapy Industry Revenue Share (%), by End User 2025 & 2033
- Figure 46: Asia Pacific Induced Pluripotent Stem Cell Therapy Industry Volume Share (%), by End User 2025 & 2033
- Figure 47: Asia Pacific Induced Pluripotent Stem Cell Therapy Industry Revenue (Million), by Country 2025 & 2033
- Figure 48: Asia Pacific Induced Pluripotent Stem Cell Therapy Industry Volume (K unit), by Country 2025 & 2033
- Figure 49: Asia Pacific Induced Pluripotent Stem Cell Therapy Industry Revenue Share (%), by Country 2025 & 2033
- Figure 50: Asia Pacific Induced Pluripotent Stem Cell Therapy Industry Volume Share (%), by Country 2025 & 2033
- Figure 51: Middle East and Africa Induced Pluripotent Stem Cell Therapy Industry Revenue (Million), by Derived Cell Type 2025 & 2033
- Figure 52: Middle East and Africa Induced Pluripotent Stem Cell Therapy Industry Volume (K unit), by Derived Cell Type 2025 & 2033
- Figure 53: Middle East and Africa Induced Pluripotent Stem Cell Therapy Industry Revenue Share (%), by Derived Cell Type 2025 & 2033
- Figure 54: Middle East and Africa Induced Pluripotent Stem Cell Therapy Industry Volume Share (%), by Derived Cell Type 2025 & 2033
- Figure 55: Middle East and Africa Induced Pluripotent Stem Cell Therapy Industry Revenue (Million), by Application 2025 & 2033
- Figure 56: Middle East and Africa Induced Pluripotent Stem Cell Therapy Industry Volume (K unit), by Application 2025 & 2033
- Figure 57: Middle East and Africa Induced Pluripotent Stem Cell Therapy Industry Revenue Share (%), by Application 2025 & 2033
- Figure 58: Middle East and Africa Induced Pluripotent Stem Cell Therapy Industry Volume Share (%), by Application 2025 & 2033
- Figure 59: Middle East and Africa Induced Pluripotent Stem Cell Therapy Industry Revenue (Million), by End User 2025 & 2033
- Figure 60: Middle East and Africa Induced Pluripotent Stem Cell Therapy Industry Volume (K unit), by End User 2025 & 2033
- Figure 61: Middle East and Africa Induced Pluripotent Stem Cell Therapy Industry Revenue Share (%), by End User 2025 & 2033
- Figure 62: Middle East and Africa Induced Pluripotent Stem Cell Therapy Industry Volume Share (%), by End User 2025 & 2033
- Figure 63: Middle East and Africa Induced Pluripotent Stem Cell Therapy Industry Revenue (Million), by Country 2025 & 2033
- Figure 64: Middle East and Africa Induced Pluripotent Stem Cell Therapy Industry Volume (K unit), by Country 2025 & 2033
- Figure 65: Middle East and Africa Induced Pluripotent Stem Cell Therapy Industry Revenue Share (%), by Country 2025 & 2033
- Figure 66: Middle East and Africa Induced Pluripotent Stem Cell Therapy Industry Volume Share (%), by Country 2025 & 2033
- Figure 67: South America Induced Pluripotent Stem Cell Therapy Industry Revenue (Million), by Derived Cell Type 2025 & 2033
- Figure 68: South America Induced Pluripotent Stem Cell Therapy Industry Volume (K unit), by Derived Cell Type 2025 & 2033
- Figure 69: South America Induced Pluripotent Stem Cell Therapy Industry Revenue Share (%), by Derived Cell Type 2025 & 2033
- Figure 70: South America Induced Pluripotent Stem Cell Therapy Industry Volume Share (%), by Derived Cell Type 2025 & 2033
- Figure 71: South America Induced Pluripotent Stem Cell Therapy Industry Revenue (Million), by Application 2025 & 2033
- Figure 72: South America Induced Pluripotent Stem Cell Therapy Industry Volume (K unit), by Application 2025 & 2033
- Figure 73: South America Induced Pluripotent Stem Cell Therapy Industry Revenue Share (%), by Application 2025 & 2033
- Figure 74: South America Induced Pluripotent Stem Cell Therapy Industry Volume Share (%), by Application 2025 & 2033
- Figure 75: South America Induced Pluripotent Stem Cell Therapy Industry Revenue (Million), by End User 2025 & 2033
- Figure 76: South America Induced Pluripotent Stem Cell Therapy Industry Volume (K unit), by End User 2025 & 2033
- Figure 77: South America Induced Pluripotent Stem Cell Therapy Industry Revenue Share (%), by End User 2025 & 2033
- Figure 78: South America Induced Pluripotent Stem Cell Therapy Industry Volume Share (%), by End User 2025 & 2033
- Figure 79: South America Induced Pluripotent Stem Cell Therapy Industry Revenue (Million), by Country 2025 & 2033
- Figure 80: South America Induced Pluripotent Stem Cell Therapy Industry Volume (K unit), by Country 2025 & 2033
- Figure 81: South America Induced Pluripotent Stem Cell Therapy Industry Revenue Share (%), by Country 2025 & 2033
- Figure 82: South America Induced Pluripotent Stem Cell Therapy Industry Volume Share (%), by Country 2025 & 2033
List of Tables
- Table 1: Global Induced Pluripotent Stem Cell Therapy Industry Revenue Million Forecast, by Derived Cell Type 2020 & 2033
- Table 2: Global Induced Pluripotent Stem Cell Therapy Industry Volume K unit Forecast, by Derived Cell Type 2020 & 2033
- Table 3: Global Induced Pluripotent Stem Cell Therapy Industry Revenue Million Forecast, by Application 2020 & 2033
- Table 4: Global Induced Pluripotent Stem Cell Therapy Industry Volume K unit Forecast, by Application 2020 & 2033
- Table 5: Global Induced Pluripotent Stem Cell Therapy Industry Revenue Million Forecast, by End User 2020 & 2033
- Table 6: Global Induced Pluripotent Stem Cell Therapy Industry Volume K unit Forecast, by End User 2020 & 2033
- Table 7: Global Induced Pluripotent Stem Cell Therapy Industry Revenue Million Forecast, by Region 2020 & 2033
- Table 8: Global Induced Pluripotent Stem Cell Therapy Industry Volume K unit Forecast, by Region 2020 & 2033
- Table 9: Global Induced Pluripotent Stem Cell Therapy Industry Revenue Million Forecast, by Derived Cell Type 2020 & 2033
- Table 10: Global Induced Pluripotent Stem Cell Therapy Industry Volume K unit Forecast, by Derived Cell Type 2020 & 2033
- Table 11: Global Induced Pluripotent Stem Cell Therapy Industry Revenue Million Forecast, by Application 2020 & 2033
- Table 12: Global Induced Pluripotent Stem Cell Therapy Industry Volume K unit Forecast, by Application 2020 & 2033
- Table 13: Global Induced Pluripotent Stem Cell Therapy Industry Revenue Million Forecast, by End User 2020 & 2033
- Table 14: Global Induced Pluripotent Stem Cell Therapy Industry Volume K unit Forecast, by End User 2020 & 2033
- Table 15: Global Induced Pluripotent Stem Cell Therapy Industry Revenue Million Forecast, by Country 2020 & 2033
- Table 16: Global Induced Pluripotent Stem Cell Therapy Industry Volume K unit Forecast, by Country 2020 & 2033
- Table 17: United States Induced Pluripotent Stem Cell Therapy Industry Revenue (Million) Forecast, by Application 2020 & 2033
- Table 18: United States Induced Pluripotent Stem Cell Therapy Industry Volume (K unit) Forecast, by Application 2020 & 2033
- Table 19: Canada Induced Pluripotent Stem Cell Therapy Industry Revenue (Million) Forecast, by Application 2020 & 2033
- Table 20: Canada Induced Pluripotent Stem Cell Therapy Industry Volume (K unit) Forecast, by Application 2020 & 2033
- Table 21: Mexico Induced Pluripotent Stem Cell Therapy Industry Revenue (Million) Forecast, by Application 2020 & 2033
- Table 22: Mexico Induced Pluripotent Stem Cell Therapy Industry Volume (K unit) Forecast, by Application 2020 & 2033
- Table 23: Global Induced Pluripotent Stem Cell Therapy Industry Revenue Million Forecast, by Derived Cell Type 2020 & 2033
- Table 24: Global Induced Pluripotent Stem Cell Therapy Industry Volume K unit Forecast, by Derived Cell Type 2020 & 2033
- Table 25: Global Induced Pluripotent Stem Cell Therapy Industry Revenue Million Forecast, by Application 2020 & 2033
- Table 26: Global Induced Pluripotent Stem Cell Therapy Industry Volume K unit Forecast, by Application 2020 & 2033
- Table 27: Global Induced Pluripotent Stem Cell Therapy Industry Revenue Million Forecast, by End User 2020 & 2033
- Table 28: Global Induced Pluripotent Stem Cell Therapy Industry Volume K unit Forecast, by End User 2020 & 2033
- Table 29: Global Induced Pluripotent Stem Cell Therapy Industry Revenue Million Forecast, by Country 2020 & 2033
- Table 30: Global Induced Pluripotent Stem Cell Therapy Industry Volume K unit Forecast, by Country 2020 & 2033
- Table 31: Germany Induced Pluripotent Stem Cell Therapy Industry Revenue (Million) Forecast, by Application 2020 & 2033
- Table 32: Germany Induced Pluripotent Stem Cell Therapy Industry Volume (K unit) Forecast, by Application 2020 & 2033
- Table 33: United Kingdom Induced Pluripotent Stem Cell Therapy Industry Revenue (Million) Forecast, by Application 2020 & 2033
- Table 34: United Kingdom Induced Pluripotent Stem Cell Therapy Industry Volume (K unit) Forecast, by Application 2020 & 2033
- Table 35: France Induced Pluripotent Stem Cell Therapy Industry Revenue (Million) Forecast, by Application 2020 & 2033
- Table 36: France Induced Pluripotent Stem Cell Therapy Industry Volume (K unit) Forecast, by Application 2020 & 2033
- Table 37: Italy Induced Pluripotent Stem Cell Therapy Industry Revenue (Million) Forecast, by Application 2020 & 2033
- Table 38: Italy Induced Pluripotent Stem Cell Therapy Industry Volume (K unit) Forecast, by Application 2020 & 2033
- Table 39: Spain Induced Pluripotent Stem Cell Therapy Industry Revenue (Million) Forecast, by Application 2020 & 2033
- Table 40: Spain Induced Pluripotent Stem Cell Therapy Industry Volume (K unit) Forecast, by Application 2020 & 2033
- Table 41: Rest of Europe Induced Pluripotent Stem Cell Therapy Industry Revenue (Million) Forecast, by Application 2020 & 2033
- Table 42: Rest of Europe Induced Pluripotent Stem Cell Therapy Industry Volume (K unit) Forecast, by Application 2020 & 2033
- Table 43: Global Induced Pluripotent Stem Cell Therapy Industry Revenue Million Forecast, by Derived Cell Type 2020 & 2033
- Table 44: Global Induced Pluripotent Stem Cell Therapy Industry Volume K unit Forecast, by Derived Cell Type 2020 & 2033
- Table 45: Global Induced Pluripotent Stem Cell Therapy Industry Revenue Million Forecast, by Application 2020 & 2033
- Table 46: Global Induced Pluripotent Stem Cell Therapy Industry Volume K unit Forecast, by Application 2020 & 2033
- Table 47: Global Induced Pluripotent Stem Cell Therapy Industry Revenue Million Forecast, by End User 2020 & 2033
- Table 48: Global Induced Pluripotent Stem Cell Therapy Industry Volume K unit Forecast, by End User 2020 & 2033
- Table 49: Global Induced Pluripotent Stem Cell Therapy Industry Revenue Million Forecast, by Country 2020 & 2033
- Table 50: Global Induced Pluripotent Stem Cell Therapy Industry Volume K unit Forecast, by Country 2020 & 2033
- Table 51: China Induced Pluripotent Stem Cell Therapy Industry Revenue (Million) Forecast, by Application 2020 & 2033
- Table 52: China Induced Pluripotent Stem Cell Therapy Industry Volume (K unit) Forecast, by Application 2020 & 2033
- Table 53: Japan Induced Pluripotent Stem Cell Therapy Industry Revenue (Million) Forecast, by Application 2020 & 2033
- Table 54: Japan Induced Pluripotent Stem Cell Therapy Industry Volume (K unit) Forecast, by Application 2020 & 2033
- Table 55: India Induced Pluripotent Stem Cell Therapy Industry Revenue (Million) Forecast, by Application 2020 & 2033
- Table 56: India Induced Pluripotent Stem Cell Therapy Industry Volume (K unit) Forecast, by Application 2020 & 2033
- Table 57: Australia Induced Pluripotent Stem Cell Therapy Industry Revenue (Million) Forecast, by Application 2020 & 2033
- Table 58: Australia Induced Pluripotent Stem Cell Therapy Industry Volume (K unit) Forecast, by Application 2020 & 2033
- Table 59: South Korea Induced Pluripotent Stem Cell Therapy Industry Revenue (Million) Forecast, by Application 2020 & 2033
- Table 60: South Korea Induced Pluripotent Stem Cell Therapy Industry Volume (K unit) Forecast, by Application 2020 & 2033
- Table 61: Rest of Asia Pacific Induced Pluripotent Stem Cell Therapy Industry Revenue (Million) Forecast, by Application 2020 & 2033
- Table 62: Rest of Asia Pacific Induced Pluripotent Stem Cell Therapy Industry Volume (K unit) Forecast, by Application 2020 & 2033
- Table 63: Global Induced Pluripotent Stem Cell Therapy Industry Revenue Million Forecast, by Derived Cell Type 2020 & 2033
- Table 64: Global Induced Pluripotent Stem Cell Therapy Industry Volume K unit Forecast, by Derived Cell Type 2020 & 2033
- Table 65: Global Induced Pluripotent Stem Cell Therapy Industry Revenue Million Forecast, by Application 2020 & 2033
- Table 66: Global Induced Pluripotent Stem Cell Therapy Industry Volume K unit Forecast, by Application 2020 & 2033
- Table 67: Global Induced Pluripotent Stem Cell Therapy Industry Revenue Million Forecast, by End User 2020 & 2033
- Table 68: Global Induced Pluripotent Stem Cell Therapy Industry Volume K unit Forecast, by End User 2020 & 2033
- Table 69: Global Induced Pluripotent Stem Cell Therapy Industry Revenue Million Forecast, by Country 2020 & 2033
- Table 70: Global Induced Pluripotent Stem Cell Therapy Industry Volume K unit Forecast, by Country 2020 & 2033
- Table 71: GCC Induced Pluripotent Stem Cell Therapy Industry Revenue (Million) Forecast, by Application 2020 & 2033
- Table 72: GCC Induced Pluripotent Stem Cell Therapy Industry Volume (K unit) Forecast, by Application 2020 & 2033
- Table 73: South Africa Induced Pluripotent Stem Cell Therapy Industry Revenue (Million) Forecast, by Application 2020 & 2033
- Table 74: South Africa Induced Pluripotent Stem Cell Therapy Industry Volume (K unit) Forecast, by Application 2020 & 2033
- Table 75: Rest of Middle East and Africa Induced Pluripotent Stem Cell Therapy Industry Revenue (Million) Forecast, by Application 2020 & 2033
- Table 76: Rest of Middle East and Africa Induced Pluripotent Stem Cell Therapy Industry Volume (K unit) Forecast, by Application 2020 & 2033
- Table 77: Global Induced Pluripotent Stem Cell Therapy Industry Revenue Million Forecast, by Derived Cell Type 2020 & 2033
- Table 78: Global Induced Pluripotent Stem Cell Therapy Industry Volume K unit Forecast, by Derived Cell Type 2020 & 2033
- Table 79: Global Induced Pluripotent Stem Cell Therapy Industry Revenue Million Forecast, by Application 2020 & 2033
- Table 80: Global Induced Pluripotent Stem Cell Therapy Industry Volume K unit Forecast, by Application 2020 & 2033
- Table 81: Global Induced Pluripotent Stem Cell Therapy Industry Revenue Million Forecast, by End User 2020 & 2033
- Table 82: Global Induced Pluripotent Stem Cell Therapy Industry Volume K unit Forecast, by End User 2020 & 2033
- Table 83: Global Induced Pluripotent Stem Cell Therapy Industry Revenue Million Forecast, by Country 2020 & 2033
- Table 84: Global Induced Pluripotent Stem Cell Therapy Industry Volume K unit Forecast, by Country 2020 & 2033
- Table 85: Brazil Induced Pluripotent Stem Cell Therapy Industry Revenue (Million) Forecast, by Application 2020 & 2033
- Table 86: Brazil Induced Pluripotent Stem Cell Therapy Industry Volume (K unit) Forecast, by Application 2020 & 2033
- Table 87: Argentina Induced Pluripotent Stem Cell Therapy Industry Revenue (Million) Forecast, by Application 2020 & 2033
- Table 88: Argentina Induced Pluripotent Stem Cell Therapy Industry Volume (K unit) Forecast, by Application 2020 & 2033
- Table 89: Rest of South America Induced Pluripotent Stem Cell Therapy Industry Revenue (Million) Forecast, by Application 2020 & 2033
- Table 90: Rest of South America Induced Pluripotent Stem Cell Therapy Industry Volume (K unit) Forecast, by Application 2020 & 2033
Frequently Asked Questions
1. What is the projected Compound Annual Growth Rate (CAGR) of the Induced Pluripotent Stem Cell Therapy Industry?
The projected CAGR is approximately 10.10%.
2. Which companies are prominent players in the Induced Pluripotent Stem Cell Therapy Industry?
Key companies in the market include Cynata Therapeutics Limited, FUJIFILM Cellular Dynamics Inc, Axol Bioscience Ltd, Thermo Fisher Scientific Inc, Takara Bio Inc, REPROCELL USA Inc, LizarBio Therapeutics (Pluricell Biotech), Fate Therapeutics Inc, Sumitomo Dainippon Pharma Co Ltd, Ncardia, ViaCyte Inc , Evotec SE.
3. What are the main segments of the Induced Pluripotent Stem Cell Therapy Industry?
The market segments include Derived Cell Type, Application, End User.
4. Can you provide details about the market size?
The market size is estimated to be USD 1.35 Million as of 2022.
5. What are some drivers contributing to market growth?
Increase in Research and Development Activities in Stem Cells Therapies; Surge in Adoption of Personalized Medicine.
6. What are the notable trends driving market growth?
Regenerative Medicine Segment is Expected to Witness Significant Growth Over the Forecast Period.
7. Are there any restraints impacting market growth?
Lack of Awareness Regarding Stem Cell Therapies and High Cost of Treatment.
8. Can you provide examples of recent developments in the market?
In November 2022, Prepaire Labs signed a 5-year agreement with Ncardia to accelerate drug discovery and development including target discovery, lead optimization, toxicity assessment, and trial design. The new initiative assists in the development of iPSCs by reprogramming adult cells (such as skin and blood cells) into an embryonic stem cell-like state, which can differentiate into any type of human body cell.
9. What pricing options are available for accessing the report?
Pricing options include single-user, multi-user, and enterprise licenses priced at USD 4750, USD 5250, and USD 8750 respectively.
10. Is the market size provided in terms of value or volume?
The market size is provided in terms of value, measured in Million and volume, measured in K unit.
11. Are there any specific market keywords associated with the report?
Yes, the market keyword associated with the report is "Induced Pluripotent Stem Cell Therapy Industry," which aids in identifying and referencing the specific market segment covered.
12. How do I determine which pricing option suits my needs best?
The pricing options vary based on user requirements and access needs. Individual users may opt for single-user licenses, while businesses requiring broader access may choose multi-user or enterprise licenses for cost-effective access to the report.
13. Are there any additional resources or data provided in the Induced Pluripotent Stem Cell Therapy Industry report?
While the report offers comprehensive insights, it's advisable to review the specific contents or supplementary materials provided to ascertain if additional resources or data are available.
14. How can I stay updated on further developments or reports in the Induced Pluripotent Stem Cell Therapy Industry?
To stay informed about further developments, trends, and reports in the Induced Pluripotent Stem Cell Therapy Industry, consider subscribing to industry newsletters, following relevant companies and organizations, or regularly checking reputable industry news sources and publications.
Methodology
Step 1 - Identification of Relevant Samples Size from Population Database


Step 2 - Approaches for Defining Global Market Size (Value, Volume* & Price*)

Note*: In applicable scenarios
Step 3 - Data Sources
Primary Research
- Web Analytics
- Survey Reports
- Research Institute
- Latest Research Reports
- Opinion Leaders
Secondary Research
- Annual Reports
- White Paper
- Latest Press Release
- Industry Association
- Paid Database
- Investor Presentations

Step 4 - Data Triangulation
Involves using different sources of information in order to increase the validity of a study
These sources are likely to be stakeholders in a program - participants, other researchers, program staff, other community members, and so on.
Then we put all data in single framework & apply various statistical tools to find out the dynamic on the market.
During the analysis stage, feedback from the stakeholder groups would be compared to determine areas of agreement as well as areas of divergence