

Key Insights
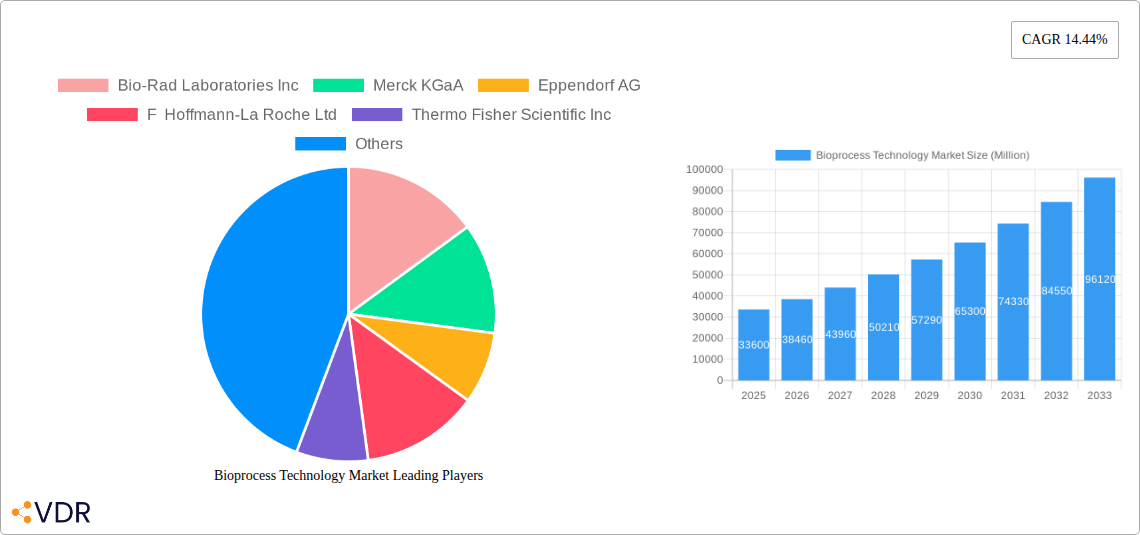
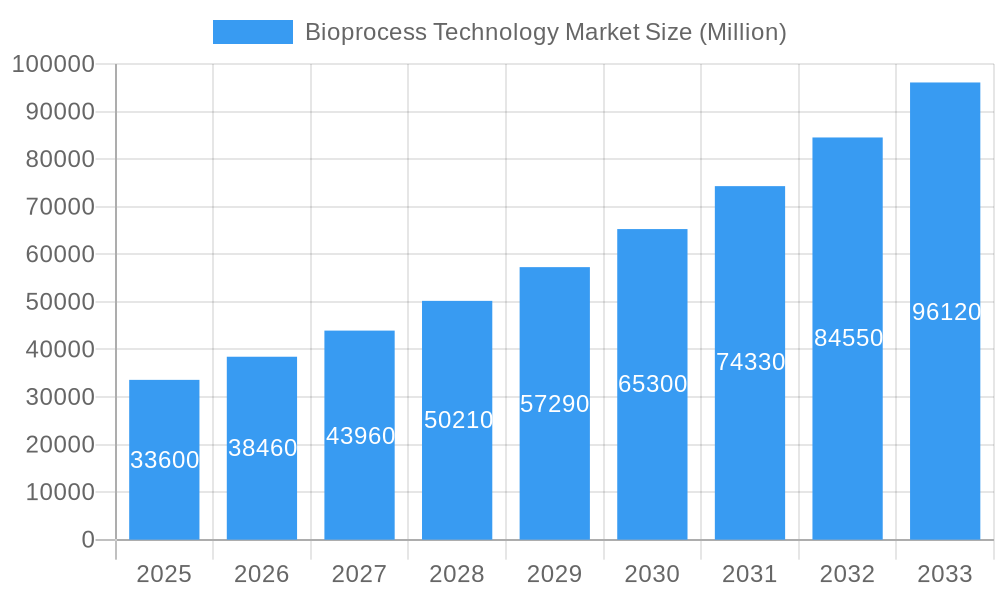
The global Bioprocess Technology Market is poised for substantial growth, currently valued at an estimated USD 33.60 billion. This robust market is projected to expand at a Compound Annual Growth Rate (CAGR) of 14.44% from 2025 to 2033, indicating a dynamic and rapidly evolving landscape. The strong demand for biopharmaceuticals, driven by the increasing prevalence of chronic diseases and the growing need for advanced therapeutics such as recombinant proteins and monoclonal antibodies, serves as a primary catalyst for this expansion. Furthermore, advancements in cell and gene therapies, alongside the expanding applications of bioprocessing in food and beverage industries, are contributing to this upward trajectory. The market is segmented by product into Instruments, Consumables and Accessories, reflecting the diverse needs of biopharmaceutical production and research.
Bioprocess Technology Market Market Size (In Billion)
The market's growth is further propelled by key drivers including continuous innovation in bioprocessing equipment, leading to enhanced efficiency and scalability, and the growing outsourcing of biopharmaceutical manufacturing to Contract Manufacturing Organizations (CMOs). Academic research institutes also play a crucial role in fostering innovation and driving demand for sophisticated bioprocess technologies. While the market presents significant opportunities, it also faces certain restraints, such as the high initial investment costs associated with advanced bioprocessing infrastructure and stringent regulatory requirements that can prolong product development cycles. North America is expected to lead the market, followed by Europe and the Asia Pacific region, with China and India demonstrating significant growth potential due to expanding biopharmaceutical R&D and manufacturing capabilities.
Bioprocess Technology Market Company Market Share
Bioprocess Technology Market: Comprehensive Report 2019-2033
Report Overview:
This in-depth analysis provides a comprehensive outlook on the global Bioprocess Technology Market, encompassing detailed market dynamics, growth trends, regional dominance, product landscapes, key drivers, emerging opportunities, and the competitive strategies of leading players. The report covers the historical period from 2019 to 2024, with the base and estimated year set for 2025, and projects market evolution through the forecast period of 2025–2033. This report is an essential resource for industry professionals seeking to understand market concentration, technological innovation drivers, regulatory frameworks, competitive landscapes, and future growth trajectories within the bioprocess technology sector. We will explore parent and child market segments to offer a nuanced perspective. All monetary values are presented in Million units.
Bioprocess Technology Market Market Dynamics & Structure
The Bioprocess Technology Market is characterized by a dynamic interplay of technological advancements, stringent regulatory oversight, and evolving end-user demands. Market concentration is moderately high, with major players like Thermo Fisher Scientific Inc., Merck KGaA, and Sartorius Group holding significant shares, driven by their extensive product portfolios and global reach. Technological innovation remains a primary driver, with continuous investment in research and development fueling the creation of advanced bioreactors, upstream and downstream processing equipment, and novel cell culture media. Regulatory frameworks, particularly Good Manufacturing Practices (GMP) and other compliance standards, shape product development and market entry, ensuring product safety and efficacy.
- Technological Innovation Drivers:
- Development of single-use bioreactor technologies for enhanced flexibility and reduced contamination risk.
- Advancements in process analytical technology (PAT) for real-time monitoring and control of bioprocesses.
- Integration of artificial intelligence (AI) and machine learning (ML) for process optimization and predictive maintenance.
- Regulatory Frameworks:
- Strict adherence to FDA, EMA, and other regional regulatory guidelines for biopharmaceutical manufacturing.
- Increasing emphasis on data integrity and digital traceability in bioprocessing.
- Competitive Product Substitutes:
- While established processes dominate, ongoing research into alternative production methods, such as cell-free synthesis and advanced fermentation techniques, presents potential future substitutes.
- End-User Demographics:
- The biopharmaceutical sector is the dominant end-user, followed by contract manufacturing organizations (CMOs) and academic research institutes, each with specific requirements and purchasing patterns.
- M&A Trends:
- Strategic mergers and acquisitions are prevalent, aimed at expanding product portfolios, enhancing technological capabilities, and consolidating market presence. For instance, companies are acquiring specialized technology providers or complementary businesses to strengthen their offerings. M&A deal volumes have seen a steady increase in the last few years, indicating consolidation and strategic expansion.
Bioprocess Technology Market Growth Trends & Insights
The global Bioprocess Technology Market is poised for robust growth, driven by the escalating demand for biologics, including recombinant proteins, monoclonal antibodies, and vaccines. The increasing prevalence of chronic diseases and the aging global population are fueling the development of novel biotherapeutic agents, thereby necessitating advanced bioprocessing solutions. Technological disruptions, such as the advent of continuous manufacturing and integrated process control systems, are significantly enhancing production efficiency and reducing manufacturing costs. Shifts in consumer behavior, including a growing preference for personalized medicine and advanced therapies, are further stimulating innovation and market expansion.
The market is expected to witness a Compound Annual Growth Rate (CAGR) of approximately 8.5% during the forecast period. This growth is attributed to several factors, including increased R&D investments in the life sciences sector, rising healthcare expenditures globally, and the expanding pipeline of biologics in clinical trials. The adoption rates for advanced bioprocess technologies are accelerating as companies strive to optimize yields, improve product quality, and ensure compliance with stringent regulatory standards.
Key growth drivers include the expansion of biopharmaceutical manufacturing capacity, particularly in emerging economies, and the growing trend of outsourcing biopharmaceutical production to CMOs. Furthermore, the development of innovative bioprocess consumables and single-use technologies is significantly reducing turnaround times and improving operational efficiency. The market penetration of advanced automation and digital solutions in bioprocessing is also on the rise, enabling seamless data management and enhanced process control. Consumer behavior shifts towards more targeted and effective treatments are spurring the demand for complex biologics, which in turn, drives the need for sophisticated bioprocess technologies. The market is also seeing a rise in the application of bioprocess technology in non-traditional areas like biofuels and industrial enzymes, indicating a diversification of demand.
Dominant Regions, Countries, or Segments in Bioprocess Technology Market
The North America region currently dominates the Bioprocess Technology Market, primarily driven by the United States. This dominance is attributed to a highly developed biopharmaceutical industry, substantial investments in life sciences research and development, and a favorable regulatory environment that encourages innovation. The presence of leading biopharmaceutical companies and research institutions, coupled with significant government funding for biotechnology, fuels the demand for advanced bioprocessing equipment and consumables.
- Dominant Segment: End-User - Biopharmaceutical Companies
- Biopharmaceutical companies represent the largest and most influential end-user segment. Their substantial R&D budgets and manufacturing needs drive the adoption of cutting-edge bioprocess technologies. The market share for this segment is estimated to be over 60%.
- Key Drivers:
- Economic Policies: Favorable R&D tax credits and government initiatives supporting the growth of the biotechnology sector.
- Infrastructure: Well-established manufacturing facilities and a robust supply chain network for bioprocessing materials.
- Innovation Hubs: Concentration of leading research institutions and biotechnology clusters fostering collaboration and knowledge transfer.
- Dominant Segment: Application - Monoclonal Antibodies (mAbs)
- Monoclonal antibodies represent a significant application driving market growth. The expanding therapeutic applications of mAbs in oncology, autoimmune diseases, and infectious diseases necessitate large-scale and efficient biomanufacturing processes. The market share for mAbs in bioprocessing applications is estimated to be around 35%.
- Dominance Factors:
- High Market Value: mAbs are high-value therapeutics, justifying significant investment in advanced bioprocessing technologies.
- Clinical Pipeline: A large and growing pipeline of mAb-based drugs in various stages of clinical development.
- Technological Advancements: Continuous improvements in cell line development, upstream fermentation, and downstream purification technologies specifically for mAb production.
- Dominant Segment: Product - Instruments
- Within the product segment, instruments, including bioreactors, centrifuges, and chromatography systems, hold a substantial market share, estimated at 55%. These instruments are critical for both upstream and downstream processing.
- Growth Potential: The demand for scalable, automated, and single-use bioreactors is a key growth driver. Investments in process intensification and continuous manufacturing further bolster the demand for advanced instrumentation.
- Other Contributing Regions: Europe, particularly Germany, the UK, and Switzerland, is another significant market, driven by a strong pharmaceutical industry and a focus on biologics manufacturing. Asia-Pacific is emerging as a rapidly growing region due to increasing investments in biopharmaceutical R&D and manufacturing capabilities, particularly in China and India.
Bioprocess Technology Market Product Landscape
The bioprocess technology product landscape is characterized by a diverse range of innovative instruments, consumables, and accessories essential for the efficient production of biopharmaceuticals. Key product categories include advanced bioreactors (stirred-tank, single-use), filtration systems, chromatography resins, cell culture media, and process analytical technologies (PAT). Innovations are focused on enhancing process control, improving yields, ensuring product purity, and enabling scalability from laboratory to commercial production. For instance, advancements in single-use bioreactor technology offer increased flexibility and reduced contamination risks, while novel chromatography media provide higher resolution and capacity for downstream purification.
Key Drivers, Barriers & Challenges in Bioprocess Technology Market
Key Drivers:
The Bioprocess Technology Market is propelled by several key drivers. The escalating global demand for biologics, including recombinant proteins and monoclonal antibodies, for treating chronic diseases and unmet medical needs is a primary catalyst. Significant investments in pharmaceutical R&D, particularly in the development of novel gene and cell therapies, further fuel market growth. Technological innovations, such as advancements in single-use systems and continuous manufacturing, are improving efficiency and reducing costs. Favorable government initiatives and funding for biotechnology research also contribute to market expansion.
Barriers & Challenges:
Despite robust growth, the market faces several challenges. High development and manufacturing costs associated with biologics can be a significant barrier. Stringent regulatory requirements for biopharmaceutical production, demanding rigorous validation and compliance, add to the complexity and timeline of market entry. Supply chain disruptions, particularly for specialized raw materials and components, can impact production continuity. Intense competition among established players and emerging startups also presents a challenge, necessitating continuous innovation and cost-effectiveness.
Emerging Opportunities in Bioprocess Technology Market
Emerging opportunities in the Bioprocess Technology Market lie in the expanding applications of bioprocessing beyond traditional pharmaceuticals. The development of biosimilars presents a significant avenue for growth, requiring cost-effective and efficient manufacturing processes. The increasing focus on personalized medicine and the production of cell and gene therapies are creating demand for highly specialized and flexible bioprocessing solutions. Furthermore, the growing interest in bio-based chemicals and biofuels offers untapped markets for bioprocess technology. The adoption of advanced digital tools, such as AI and IoT, for process optimization and data analytics also represents a substantial emerging opportunity.
Growth Accelerators in the Bioprocess Technology Market Industry
Several catalysts are accelerating the long-term growth of the Bioprocess Technology Market. Technological breakthroughs, including advancements in synthetic biology and metabolic engineering, are enabling the production of novel biomolecules with enhanced properties. Strategic partnerships and collaborations between technology providers, biopharmaceutical companies, and academic institutions are fostering innovation and accelerating product development cycles. Market expansion strategies, such as increasing manufacturing capacity in emerging economies and developing innovative business models, are also contributing to sustained growth. The increasing prevalence of chronic diseases and the aging global population will continue to drive the demand for advanced biotherapeutics.
Key Players Shaping the Bioprocess Technology Market Market
- Bio-Rad Laboratories Inc
- Merck KGaA
- Eppendorf AG
- F Hoffmann-La Roche Ltd
- Thermo Fisher Scientific Inc
- Lonza Group AG
- Danaher Corporation
- Sartorius Group
- Getinge AB
- Agilent Technologies Inc
- Advanced Instruments LLC
- ELITechgroup Inc (Gonotec Gmbh)
Notable Milestones in Bioprocess Technology Market Sector
- February 2023: Researchers from the Indian Institute of Technology (IIT) Guwahati developed a special 'Protein Toolbox,' which can be used to convert skin cells into heart cells and hence, fix a damaged heart. Known as a 'Recombinant Protein Toolbox,' it comprises six special proteins and can be used to regenerate damaged heart tissues. This development signifies advancements in regenerative medicine and the potential for novel bioprocess applications in tissue engineering.
- August 2022: Beckman Coulter Life Sciences announced a partnership with Flownamics to create an automated, online solution for bioprocess culture monitoring and control. This automated integration removes error-prone manual steps while enabling load-and-go sample runs for up to eight bioreactors, GMP compliance with electronic data management, and continuous control of viable cell density, including remote workflows. This milestone highlights the trend towards automation and real-time process control in biomanufacturing.
In-Depth Bioprocess Technology Market Market Outlook
The Bioprocess Technology Market is set for continued expansion, driven by ongoing innovation and increasing global demand for biotherapeutics. Future growth accelerators include the adoption of continuous manufacturing processes, the integration of advanced AI and machine learning for process optimization, and the development of more sophisticated single-use technologies. The growing focus on personalized medicine and the burgeoning field of cell and gene therapies will also create significant market opportunities. Strategic collaborations and the expansion of manufacturing capabilities in emerging markets are expected to further fuel market growth. The overall outlook is positive, with a strong emphasis on sustainability, efficiency, and advanced automation in biopharmaceutical production.
Bioprocess Technology Market Segmentation
-
1. Product
- 1.1. Instruments
- 1.2. Consumables and Accessories
-
2. Application
- 2.1. Recombinant Proteins
- 2.2. Monoclonal Antibodies
- 2.3. Antibiotics
- 2.4. Other Applications
-
3. End-User
- 3.1. Biopharmaceutical Companies
- 3.2. Contract Manufacturing Organizations
- 3.3. Academic Research Institute
- 3.4. Other End-Users
Bioprocess Technology Market Segmentation By Geography
-
1. North America
- 1.1. United States
- 1.2. Canada
- 1.3. Mexico
-
2. Europe
- 2.1. Germany
- 2.2. United Kingdom
- 2.3. France
- 2.4. Italy
- 2.5. Spain
- 2.6. Rest of Europe
-
3. Asia Pacific
- 3.1. China
- 3.2. Japan
- 3.3. India
- 3.4. Australia
- 3.5. South Korea
- 3.6. Rest of Asia Pacific
-
4. Middle East and Africa
- 4.1. GCC
- 4.2. South Africa
- 4.3. Rest of Middle East and Africa
-
5. South America
- 5.1. Brazil
- 5.2. Argentina
- 5.3. Rest of South America
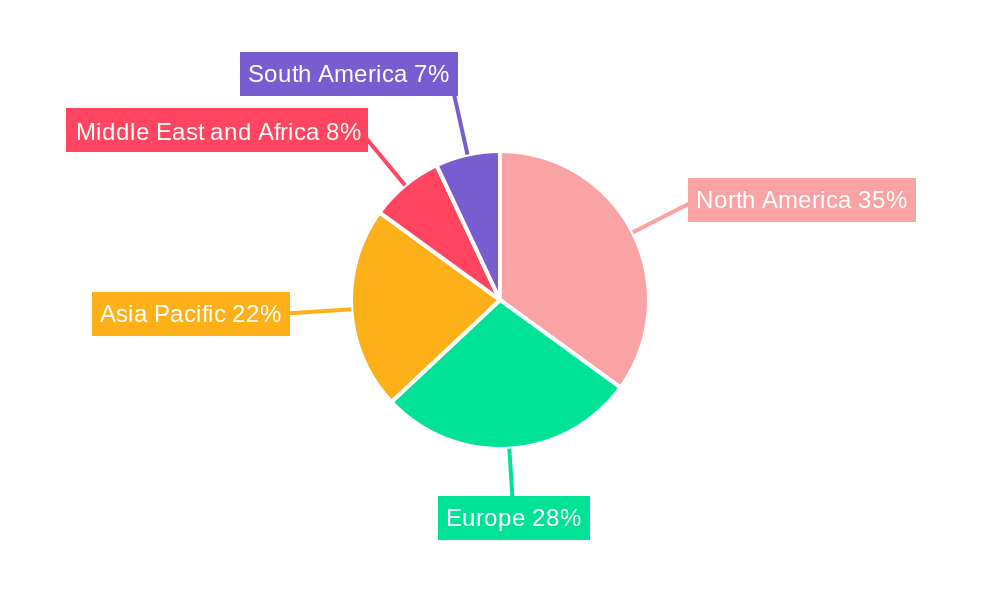
Bioprocess Technology Market Regional Market Share
Geographic Coverage of Bioprocess Technology Market
Bioprocess Technology Market REPORT HIGHLIGHTS
| Aspects | Details |
|---|---|
| Study Period | 2020-2034 |
| Base Year | 2025 |
| Estimated Year | 2026 |
| Forecast Period | 2026-2034 |
| Historical Period | 2020-2025 |
| Growth Rate | CAGR of 14.44% from 2020-2034 |
| Segmentation |
|
Table of Contents
- 1. Introduction
- 1.1. Research Scope
- 1.2. Market Segmentation
- 1.3. Research Objective
- 1.4. Definitions and Assumptions
- 2. Executive Summary
- 2.1. Market Snapshot
- 3. Market Dynamics
- 3.1. Market Drivers
- 3.2. Market Restrains
- 3.3. Market Trends
- 3.4. Market Opportunities
- 4. Market Factor Analysis
- 4.1. Porters Five Forces
- 4.1.1. Bargaining Power of Suppliers
- 4.1.2. Bargaining Power of Buyers
- 4.1.3. Threat of New Entrants
- 4.1.4. Threat of Substitutes
- 4.1.5. Competitive Rivalry
- 4.2. PESTEL analysis
- 4.3. BCG Analysis
- 4.3.1. Stars (High Growth, High Market Share)
- 4.3.2. Cash Cows (Low Growth, High Market Share)
- 4.3.3. Question Mark (High Growth, Low Market Share)
- 4.3.4. Dogs (Low Growth, Low Market Share)
- 4.4. Ansoff Matrix Analysis
- 4.5. Supply Chain Analysis
- 4.6. Regulatory Landscape
- 4.7. Current Market Potential and Opportunity Assessment (TAM–SAM–SOM Framework)
- 4.8. VDR Analyst Note
- 4.1. Porters Five Forces
- 5. Market Analysis, Insights and Forecast 2021-2033
- 5.1. Market Analysis, Insights and Forecast - by Product
- 5.1.1. Instruments
- 5.1.2. Consumables and Accessories
- 5.2. Market Analysis, Insights and Forecast - by Application
- 5.2.1. Recombinant Proteins
- 5.2.2. Monoclonal Antibodies
- 5.2.3. Antibiotics
- 5.2.4. Other Applications
- 5.3. Market Analysis, Insights and Forecast - by End-User
- 5.3.1. Biopharmaceutical Companies
- 5.3.2. Contract Manufacturing Organizations
- 5.3.3. Academic Research Institute
- 5.3.4. Other End-Users
- 5.4. Market Analysis, Insights and Forecast - by Region
- 5.4.1. North America
- 5.4.2. Europe
- 5.4.3. Asia Pacific
- 5.4.4. Middle East and Africa
- 5.4.5. South America
- 5.1. Market Analysis, Insights and Forecast - by Product
- 6. Global Bioprocess Technology Market Analysis, Insights and Forecast, 2021-2033
- 6.1. Market Analysis, Insights and Forecast - by Product
- 6.1.1. Instruments
- 6.1.2. Consumables and Accessories
- 6.2. Market Analysis, Insights and Forecast - by Application
- 6.2.1. Recombinant Proteins
- 6.2.2. Monoclonal Antibodies
- 6.2.3. Antibiotics
- 6.2.4. Other Applications
- 6.3. Market Analysis, Insights and Forecast - by End-User
- 6.3.1. Biopharmaceutical Companies
- 6.3.2. Contract Manufacturing Organizations
- 6.3.3. Academic Research Institute
- 6.3.4. Other End-Users
- 6.1. Market Analysis, Insights and Forecast - by Product
- 7. North America Bioprocess Technology Market Analysis, Insights and Forecast, 2021-2033
- 7.1. Market Analysis, Insights and Forecast - by Product
- 7.1.1. Instruments
- 7.1.2. Consumables and Accessories
- 7.2. Market Analysis, Insights and Forecast - by Application
- 7.2.1. Recombinant Proteins
- 7.2.2. Monoclonal Antibodies
- 7.2.3. Antibiotics
- 7.2.4. Other Applications
- 7.3. Market Analysis, Insights and Forecast - by End-User
- 7.3.1. Biopharmaceutical Companies
- 7.3.2. Contract Manufacturing Organizations
- 7.3.3. Academic Research Institute
- 7.3.4. Other End-Users
- 7.1. Market Analysis, Insights and Forecast - by Product
- 8. Europe Bioprocess Technology Market Analysis, Insights and Forecast, 2021-2033
- 8.1. Market Analysis, Insights and Forecast - by Product
- 8.1.1. Instruments
- 8.1.2. Consumables and Accessories
- 8.2. Market Analysis, Insights and Forecast - by Application
- 8.2.1. Recombinant Proteins
- 8.2.2. Monoclonal Antibodies
- 8.2.3. Antibiotics
- 8.2.4. Other Applications
- 8.3. Market Analysis, Insights and Forecast - by End-User
- 8.3.1. Biopharmaceutical Companies
- 8.3.2. Contract Manufacturing Organizations
- 8.3.3. Academic Research Institute
- 8.3.4. Other End-Users
- 8.1. Market Analysis, Insights and Forecast - by Product
- 9. Asia Pacific Bioprocess Technology Market Analysis, Insights and Forecast, 2021-2033
- 9.1. Market Analysis, Insights and Forecast - by Product
- 9.1.1. Instruments
- 9.1.2. Consumables and Accessories
- 9.2. Market Analysis, Insights and Forecast - by Application
- 9.2.1. Recombinant Proteins
- 9.2.2. Monoclonal Antibodies
- 9.2.3. Antibiotics
- 9.2.4. Other Applications
- 9.3. Market Analysis, Insights and Forecast - by End-User
- 9.3.1. Biopharmaceutical Companies
- 9.3.2. Contract Manufacturing Organizations
- 9.3.3. Academic Research Institute
- 9.3.4. Other End-Users
- 9.1. Market Analysis, Insights and Forecast - by Product
- 10. Middle East and Africa Bioprocess Technology Market Analysis, Insights and Forecast, 2021-2033
- 10.1. Market Analysis, Insights and Forecast - by Product
- 10.1.1. Instruments
- 10.1.2. Consumables and Accessories
- 10.2. Market Analysis, Insights and Forecast - by Application
- 10.2.1. Recombinant Proteins
- 10.2.2. Monoclonal Antibodies
- 10.2.3. Antibiotics
- 10.2.4. Other Applications
- 10.3. Market Analysis, Insights and Forecast - by End-User
- 10.3.1. Biopharmaceutical Companies
- 10.3.2. Contract Manufacturing Organizations
- 10.3.3. Academic Research Institute
- 10.3.4. Other End-Users
- 10.1. Market Analysis, Insights and Forecast - by Product
- 11. South America Bioprocess Technology Market Analysis, Insights and Forecast, 2021-2033
- 11.1. Market Analysis, Insights and Forecast - by Product
- 11.1.1. Instruments
- 11.1.2. Consumables and Accessories
- 11.2. Market Analysis, Insights and Forecast - by Application
- 11.2.1. Recombinant Proteins
- 11.2.2. Monoclonal Antibodies
- 11.2.3. Antibiotics
- 11.2.4. Other Applications
- 11.3. Market Analysis, Insights and Forecast - by End-User
- 11.3.1. Biopharmaceutical Companies
- 11.3.2. Contract Manufacturing Organizations
- 11.3.3. Academic Research Institute
- 11.3.4. Other End-Users
- 11.1. Market Analysis, Insights and Forecast - by Product
- 12. Competitive Analysis
- 12.1. Company Profiles
- 12.1.1 Bio-Rad Laboratories Inc
- 12.1.1.1. Company Overview
- 12.1.1.2. Products
- 12.1.1.3. Company Financials
- 12.1.1.4. SWOT Analysis
- 12.1.2 Merck KGaA
- 12.1.2.1. Company Overview
- 12.1.2.2. Products
- 12.1.2.3. Company Financials
- 12.1.2.4. SWOT Analysis
- 12.1.3 Eppendorf AG
- 12.1.3.1. Company Overview
- 12.1.3.2. Products
- 12.1.3.3. Company Financials
- 12.1.3.4. SWOT Analysis
- 12.1.4 F Hoffmann-La Roche Ltd
- 12.1.4.1. Company Overview
- 12.1.4.2. Products
- 12.1.4.3. Company Financials
- 12.1.4.4. SWOT Analysis
- 12.1.5 Thermo Fisher Scientific Inc
- 12.1.5.1. Company Overview
- 12.1.5.2. Products
- 12.1.5.3. Company Financials
- 12.1.5.4. SWOT Analysis
- 12.1.6 Lonza Group AG
- 12.1.6.1. Company Overview
- 12.1.6.2. Products
- 12.1.6.3. Company Financials
- 12.1.6.4. SWOT Analysis
- 12.1.7 Danaher Corporation
- 12.1.7.1. Company Overview
- 12.1.7.2. Products
- 12.1.7.3. Company Financials
- 12.1.7.4. SWOT Analysis
- 12.1.8 Sartorius Group
- 12.1.8.1. Company Overview
- 12.1.8.2. Products
- 12.1.8.3. Company Financials
- 12.1.8.4. SWOT Analysis
- 12.1.9 Getinge AB
- 12.1.9.1. Company Overview
- 12.1.9.2. Products
- 12.1.9.3. Company Financials
- 12.1.9.4. SWOT Analysis
- 12.1.10 Agilent Technologies Inc
- 12.1.10.1. Company Overview
- 12.1.10.2. Products
- 12.1.10.3. Company Financials
- 12.1.10.4. SWOT Analysis
- 12.1.11 Advanced Instruments LLC
- 12.1.11.1. Company Overview
- 12.1.11.2. Products
- 12.1.11.3. Company Financials
- 12.1.11.4. SWOT Analysis
- 12.1.12 ELITechgroup Inc (Gonotec Gmbh)
- 12.1.12.1. Company Overview
- 12.1.12.2. Products
- 12.1.12.3. Company Financials
- 12.1.12.4. SWOT Analysis
- 12.1.1 Bio-Rad Laboratories Inc
- 12.2. Market Entropy
- 12.2.1 Company's Key Areas Served
- 12.2.2 Recent Developments
- 12.3. Company Market Share Analysis 2025
- 12.3.1 Top 5 Companies Market Share Analysis
- 12.3.2 Top 3 Companies Market Share Analysis
- 12.4. List of Potential Customers
- 13. Research Methodology
List of Figures
- Figure 1: Global Bioprocess Technology Market Revenue Breakdown (Million, %) by Region 2025 & 2033
- Figure 2: Global Bioprocess Technology Market Volume Breakdown (K Unit, %) by Region 2025 & 2033
- Figure 3: North America Bioprocess Technology Market Revenue (Million), by Product 2025 & 2033
- Figure 4: North America Bioprocess Technology Market Volume (K Unit), by Product 2025 & 2033
- Figure 5: North America Bioprocess Technology Market Revenue Share (%), by Product 2025 & 2033
- Figure 6: North America Bioprocess Technology Market Volume Share (%), by Product 2025 & 2033
- Figure 7: North America Bioprocess Technology Market Revenue (Million), by Application 2025 & 2033
- Figure 8: North America Bioprocess Technology Market Volume (K Unit), by Application 2025 & 2033
- Figure 9: North America Bioprocess Technology Market Revenue Share (%), by Application 2025 & 2033
- Figure 10: North America Bioprocess Technology Market Volume Share (%), by Application 2025 & 2033
- Figure 11: North America Bioprocess Technology Market Revenue (Million), by End-User 2025 & 2033
- Figure 12: North America Bioprocess Technology Market Volume (K Unit), by End-User 2025 & 2033
- Figure 13: North America Bioprocess Technology Market Revenue Share (%), by End-User 2025 & 2033
- Figure 14: North America Bioprocess Technology Market Volume Share (%), by End-User 2025 & 2033
- Figure 15: North America Bioprocess Technology Market Revenue (Million), by Country 2025 & 2033
- Figure 16: North America Bioprocess Technology Market Volume (K Unit), by Country 2025 & 2033
- Figure 17: North America Bioprocess Technology Market Revenue Share (%), by Country 2025 & 2033
- Figure 18: North America Bioprocess Technology Market Volume Share (%), by Country 2025 & 2033
- Figure 19: Europe Bioprocess Technology Market Revenue (Million), by Product 2025 & 2033
- Figure 20: Europe Bioprocess Technology Market Volume (K Unit), by Product 2025 & 2033
- Figure 21: Europe Bioprocess Technology Market Revenue Share (%), by Product 2025 & 2033
- Figure 22: Europe Bioprocess Technology Market Volume Share (%), by Product 2025 & 2033
- Figure 23: Europe Bioprocess Technology Market Revenue (Million), by Application 2025 & 2033
- Figure 24: Europe Bioprocess Technology Market Volume (K Unit), by Application 2025 & 2033
- Figure 25: Europe Bioprocess Technology Market Revenue Share (%), by Application 2025 & 2033
- Figure 26: Europe Bioprocess Technology Market Volume Share (%), by Application 2025 & 2033
- Figure 27: Europe Bioprocess Technology Market Revenue (Million), by End-User 2025 & 2033
- Figure 28: Europe Bioprocess Technology Market Volume (K Unit), by End-User 2025 & 2033
- Figure 29: Europe Bioprocess Technology Market Revenue Share (%), by End-User 2025 & 2033
- Figure 30: Europe Bioprocess Technology Market Volume Share (%), by End-User 2025 & 2033
- Figure 31: Europe Bioprocess Technology Market Revenue (Million), by Country 2025 & 2033
- Figure 32: Europe Bioprocess Technology Market Volume (K Unit), by Country 2025 & 2033
- Figure 33: Europe Bioprocess Technology Market Revenue Share (%), by Country 2025 & 2033
- Figure 34: Europe Bioprocess Technology Market Volume Share (%), by Country 2025 & 2033
- Figure 35: Asia Pacific Bioprocess Technology Market Revenue (Million), by Product 2025 & 2033
- Figure 36: Asia Pacific Bioprocess Technology Market Volume (K Unit), by Product 2025 & 2033
- Figure 37: Asia Pacific Bioprocess Technology Market Revenue Share (%), by Product 2025 & 2033
- Figure 38: Asia Pacific Bioprocess Technology Market Volume Share (%), by Product 2025 & 2033
- Figure 39: Asia Pacific Bioprocess Technology Market Revenue (Million), by Application 2025 & 2033
- Figure 40: Asia Pacific Bioprocess Technology Market Volume (K Unit), by Application 2025 & 2033
- Figure 41: Asia Pacific Bioprocess Technology Market Revenue Share (%), by Application 2025 & 2033
- Figure 42: Asia Pacific Bioprocess Technology Market Volume Share (%), by Application 2025 & 2033
- Figure 43: Asia Pacific Bioprocess Technology Market Revenue (Million), by End-User 2025 & 2033
- Figure 44: Asia Pacific Bioprocess Technology Market Volume (K Unit), by End-User 2025 & 2033
- Figure 45: Asia Pacific Bioprocess Technology Market Revenue Share (%), by End-User 2025 & 2033
- Figure 46: Asia Pacific Bioprocess Technology Market Volume Share (%), by End-User 2025 & 2033
- Figure 47: Asia Pacific Bioprocess Technology Market Revenue (Million), by Country 2025 & 2033
- Figure 48: Asia Pacific Bioprocess Technology Market Volume (K Unit), by Country 2025 & 2033
- Figure 49: Asia Pacific Bioprocess Technology Market Revenue Share (%), by Country 2025 & 2033
- Figure 50: Asia Pacific Bioprocess Technology Market Volume Share (%), by Country 2025 & 2033
- Figure 51: Middle East and Africa Bioprocess Technology Market Revenue (Million), by Product 2025 & 2033
- Figure 52: Middle East and Africa Bioprocess Technology Market Volume (K Unit), by Product 2025 & 2033
- Figure 53: Middle East and Africa Bioprocess Technology Market Revenue Share (%), by Product 2025 & 2033
- Figure 54: Middle East and Africa Bioprocess Technology Market Volume Share (%), by Product 2025 & 2033
- Figure 55: Middle East and Africa Bioprocess Technology Market Revenue (Million), by Application 2025 & 2033
- Figure 56: Middle East and Africa Bioprocess Technology Market Volume (K Unit), by Application 2025 & 2033
- Figure 57: Middle East and Africa Bioprocess Technology Market Revenue Share (%), by Application 2025 & 2033
- Figure 58: Middle East and Africa Bioprocess Technology Market Volume Share (%), by Application 2025 & 2033
- Figure 59: Middle East and Africa Bioprocess Technology Market Revenue (Million), by End-User 2025 & 2033
- Figure 60: Middle East and Africa Bioprocess Technology Market Volume (K Unit), by End-User 2025 & 2033
- Figure 61: Middle East and Africa Bioprocess Technology Market Revenue Share (%), by End-User 2025 & 2033
- Figure 62: Middle East and Africa Bioprocess Technology Market Volume Share (%), by End-User 2025 & 2033
- Figure 63: Middle East and Africa Bioprocess Technology Market Revenue (Million), by Country 2025 & 2033
- Figure 64: Middle East and Africa Bioprocess Technology Market Volume (K Unit), by Country 2025 & 2033
- Figure 65: Middle East and Africa Bioprocess Technology Market Revenue Share (%), by Country 2025 & 2033
- Figure 66: Middle East and Africa Bioprocess Technology Market Volume Share (%), by Country 2025 & 2033
- Figure 67: South America Bioprocess Technology Market Revenue (Million), by Product 2025 & 2033
- Figure 68: South America Bioprocess Technology Market Volume (K Unit), by Product 2025 & 2033
- Figure 69: South America Bioprocess Technology Market Revenue Share (%), by Product 2025 & 2033
- Figure 70: South America Bioprocess Technology Market Volume Share (%), by Product 2025 & 2033
- Figure 71: South America Bioprocess Technology Market Revenue (Million), by Application 2025 & 2033
- Figure 72: South America Bioprocess Technology Market Volume (K Unit), by Application 2025 & 2033
- Figure 73: South America Bioprocess Technology Market Revenue Share (%), by Application 2025 & 2033
- Figure 74: South America Bioprocess Technology Market Volume Share (%), by Application 2025 & 2033
- Figure 75: South America Bioprocess Technology Market Revenue (Million), by End-User 2025 & 2033
- Figure 76: South America Bioprocess Technology Market Volume (K Unit), by End-User 2025 & 2033
- Figure 77: South America Bioprocess Technology Market Revenue Share (%), by End-User 2025 & 2033
- Figure 78: South America Bioprocess Technology Market Volume Share (%), by End-User 2025 & 2033
- Figure 79: South America Bioprocess Technology Market Revenue (Million), by Country 2025 & 2033
- Figure 80: South America Bioprocess Technology Market Volume (K Unit), by Country 2025 & 2033
- Figure 81: South America Bioprocess Technology Market Revenue Share (%), by Country 2025 & 2033
- Figure 82: South America Bioprocess Technology Market Volume Share (%), by Country 2025 & 2033
List of Tables
- Table 1: Global Bioprocess Technology Market Revenue Million Forecast, by Product 2020 & 2033
- Table 2: Global Bioprocess Technology Market Volume K Unit Forecast, by Product 2020 & 2033
- Table 3: Global Bioprocess Technology Market Revenue Million Forecast, by Application 2020 & 2033
- Table 4: Global Bioprocess Technology Market Volume K Unit Forecast, by Application 2020 & 2033
- Table 5: Global Bioprocess Technology Market Revenue Million Forecast, by End-User 2020 & 2033
- Table 6: Global Bioprocess Technology Market Volume K Unit Forecast, by End-User 2020 & 2033
- Table 7: Global Bioprocess Technology Market Revenue Million Forecast, by Region 2020 & 2033
- Table 8: Global Bioprocess Technology Market Volume K Unit Forecast, by Region 2020 & 2033
- Table 9: Global Bioprocess Technology Market Revenue Million Forecast, by Product 2020 & 2033
- Table 10: Global Bioprocess Technology Market Volume K Unit Forecast, by Product 2020 & 2033
- Table 11: Global Bioprocess Technology Market Revenue Million Forecast, by Application 2020 & 2033
- Table 12: Global Bioprocess Technology Market Volume K Unit Forecast, by Application 2020 & 2033
- Table 13: Global Bioprocess Technology Market Revenue Million Forecast, by End-User 2020 & 2033
- Table 14: Global Bioprocess Technology Market Volume K Unit Forecast, by End-User 2020 & 2033
- Table 15: Global Bioprocess Technology Market Revenue Million Forecast, by Country 2020 & 2033
- Table 16: Global Bioprocess Technology Market Volume K Unit Forecast, by Country 2020 & 2033
- Table 17: United States Bioprocess Technology Market Revenue (Million) Forecast, by Application 2020 & 2033
- Table 18: United States Bioprocess Technology Market Volume (K Unit) Forecast, by Application 2020 & 2033
- Table 19: Canada Bioprocess Technology Market Revenue (Million) Forecast, by Application 2020 & 2033
- Table 20: Canada Bioprocess Technology Market Volume (K Unit) Forecast, by Application 2020 & 2033
- Table 21: Mexico Bioprocess Technology Market Revenue (Million) Forecast, by Application 2020 & 2033
- Table 22: Mexico Bioprocess Technology Market Volume (K Unit) Forecast, by Application 2020 & 2033
- Table 23: Global Bioprocess Technology Market Revenue Million Forecast, by Product 2020 & 2033
- Table 24: Global Bioprocess Technology Market Volume K Unit Forecast, by Product 2020 & 2033
- Table 25: Global Bioprocess Technology Market Revenue Million Forecast, by Application 2020 & 2033
- Table 26: Global Bioprocess Technology Market Volume K Unit Forecast, by Application 2020 & 2033
- Table 27: Global Bioprocess Technology Market Revenue Million Forecast, by End-User 2020 & 2033
- Table 28: Global Bioprocess Technology Market Volume K Unit Forecast, by End-User 2020 & 2033
- Table 29: Global Bioprocess Technology Market Revenue Million Forecast, by Country 2020 & 2033
- Table 30: Global Bioprocess Technology Market Volume K Unit Forecast, by Country 2020 & 2033
- Table 31: Germany Bioprocess Technology Market Revenue (Million) Forecast, by Application 2020 & 2033
- Table 32: Germany Bioprocess Technology Market Volume (K Unit) Forecast, by Application 2020 & 2033
- Table 33: United Kingdom Bioprocess Technology Market Revenue (Million) Forecast, by Application 2020 & 2033
- Table 34: United Kingdom Bioprocess Technology Market Volume (K Unit) Forecast, by Application 2020 & 2033
- Table 35: France Bioprocess Technology Market Revenue (Million) Forecast, by Application 2020 & 2033
- Table 36: France Bioprocess Technology Market Volume (K Unit) Forecast, by Application 2020 & 2033
- Table 37: Italy Bioprocess Technology Market Revenue (Million) Forecast, by Application 2020 & 2033
- Table 38: Italy Bioprocess Technology Market Volume (K Unit) Forecast, by Application 2020 & 2033
- Table 39: Spain Bioprocess Technology Market Revenue (Million) Forecast, by Application 2020 & 2033
- Table 40: Spain Bioprocess Technology Market Volume (K Unit) Forecast, by Application 2020 & 2033
- Table 41: Rest of Europe Bioprocess Technology Market Revenue (Million) Forecast, by Application 2020 & 2033
- Table 42: Rest of Europe Bioprocess Technology Market Volume (K Unit) Forecast, by Application 2020 & 2033
- Table 43: Global Bioprocess Technology Market Revenue Million Forecast, by Product 2020 & 2033
- Table 44: Global Bioprocess Technology Market Volume K Unit Forecast, by Product 2020 & 2033
- Table 45: Global Bioprocess Technology Market Revenue Million Forecast, by Application 2020 & 2033
- Table 46: Global Bioprocess Technology Market Volume K Unit Forecast, by Application 2020 & 2033
- Table 47: Global Bioprocess Technology Market Revenue Million Forecast, by End-User 2020 & 2033
- Table 48: Global Bioprocess Technology Market Volume K Unit Forecast, by End-User 2020 & 2033
- Table 49: Global Bioprocess Technology Market Revenue Million Forecast, by Country 2020 & 2033
- Table 50: Global Bioprocess Technology Market Volume K Unit Forecast, by Country 2020 & 2033
- Table 51: China Bioprocess Technology Market Revenue (Million) Forecast, by Application 2020 & 2033
- Table 52: China Bioprocess Technology Market Volume (K Unit) Forecast, by Application 2020 & 2033
- Table 53: Japan Bioprocess Technology Market Revenue (Million) Forecast, by Application 2020 & 2033
- Table 54: Japan Bioprocess Technology Market Volume (K Unit) Forecast, by Application 2020 & 2033
- Table 55: India Bioprocess Technology Market Revenue (Million) Forecast, by Application 2020 & 2033
- Table 56: India Bioprocess Technology Market Volume (K Unit) Forecast, by Application 2020 & 2033
- Table 57: Australia Bioprocess Technology Market Revenue (Million) Forecast, by Application 2020 & 2033
- Table 58: Australia Bioprocess Technology Market Volume (K Unit) Forecast, by Application 2020 & 2033
- Table 59: South Korea Bioprocess Technology Market Revenue (Million) Forecast, by Application 2020 & 2033
- Table 60: South Korea Bioprocess Technology Market Volume (K Unit) Forecast, by Application 2020 & 2033
- Table 61: Rest of Asia Pacific Bioprocess Technology Market Revenue (Million) Forecast, by Application 2020 & 2033
- Table 62: Rest of Asia Pacific Bioprocess Technology Market Volume (K Unit) Forecast, by Application 2020 & 2033
- Table 63: Global Bioprocess Technology Market Revenue Million Forecast, by Product 2020 & 2033
- Table 64: Global Bioprocess Technology Market Volume K Unit Forecast, by Product 2020 & 2033
- Table 65: Global Bioprocess Technology Market Revenue Million Forecast, by Application 2020 & 2033
- Table 66: Global Bioprocess Technology Market Volume K Unit Forecast, by Application 2020 & 2033
- Table 67: Global Bioprocess Technology Market Revenue Million Forecast, by End-User 2020 & 2033
- Table 68: Global Bioprocess Technology Market Volume K Unit Forecast, by End-User 2020 & 2033
- Table 69: Global Bioprocess Technology Market Revenue Million Forecast, by Country 2020 & 2033
- Table 70: Global Bioprocess Technology Market Volume K Unit Forecast, by Country 2020 & 2033
- Table 71: GCC Bioprocess Technology Market Revenue (Million) Forecast, by Application 2020 & 2033
- Table 72: GCC Bioprocess Technology Market Volume (K Unit) Forecast, by Application 2020 & 2033
- Table 73: South Africa Bioprocess Technology Market Revenue (Million) Forecast, by Application 2020 & 2033
- Table 74: South Africa Bioprocess Technology Market Volume (K Unit) Forecast, by Application 2020 & 2033
- Table 75: Rest of Middle East and Africa Bioprocess Technology Market Revenue (Million) Forecast, by Application 2020 & 2033
- Table 76: Rest of Middle East and Africa Bioprocess Technology Market Volume (K Unit) Forecast, by Application 2020 & 2033
- Table 77: Global Bioprocess Technology Market Revenue Million Forecast, by Product 2020 & 2033
- Table 78: Global Bioprocess Technology Market Volume K Unit Forecast, by Product 2020 & 2033
- Table 79: Global Bioprocess Technology Market Revenue Million Forecast, by Application 2020 & 2033
- Table 80: Global Bioprocess Technology Market Volume K Unit Forecast, by Application 2020 & 2033
- Table 81: Global Bioprocess Technology Market Revenue Million Forecast, by End-User 2020 & 2033
- Table 82: Global Bioprocess Technology Market Volume K Unit Forecast, by End-User 2020 & 2033
- Table 83: Global Bioprocess Technology Market Revenue Million Forecast, by Country 2020 & 2033
- Table 84: Global Bioprocess Technology Market Volume K Unit Forecast, by Country 2020 & 2033
- Table 85: Brazil Bioprocess Technology Market Revenue (Million) Forecast, by Application 2020 & 2033
- Table 86: Brazil Bioprocess Technology Market Volume (K Unit) Forecast, by Application 2020 & 2033
- Table 87: Argentina Bioprocess Technology Market Revenue (Million) Forecast, by Application 2020 & 2033
- Table 88: Argentina Bioprocess Technology Market Volume (K Unit) Forecast, by Application 2020 & 2033
- Table 89: Rest of South America Bioprocess Technology Market Revenue (Million) Forecast, by Application 2020 & 2033
- Table 90: Rest of South America Bioprocess Technology Market Volume (K Unit) Forecast, by Application 2020 & 2033
Frequently Asked Questions
1. What is the projected Compound Annual Growth Rate (CAGR) of the Bioprocess Technology Market?
The projected CAGR is approximately 14.44%.
2. Which companies are prominent players in the Bioprocess Technology Market?
Key companies in the market include Bio-Rad Laboratories Inc, Merck KGaA, Eppendorf AG, F Hoffmann-La Roche Ltd, Thermo Fisher Scientific Inc, Lonza Group AG, Danaher Corporation, Sartorius Group, Getinge AB, Agilent Technologies Inc, Advanced Instruments LLC, ELITechgroup Inc (Gonotec Gmbh).
3. What are the main segments of the Bioprocess Technology Market?
The market segments include Product, Application, End-User.
4. Can you provide details about the market size?
The market size is estimated to be USD 33.60 Million as of 2022.
5. What are some drivers contributing to market growth?
Expansion in the Biopharmaceutical Industry; Increasing Investments in Research and Development by Biotechnology and Pharmaceutical Companies.
6. What are the notable trends driving market growth?
Recombinant Protein Segment Expected to Witness Significant Growth Over the Forecast Period..
7. Are there any restraints impacting market growth?
High Cost of Instruments; Strict Regulations.
8. Can you provide examples of recent developments in the market?
February 2023: Researchers from the Indian Institute of Technology (IIT) Guwahati developed a special 'Protein Toolbox,' which can be used to convert skin cells into heart cells and hence, fix a damaged heart. Known as a 'Recombinant Protein Toolbox,' it comprises six special proteins and can be used to regenerate damaged heart tissues.
9. What pricing options are available for accessing the report?
Pricing options include single-user, multi-user, and enterprise licenses priced at USD 4750, USD 5250, and USD 8750 respectively.
10. Is the market size provided in terms of value or volume?
The market size is provided in terms of value, measured in Million and volume, measured in K Unit.
11. Are there any specific market keywords associated with the report?
Yes, the market keyword associated with the report is "Bioprocess Technology Market," which aids in identifying and referencing the specific market segment covered.
12. How do I determine which pricing option suits my needs best?
The pricing options vary based on user requirements and access needs. Individual users may opt for single-user licenses, while businesses requiring broader access may choose multi-user or enterprise licenses for cost-effective access to the report.
13. Are there any additional resources or data provided in the Bioprocess Technology Market report?
While the report offers comprehensive insights, it's advisable to review the specific contents or supplementary materials provided to ascertain if additional resources or data are available.
14. How can I stay updated on further developments or reports in the Bioprocess Technology Market?
To stay informed about further developments, trends, and reports in the Bioprocess Technology Market, consider subscribing to industry newsletters, following relevant companies and organizations, or regularly checking reputable industry news sources and publications.
Methodology
Step 1 - Identification of Relevant Samples Size from Population Database


Step 2 - Approaches for Defining Global Market Size (Value, Volume* & Price*)

Note*: In applicable scenarios
Step 3 - Data Sources
Primary Research
- Web Analytics
- Survey Reports
- Research Institute
- Latest Research Reports
- Opinion Leaders
Secondary Research
- Annual Reports
- White Paper
- Latest Press Release
- Industry Association
- Paid Database
- Investor Presentations

Step 4 - Data Triangulation
Involves using different sources of information in order to increase the validity of a study
These sources are likely to be stakeholders in a program - participants, other researchers, program staff, other community members, and so on.
Then we put all data in single framework & apply various statistical tools to find out the dynamic on the market.
During the analysis stage, feedback from the stakeholder groups would be compared to determine areas of agreement as well as areas of divergence