


Key Insights
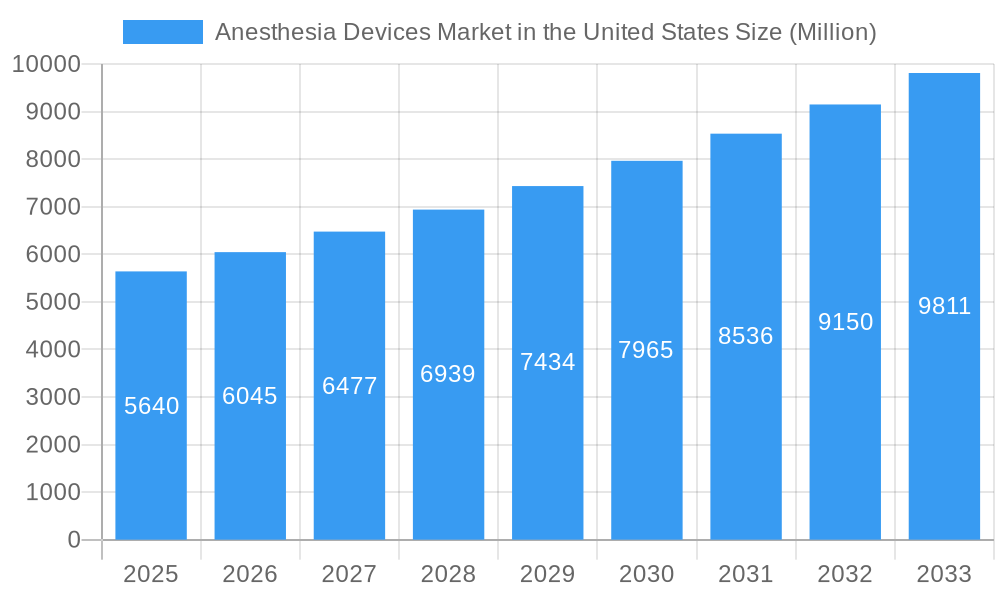
The United States Anesthesia Devices Market is poised for significant expansion, driven by an aging population, increasing prevalence of chronic diseases, and a growing demand for advanced surgical procedures. With a substantial market size of $5.64 billion in 2025, the sector is projected to experience a robust Compound Annual Growth Rate (CAGR) of 7.10% through 2033. This growth is underpinned by advancements in anesthesia technology, leading to the development of more sophisticated anesthesia workstations, delivery machines, ventilators, and patient monitors that enhance safety and efficacy during surgical interventions. The rising number of minimally invasive surgeries, which often require precise anesthetic management, further fuels market expansion.
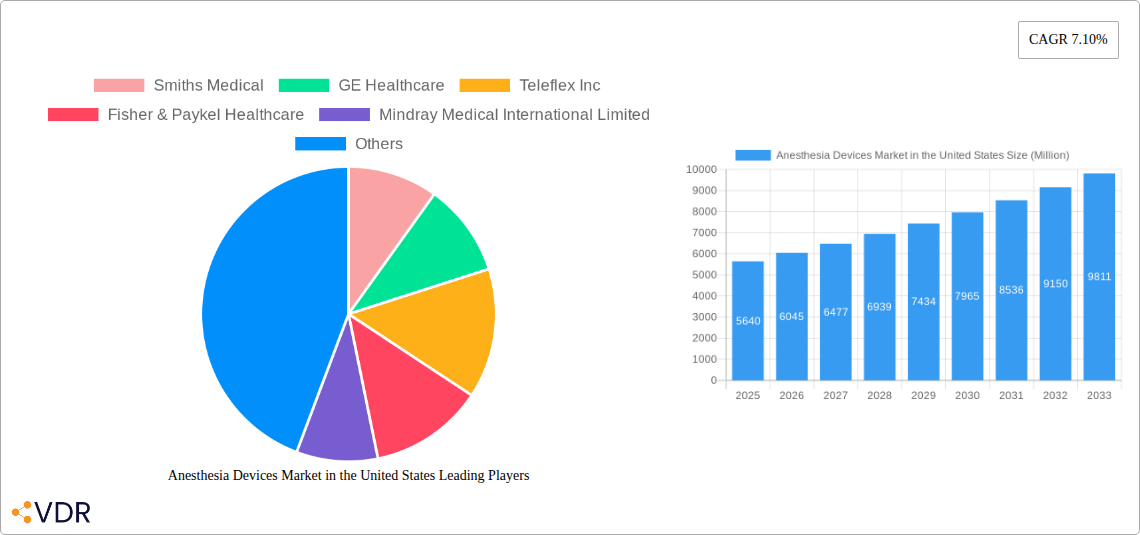
Anesthesia Devices Market in the United States Market Size (In Billion)

Key drivers for this market include the continuous innovation in anesthetic delivery systems and patient monitoring solutions, aimed at improving patient outcomes and reducing complications. The increasing adoption of anesthesia disposables and accessories, such as breathing circuits, masks, and endotracheal tubes, is also contributing to market growth. While the market benefits from these positive trends, potential restraints could include stringent regulatory approvals for new devices and the high initial investment costs associated with advanced anesthesia equipment, particularly for smaller healthcare facilities. However, the overall outlook remains highly optimistic, with ample opportunities for key players like GE Healthcare, Medtronic PLC, and Philips NV to capitalize on the evolving needs of the US healthcare landscape.
Anesthesia Devices Market in the United States Company Market Share
Anesthesia Devices Market in the United States: Comprehensive Market Analysis 2019-2033
This in-depth report provides a detailed analysis of the Anesthesia Devices Market in the United States, encompassing the historical period of 2019-2024, the base and estimated year of 2025, and a comprehensive forecast period extending to 2033. We delve into the intricate market dynamics, growth trends, product landscape, key drivers, challenges, and the pivotal role of leading players in shaping the future of anesthesia delivery in the US. The report quantifies market evolution in million units, offering actionable insights for stakeholders in this critical healthcare sector.
Anesthesia Devices Market in the United States Market Dynamics & Structure
The U.S. anesthesia devices market is characterized by a moderately concentrated structure, with a few key global players dominating significant market shares. Technological innovation acts as a primary driver, pushing for more sophisticated, user-friendly, and integrated anesthesia systems that enhance patient safety and procedural efficiency. The stringent regulatory framework set by the FDA, while ensuring product safety and efficacy, also presents a barrier to entry and necessitates substantial investment in research and development and compliance. Competitive product substitutes are emerging, particularly in the realm of non-anesthetic pain management and minimally invasive procedures, though core anesthesia delivery remains indispensable. End-user demographics, primarily hospitals, ambulatory surgical centers, and pain management clinics, are increasingly demanding cost-effective yet advanced solutions. Mergers and acquisitions (M&A) trends indicate a consolidation strategy among larger players to expand their product portfolios and market reach. For instance, the historical M&A activity suggests an average of 2-3 significant deals annually within the broader medical device sector impacting anesthesia.
- Market Concentration: Dominated by a few multinational corporations, indicating strong brand loyalty and established distribution networks.
- Technological Innovation Drivers: Focus on patient monitoring, automated delivery, and integration with electronic health records (EHRs).
- Regulatory Frameworks: FDA pre-market approval and ongoing compliance are critical, impacting R&D timelines and market entry costs.
- Competitive Product Substitutes: Emerging pain management modalities and advancements in non-pharmacological interventions.
- End-User Demographics: Increasing demand from outpatient surgical centers for portable and integrated solutions.
- M&A Trends: Strategic acquisitions aimed at enhancing product offerings and gaining market share.
Anesthesia Devices Market in the United States Growth Trends & Insights
The U.S. anesthesia devices market is poised for substantial growth, driven by an aging population, an increase in elective surgical procedures, and advancements in medical technology. The market size is projected to evolve from approximately 5,800 million units in 2023 to an estimated 7,500 million units by 2025 and further to over 10,000 million units by 2033. This trajectory reflects a Compound Annual Growth Rate (CAGR) of approximately 6.5% during the forecast period. Adoption rates of sophisticated anesthesia workstations and advanced monitoring systems are on the rise, fueled by a greater emphasis on patient safety and the need for precise anesthetic management. Technological disruptions, such as the integration of artificial intelligence (AI) for real-time decision support and predictive analytics in anesthesia delivery, are beginning to influence market dynamics. Furthermore, evolving consumer behavior, characterized by a growing preference for outpatient surgeries and minimally invasive procedures, is indirectly driving the demand for more portable, efficient, and integrated anesthesia solutions. The increasing focus on personalized medicine and precision anesthesia is also a significant trend, prompting manufacturers to develop devices capable of fine-tuning anesthetic delivery based on individual patient characteristics. The market penetration of advanced anesthesia ventilators and sophisticated anesthesia monitors is expected to witness a significant uplift as healthcare facilities prioritize patient outcomes and operational efficiency. The shift towards value-based healthcare models further incentivizes the adoption of technologies that can demonstrate improved patient recovery and reduced healthcare costs.
Dominant Regions, Countries, or Segments in Anesthesia Devices Market in the United States
Within the United States anesthesia devices market, the Product Type segment holds the most significant dominance, specifically driven by Anesthesia Workstations and Anesthesia Delivery Machines. These core components form the backbone of any anesthesia setup, leading to their consistent high demand. The increasing complexity of surgical procedures and the growing need for integrated patient monitoring and ventilation capabilities directly translate into robust sales for anesthesia workstations. These sophisticated devices offer centralized control over gas delivery, ventilation, and monitoring, enhancing surgeon and anesthesiologist efficiency and patient safety.
Anesthesia Workstations: These are the central hub for anesthesia delivery and monitoring. Their dominance is driven by:
- Technological Advancements: Integration of advanced ventilation modes, drug delivery systems, and digital monitoring capabilities.
- Demand for Integrated Solutions: Healthcare facilities are increasingly opting for single-platform solutions that streamline workflow and reduce equipment footprint.
- Increased Surgical Volume: A rise in both complex and routine surgeries directly correlates with the need for reliable anesthesia workstations.
- Estimated Market Share: Anesthesia Workstations are estimated to hold a significant portion, approximately 35-40% of the total market revenue in 2025.
Anesthesia Delivery Machines (Portable & Standalone): These machines are critical for delivering anesthetic gases and are essential across various healthcare settings.
- Portability: The growing trend towards ambulatory surgical centers and emergency medical services necessitates portable anesthesia delivery units.
- Standalone Capabilities: These are vital for smaller clinics or as backup systems in larger hospitals.
- Estimated Market Share: Anesthesia Delivery Machines, collectively, are projected to account for around 25-30% of the market in 2025.
While Disposables and Accessories such as Anesthesia Circuits and Endotracheal Tubes (ETTs) are crucial and exhibit steady growth, their individual market share is smaller compared to the capital equipment. However, their recurring purchase nature makes them a vital component of the overall market. The demand for these consumables is directly linked to the volume of procedures performed, making their market substantial.
- Anesthesia Circuits (Breathing Circuits): Essential for delivering anesthetic gases to the patient and removing exhaled gases.
- High Volume Usage: Every anesthesia procedure requires these disposable circuits.
- Infection Control Focus: Disposable nature aids in preventing cross-contamination.
- Estimated Market Share: Breathing Circuits alone are estimated to contribute around 10-15% of the market in 2025.
The geographical dominance within the United States is, by extension, the United States itself, given the report's scope. Within the US, regions with a higher density of large hospitals, advanced surgical centers, and a greater prevalence of complex medical procedures will naturally exhibit higher demand for anesthesia devices.
Anesthesia Devices Market in the United States Product Landscape
The product landscape for anesthesia devices in the U.S. is dynamic, marked by continuous innovation aimed at enhancing patient safety, operational efficiency, and data integration. Manufacturers are introducing anesthesia workstations with advanced ventilation capabilities, intuitive touch interfaces, and integrated drug delivery systems. Innovations in anesthesia monitors focus on real-time physiological parameter tracking and predictive analytics to aid in early detection of patient distress. The development of novel anesthesia delivery machines emphasizes portability and ease of use for diverse clinical settings. The demand for advanced Anesthesia Circuits with improved gas flow dynamics and reduced dead space is also notable.
Key Drivers, Barriers & Challenges in Anesthesia Devices Market in the United States
Key Drivers: The U.S. anesthesia devices market is propelled by several key drivers. The increasing volume of surgical procedures, especially elective and minimally invasive surgeries, directly fuels demand. An aging population with a higher incidence of chronic diseases requiring surgical intervention is another significant factor. Technological advancements, leading to more sophisticated, safer, and efficient anesthesia delivery and monitoring systems, also act as a strong catalyst. Furthermore, the growing emphasis on patient safety and the need for precision in anesthesia management encourage the adoption of advanced devices.
Barriers & Challenges: Despite strong growth, the market faces several challenges. The high initial cost of advanced anesthesia equipment can be a barrier for smaller healthcare facilities. Stringent regulatory approval processes by the FDA lead to extended development cycles and increased costs for manufacturers. Reimbursement policies and pricing pressures from healthcare payers can also impact profitability. Supply chain disruptions, as seen in recent years, pose a significant risk to the consistent availability of critical components and finished products. Intense competition among established players and the emergence of new market entrants add to the competitive pressure.
Emerging Opportunities in Anesthesia Devices Market in the United States
Emerging opportunities in the U.S. anesthesia devices market lie in the development of AI-powered decision support systems that can predict patient responses to anesthesia and optimize delivery. The growing demand for home-based and remote patient monitoring solutions for post-anesthesia care presents another avenue. Innovations in anesthesia devices that cater to the specific needs of pediatric and geriatric patients, offering tailored functionalities and safety features, are also promising. The integration of anesthesia devices with other hospital IT systems for seamless data exchange and improved workflow automation represents a significant untapped potential.
Growth Accelerators in the Anesthesia Devices Market in the United States Industry
Several factors are accelerating the growth of the U.S. anesthesia devices industry. Continuous technological breakthroughs, such as advancements in non-invasive monitoring and closed-loop anesthesia systems, are enhancing device capabilities. Strategic partnerships between device manufacturers and healthcare providers are crucial for understanding evolving clinical needs and developing relevant solutions. Market expansion strategies, including the development of more affordable and accessible anesthesia devices for underserved regions and healthcare settings, are also contributing to overall growth. The increasing focus on value-based healthcare encourages the adoption of devices that demonstrate improved patient outcomes and reduced healthcare costs, acting as a significant growth accelerator.
Key Players Shaping the Anesthesia Devices Market in the United States Market
- Smiths Medical
- GE Healthcare
- Teleflex Inc
- Fisher & Paykel Healthcare
- Mindray Medical International Limited
- Ambu A/S
- Medtronic PLC
- Koninklijke Philips NV
- B Braun SE
- Draegerwerk AG
Notable Milestones in Anesthesia Devices Market in the United States Sector
- May 2022: Fisher and Paykel Healthcare launched two innovative products, optiflow Switch, and Optiflow Trace, specifically developed for anesthesia applications, enhancing respiratory support and patient care during anesthetic procedures.
- April 2022: GE Healthcare secured pre-market approval from the United States Food and Drug Administration for its End-tidal control software. This advanced software, designed for general anesthesia delivery on its Aisys CS Anesthesia Delivery System, promises improved precision and safety in anesthetic management.
In-Depth Anesthesia Devices Market in the United States Market Outlook
The U.S. anesthesia devices market outlook is exceptionally positive, driven by sustained innovation and an increasing demand for advanced patient care solutions. Future growth will be significantly influenced by the adoption of smart anesthesia devices that leverage data analytics and AI for predictive capabilities, further enhancing patient safety and treatment efficacy. Strategic collaborations between technology developers and medical device manufacturers will unlock new applications and improve existing technologies. The ongoing expansion of ambulatory surgery centers and the increasing preference for outpatient procedures will fuel the demand for compact, portable, and integrated anesthesia systems. The market's trajectory points towards a future where anesthesia delivery is more personalized, efficient, and data-driven, offering substantial opportunities for stakeholders committed to innovation and quality.
Anesthesia Devices Market in the United States Segmentation
-
1. Product Type
- 1.1. Anesthesia Workstation
-
1.2. Anesthesia Delivery Machines
- 1.2.1. Portable
- 1.2.2. Standalone
- 1.3. Anesthesia Ventilators
- 1.4. Anesthesia Monitors
-
2. Disposables and Accessories
- 2.1. Anesthesia Circuits (Breathing Circuits)
- 2.2. Anesthesia Masks
- 2.3. Endotracheal Tubes (ETTs)
- 2.4. Laryngeal Mask Airways (LMAs)
- 2.5. Others
Anesthesia Devices Market in the United States Segmentation By Geography
-
1. North America
- 1.1. United States
- 1.2. Canada
- 1.3. Mexico
-
2. South America
- 2.1. Brazil
- 2.2. Argentina
- 2.3. Rest of South America
-
3. Europe
- 3.1. United Kingdom
- 3.2. Germany
- 3.3. France
- 3.4. Italy
- 3.5. Spain
- 3.6. Russia
- 3.7. Benelux
- 3.8. Nordics
- 3.9. Rest of Europe
-
4. Middle East & Africa
- 4.1. Turkey
- 4.2. Israel
- 4.3. GCC
- 4.4. North Africa
- 4.5. South Africa
- 4.6. Rest of Middle East & Africa
-
5. Asia Pacific
- 5.1. China
- 5.2. India
- 5.3. Japan
- 5.4. South Korea
- 5.5. ASEAN
- 5.6. Oceania
- 5.7. Rest of Asia Pacific
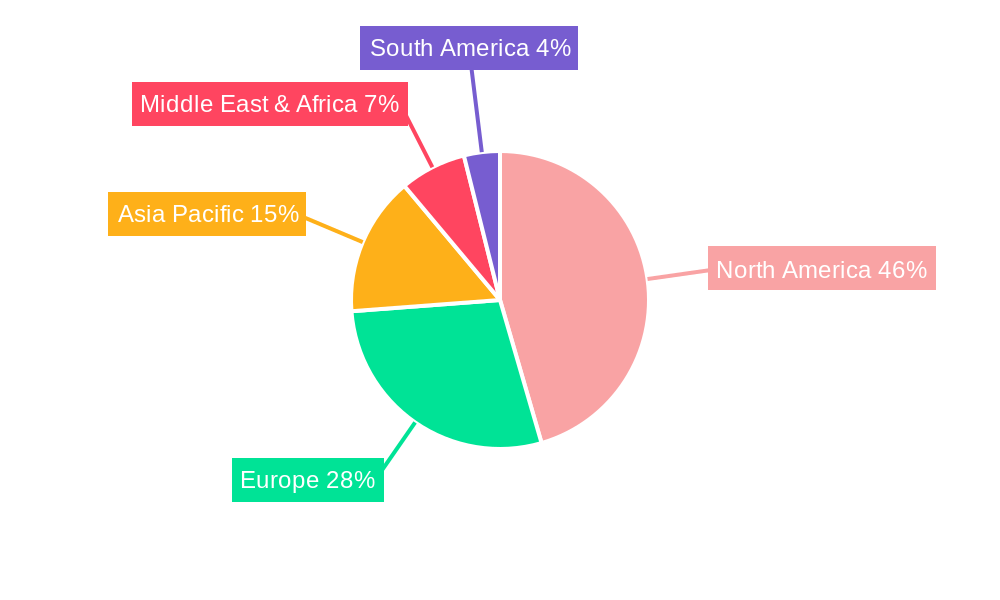
Anesthesia Devices Market in the United States Regional Market Share
Geographic Coverage of Anesthesia Devices Market in the United States
Anesthesia Devices Market in the United States REPORT HIGHLIGHTS
| Aspects | Details |
|---|---|
| Study Period | 2020-2034 |
| Base Year | 2025 |
| Estimated Year | 2026 |
| Forecast Period | 2026-2034 |
| Historical Period | 2020-2025 |
| Growth Rate | CAGR of 7.10% from 2020-2034 |
| Segmentation |
|
Table of Contents
- 1. Introduction
- 1.1. Research Scope
- 1.2. Market Segmentation
- 1.3. Research Methodology
- 1.4. Definitions and Assumptions
- 2. Executive Summary
- 2.1. Introduction
- 3. Market Dynamics
- 3.1. Introduction
- 3.2. Market Drivers
- 3.2.1. Technological Advancements in Anesthesia; Increasing Geriatric Population and Growing Number of Surgeries; Significant Patient Pool of Patients with Chronic Diseases
- 3.3. Market Restrains
- 3.3.1. High Cost of Equipment; Difficulties Associated with the Usage of Anesthesia Devices
- 3.4. Market Trends
- 3.4.1. Anesthesia Work Station to Witness Steady Growth Over the Forecast Period
- 4. Market Factor Analysis
- 4.1. Porters Five Forces
- 4.2. Supply/Value Chain
- 4.3. PESTEL analysis
- 4.4. Market Entropy
- 4.5. Patent/Trademark Analysis
- 5. Global Anesthesia Devices Market in the United States Analysis, Insights and Forecast, 2020-2032
- 5.1. Market Analysis, Insights and Forecast - by Product Type
- 5.1.1. Anesthesia Workstation
- 5.1.2. Anesthesia Delivery Machines
- 5.1.2.1. Portable
- 5.1.2.2. Standalone
- 5.1.3. Anesthesia Ventilators
- 5.1.4. Anesthesia Monitors
- 5.2. Market Analysis, Insights and Forecast - by Disposables and Accessories
- 5.2.1. Anesthesia Circuits (Breathing Circuits)
- 5.2.2. Anesthesia Masks
- 5.2.3. Endotracheal Tubes (ETTs)
- 5.2.4. Laryngeal Mask Airways (LMAs)
- 5.2.5. Others
- 5.3. Market Analysis, Insights and Forecast - by Region
- 5.3.1. North America
- 5.3.2. South America
- 5.3.3. Europe
- 5.3.4. Middle East & Africa
- 5.3.5. Asia Pacific
- 5.1. Market Analysis, Insights and Forecast - by Product Type
- 6. North America Anesthesia Devices Market in the United States Analysis, Insights and Forecast, 2020-2032
- 6.1. Market Analysis, Insights and Forecast - by Product Type
- 6.1.1. Anesthesia Workstation
- 6.1.2. Anesthesia Delivery Machines
- 6.1.2.1. Portable
- 6.1.2.2. Standalone
- 6.1.3. Anesthesia Ventilators
- 6.1.4. Anesthesia Monitors
- 6.2. Market Analysis, Insights and Forecast - by Disposables and Accessories
- 6.2.1. Anesthesia Circuits (Breathing Circuits)
- 6.2.2. Anesthesia Masks
- 6.2.3. Endotracheal Tubes (ETTs)
- 6.2.4. Laryngeal Mask Airways (LMAs)
- 6.2.5. Others
- 6.1. Market Analysis, Insights and Forecast - by Product Type
- 7. South America Anesthesia Devices Market in the United States Analysis, Insights and Forecast, 2020-2032
- 7.1. Market Analysis, Insights and Forecast - by Product Type
- 7.1.1. Anesthesia Workstation
- 7.1.2. Anesthesia Delivery Machines
- 7.1.2.1. Portable
- 7.1.2.2. Standalone
- 7.1.3. Anesthesia Ventilators
- 7.1.4. Anesthesia Monitors
- 7.2. Market Analysis, Insights and Forecast - by Disposables and Accessories
- 7.2.1. Anesthesia Circuits (Breathing Circuits)
- 7.2.2. Anesthesia Masks
- 7.2.3. Endotracheal Tubes (ETTs)
- 7.2.4. Laryngeal Mask Airways (LMAs)
- 7.2.5. Others
- 7.1. Market Analysis, Insights and Forecast - by Product Type
- 8. Europe Anesthesia Devices Market in the United States Analysis, Insights and Forecast, 2020-2032
- 8.1. Market Analysis, Insights and Forecast - by Product Type
- 8.1.1. Anesthesia Workstation
- 8.1.2. Anesthesia Delivery Machines
- 8.1.2.1. Portable
- 8.1.2.2. Standalone
- 8.1.3. Anesthesia Ventilators
- 8.1.4. Anesthesia Monitors
- 8.2. Market Analysis, Insights and Forecast - by Disposables and Accessories
- 8.2.1. Anesthesia Circuits (Breathing Circuits)
- 8.2.2. Anesthesia Masks
- 8.2.3. Endotracheal Tubes (ETTs)
- 8.2.4. Laryngeal Mask Airways (LMAs)
- 8.2.5. Others
- 8.1. Market Analysis, Insights and Forecast - by Product Type
- 9. Middle East & Africa Anesthesia Devices Market in the United States Analysis, Insights and Forecast, 2020-2032
- 9.1. Market Analysis, Insights and Forecast - by Product Type
- 9.1.1. Anesthesia Workstation
- 9.1.2. Anesthesia Delivery Machines
- 9.1.2.1. Portable
- 9.1.2.2. Standalone
- 9.1.3. Anesthesia Ventilators
- 9.1.4. Anesthesia Monitors
- 9.2. Market Analysis, Insights and Forecast - by Disposables and Accessories
- 9.2.1. Anesthesia Circuits (Breathing Circuits)
- 9.2.2. Anesthesia Masks
- 9.2.3. Endotracheal Tubes (ETTs)
- 9.2.4. Laryngeal Mask Airways (LMAs)
- 9.2.5. Others
- 9.1. Market Analysis, Insights and Forecast - by Product Type
- 10. Asia Pacific Anesthesia Devices Market in the United States Analysis, Insights and Forecast, 2020-2032
- 10.1. Market Analysis, Insights and Forecast - by Product Type
- 10.1.1. Anesthesia Workstation
- 10.1.2. Anesthesia Delivery Machines
- 10.1.2.1. Portable
- 10.1.2.2. Standalone
- 10.1.3. Anesthesia Ventilators
- 10.1.4. Anesthesia Monitors
- 10.2. Market Analysis, Insights and Forecast - by Disposables and Accessories
- 10.2.1. Anesthesia Circuits (Breathing Circuits)
- 10.2.2. Anesthesia Masks
- 10.2.3. Endotracheal Tubes (ETTs)
- 10.2.4. Laryngeal Mask Airways (LMAs)
- 10.2.5. Others
- 10.1. Market Analysis, Insights and Forecast - by Product Type
- 11. Competitive Analysis
- 11.1. Global Market Share Analysis 2025
- 11.2. Company Profiles
- 11.2.1 Smiths Medical
- 11.2.1.1. Overview
- 11.2.1.2. Products
- 11.2.1.3. SWOT Analysis
- 11.2.1.4. Recent Developments
- 11.2.1.5. Financials (Based on Availability)
- 11.2.2 GE Healthcare
- 11.2.2.1. Overview
- 11.2.2.2. Products
- 11.2.2.3. SWOT Analysis
- 11.2.2.4. Recent Developments
- 11.2.2.5. Financials (Based on Availability)
- 11.2.3 Teleflex Inc
- 11.2.3.1. Overview
- 11.2.3.2. Products
- 11.2.3.3. SWOT Analysis
- 11.2.3.4. Recent Developments
- 11.2.3.5. Financials (Based on Availability)
- 11.2.4 Fisher & Paykel Healthcare
- 11.2.4.1. Overview
- 11.2.4.2. Products
- 11.2.4.3. SWOT Analysis
- 11.2.4.4. Recent Developments
- 11.2.4.5. Financials (Based on Availability)
- 11.2.5 Mindray Medical International Limited
- 11.2.5.1. Overview
- 11.2.5.2. Products
- 11.2.5.3. SWOT Analysis
- 11.2.5.4. Recent Developments
- 11.2.5.5. Financials (Based on Availability)
- 11.2.6 Ambu A/S
- 11.2.6.1. Overview
- 11.2.6.2. Products
- 11.2.6.3. SWOT Analysis
- 11.2.6.4. Recent Developments
- 11.2.6.5. Financials (Based on Availability)
- 11.2.7 Medtronic PLC
- 11.2.7.1. Overview
- 11.2.7.2. Products
- 11.2.7.3. SWOT Analysis
- 11.2.7.4. Recent Developments
- 11.2.7.5. Financials (Based on Availability)
- 11.2.8 Koninklijke Philips NV
- 11.2.8.1. Overview
- 11.2.8.2. Products
- 11.2.8.3. SWOT Analysis
- 11.2.8.4. Recent Developments
- 11.2.8.5. Financials (Based on Availability)
- 11.2.9 B Braun SE
- 11.2.9.1. Overview
- 11.2.9.2. Products
- 11.2.9.3. SWOT Analysis
- 11.2.9.4. Recent Developments
- 11.2.9.5. Financials (Based on Availability)
- 11.2.10 Draegerwerk AG
- 11.2.10.1. Overview
- 11.2.10.2. Products
- 11.2.10.3. SWOT Analysis
- 11.2.10.4. Recent Developments
- 11.2.10.5. Financials (Based on Availability)
- 11.2.1 Smiths Medical
List of Figures
- Figure 1: Global Anesthesia Devices Market in the United States Revenue Breakdown (Million, %) by Region 2025 & 2033
- Figure 2: Global Anesthesia Devices Market in the United States Volume Breakdown (K Unit, %) by Region 2025 & 2033
- Figure 3: North America Anesthesia Devices Market in the United States Revenue (Million), by Product Type 2025 & 2033
- Figure 4: North America Anesthesia Devices Market in the United States Volume (K Unit), by Product Type 2025 & 2033
- Figure 5: North America Anesthesia Devices Market in the United States Revenue Share (%), by Product Type 2025 & 2033
- Figure 6: North America Anesthesia Devices Market in the United States Volume Share (%), by Product Type 2025 & 2033
- Figure 7: North America Anesthesia Devices Market in the United States Revenue (Million), by Disposables and Accessories 2025 & 2033
- Figure 8: North America Anesthesia Devices Market in the United States Volume (K Unit), by Disposables and Accessories 2025 & 2033
- Figure 9: North America Anesthesia Devices Market in the United States Revenue Share (%), by Disposables and Accessories 2025 & 2033
- Figure 10: North America Anesthesia Devices Market in the United States Volume Share (%), by Disposables and Accessories 2025 & 2033
- Figure 11: North America Anesthesia Devices Market in the United States Revenue (Million), by Country 2025 & 2033
- Figure 12: North America Anesthesia Devices Market in the United States Volume (K Unit), by Country 2025 & 2033
- Figure 13: North America Anesthesia Devices Market in the United States Revenue Share (%), by Country 2025 & 2033
- Figure 14: North America Anesthesia Devices Market in the United States Volume Share (%), by Country 2025 & 2033
- Figure 15: South America Anesthesia Devices Market in the United States Revenue (Million), by Product Type 2025 & 2033
- Figure 16: South America Anesthesia Devices Market in the United States Volume (K Unit), by Product Type 2025 & 2033
- Figure 17: South America Anesthesia Devices Market in the United States Revenue Share (%), by Product Type 2025 & 2033
- Figure 18: South America Anesthesia Devices Market in the United States Volume Share (%), by Product Type 2025 & 2033
- Figure 19: South America Anesthesia Devices Market in the United States Revenue (Million), by Disposables and Accessories 2025 & 2033
- Figure 20: South America Anesthesia Devices Market in the United States Volume (K Unit), by Disposables and Accessories 2025 & 2033
- Figure 21: South America Anesthesia Devices Market in the United States Revenue Share (%), by Disposables and Accessories 2025 & 2033
- Figure 22: South America Anesthesia Devices Market in the United States Volume Share (%), by Disposables and Accessories 2025 & 2033
- Figure 23: South America Anesthesia Devices Market in the United States Revenue (Million), by Country 2025 & 2033
- Figure 24: South America Anesthesia Devices Market in the United States Volume (K Unit), by Country 2025 & 2033
- Figure 25: South America Anesthesia Devices Market in the United States Revenue Share (%), by Country 2025 & 2033
- Figure 26: South America Anesthesia Devices Market in the United States Volume Share (%), by Country 2025 & 2033
- Figure 27: Europe Anesthesia Devices Market in the United States Revenue (Million), by Product Type 2025 & 2033
- Figure 28: Europe Anesthesia Devices Market in the United States Volume (K Unit), by Product Type 2025 & 2033
- Figure 29: Europe Anesthesia Devices Market in the United States Revenue Share (%), by Product Type 2025 & 2033
- Figure 30: Europe Anesthesia Devices Market in the United States Volume Share (%), by Product Type 2025 & 2033
- Figure 31: Europe Anesthesia Devices Market in the United States Revenue (Million), by Disposables and Accessories 2025 & 2033
- Figure 32: Europe Anesthesia Devices Market in the United States Volume (K Unit), by Disposables and Accessories 2025 & 2033
- Figure 33: Europe Anesthesia Devices Market in the United States Revenue Share (%), by Disposables and Accessories 2025 & 2033
- Figure 34: Europe Anesthesia Devices Market in the United States Volume Share (%), by Disposables and Accessories 2025 & 2033
- Figure 35: Europe Anesthesia Devices Market in the United States Revenue (Million), by Country 2025 & 2033
- Figure 36: Europe Anesthesia Devices Market in the United States Volume (K Unit), by Country 2025 & 2033
- Figure 37: Europe Anesthesia Devices Market in the United States Revenue Share (%), by Country 2025 & 2033
- Figure 38: Europe Anesthesia Devices Market in the United States Volume Share (%), by Country 2025 & 2033
- Figure 39: Middle East & Africa Anesthesia Devices Market in the United States Revenue (Million), by Product Type 2025 & 2033
- Figure 40: Middle East & Africa Anesthesia Devices Market in the United States Volume (K Unit), by Product Type 2025 & 2033
- Figure 41: Middle East & Africa Anesthesia Devices Market in the United States Revenue Share (%), by Product Type 2025 & 2033
- Figure 42: Middle East & Africa Anesthesia Devices Market in the United States Volume Share (%), by Product Type 2025 & 2033
- Figure 43: Middle East & Africa Anesthesia Devices Market in the United States Revenue (Million), by Disposables and Accessories 2025 & 2033
- Figure 44: Middle East & Africa Anesthesia Devices Market in the United States Volume (K Unit), by Disposables and Accessories 2025 & 2033
- Figure 45: Middle East & Africa Anesthesia Devices Market in the United States Revenue Share (%), by Disposables and Accessories 2025 & 2033
- Figure 46: Middle East & Africa Anesthesia Devices Market in the United States Volume Share (%), by Disposables and Accessories 2025 & 2033
- Figure 47: Middle East & Africa Anesthesia Devices Market in the United States Revenue (Million), by Country 2025 & 2033
- Figure 48: Middle East & Africa Anesthesia Devices Market in the United States Volume (K Unit), by Country 2025 & 2033
- Figure 49: Middle East & Africa Anesthesia Devices Market in the United States Revenue Share (%), by Country 2025 & 2033
- Figure 50: Middle East & Africa Anesthesia Devices Market in the United States Volume Share (%), by Country 2025 & 2033
- Figure 51: Asia Pacific Anesthesia Devices Market in the United States Revenue (Million), by Product Type 2025 & 2033
- Figure 52: Asia Pacific Anesthesia Devices Market in the United States Volume (K Unit), by Product Type 2025 & 2033
- Figure 53: Asia Pacific Anesthesia Devices Market in the United States Revenue Share (%), by Product Type 2025 & 2033
- Figure 54: Asia Pacific Anesthesia Devices Market in the United States Volume Share (%), by Product Type 2025 & 2033
- Figure 55: Asia Pacific Anesthesia Devices Market in the United States Revenue (Million), by Disposables and Accessories 2025 & 2033
- Figure 56: Asia Pacific Anesthesia Devices Market in the United States Volume (K Unit), by Disposables and Accessories 2025 & 2033
- Figure 57: Asia Pacific Anesthesia Devices Market in the United States Revenue Share (%), by Disposables and Accessories 2025 & 2033
- Figure 58: Asia Pacific Anesthesia Devices Market in the United States Volume Share (%), by Disposables and Accessories 2025 & 2033
- Figure 59: Asia Pacific Anesthesia Devices Market in the United States Revenue (Million), by Country 2025 & 2033
- Figure 60: Asia Pacific Anesthesia Devices Market in the United States Volume (K Unit), by Country 2025 & 2033
- Figure 61: Asia Pacific Anesthesia Devices Market in the United States Revenue Share (%), by Country 2025 & 2033
- Figure 62: Asia Pacific Anesthesia Devices Market in the United States Volume Share (%), by Country 2025 & 2033
List of Tables
- Table 1: Global Anesthesia Devices Market in the United States Revenue Million Forecast, by Product Type 2020 & 2033
- Table 2: Global Anesthesia Devices Market in the United States Volume K Unit Forecast, by Product Type 2020 & 2033
- Table 3: Global Anesthesia Devices Market in the United States Revenue Million Forecast, by Disposables and Accessories 2020 & 2033
- Table 4: Global Anesthesia Devices Market in the United States Volume K Unit Forecast, by Disposables and Accessories 2020 & 2033
- Table 5: Global Anesthesia Devices Market in the United States Revenue Million Forecast, by Region 2020 & 2033
- Table 6: Global Anesthesia Devices Market in the United States Volume K Unit Forecast, by Region 2020 & 2033
- Table 7: Global Anesthesia Devices Market in the United States Revenue Million Forecast, by Product Type 2020 & 2033
- Table 8: Global Anesthesia Devices Market in the United States Volume K Unit Forecast, by Product Type 2020 & 2033
- Table 9: Global Anesthesia Devices Market in the United States Revenue Million Forecast, by Disposables and Accessories 2020 & 2033
- Table 10: Global Anesthesia Devices Market in the United States Volume K Unit Forecast, by Disposables and Accessories 2020 & 2033
- Table 11: Global Anesthesia Devices Market in the United States Revenue Million Forecast, by Country 2020 & 2033
- Table 12: Global Anesthesia Devices Market in the United States Volume K Unit Forecast, by Country 2020 & 2033
- Table 13: United States Anesthesia Devices Market in the United States Revenue (Million) Forecast, by Application 2020 & 2033
- Table 14: United States Anesthesia Devices Market in the United States Volume (K Unit) Forecast, by Application 2020 & 2033
- Table 15: Canada Anesthesia Devices Market in the United States Revenue (Million) Forecast, by Application 2020 & 2033
- Table 16: Canada Anesthesia Devices Market in the United States Volume (K Unit) Forecast, by Application 2020 & 2033
- Table 17: Mexico Anesthesia Devices Market in the United States Revenue (Million) Forecast, by Application 2020 & 2033
- Table 18: Mexico Anesthesia Devices Market in the United States Volume (K Unit) Forecast, by Application 2020 & 2033
- Table 19: Global Anesthesia Devices Market in the United States Revenue Million Forecast, by Product Type 2020 & 2033
- Table 20: Global Anesthesia Devices Market in the United States Volume K Unit Forecast, by Product Type 2020 & 2033
- Table 21: Global Anesthesia Devices Market in the United States Revenue Million Forecast, by Disposables and Accessories 2020 & 2033
- Table 22: Global Anesthesia Devices Market in the United States Volume K Unit Forecast, by Disposables and Accessories 2020 & 2033
- Table 23: Global Anesthesia Devices Market in the United States Revenue Million Forecast, by Country 2020 & 2033
- Table 24: Global Anesthesia Devices Market in the United States Volume K Unit Forecast, by Country 2020 & 2033
- Table 25: Brazil Anesthesia Devices Market in the United States Revenue (Million) Forecast, by Application 2020 & 2033
- Table 26: Brazil Anesthesia Devices Market in the United States Volume (K Unit) Forecast, by Application 2020 & 2033
- Table 27: Argentina Anesthesia Devices Market in the United States Revenue (Million) Forecast, by Application 2020 & 2033
- Table 28: Argentina Anesthesia Devices Market in the United States Volume (K Unit) Forecast, by Application 2020 & 2033
- Table 29: Rest of South America Anesthesia Devices Market in the United States Revenue (Million) Forecast, by Application 2020 & 2033
- Table 30: Rest of South America Anesthesia Devices Market in the United States Volume (K Unit) Forecast, by Application 2020 & 2033
- Table 31: Global Anesthesia Devices Market in the United States Revenue Million Forecast, by Product Type 2020 & 2033
- Table 32: Global Anesthesia Devices Market in the United States Volume K Unit Forecast, by Product Type 2020 & 2033
- Table 33: Global Anesthesia Devices Market in the United States Revenue Million Forecast, by Disposables and Accessories 2020 & 2033
- Table 34: Global Anesthesia Devices Market in the United States Volume K Unit Forecast, by Disposables and Accessories 2020 & 2033
- Table 35: Global Anesthesia Devices Market in the United States Revenue Million Forecast, by Country 2020 & 2033
- Table 36: Global Anesthesia Devices Market in the United States Volume K Unit Forecast, by Country 2020 & 2033
- Table 37: United Kingdom Anesthesia Devices Market in the United States Revenue (Million) Forecast, by Application 2020 & 2033
- Table 38: United Kingdom Anesthesia Devices Market in the United States Volume (K Unit) Forecast, by Application 2020 & 2033
- Table 39: Germany Anesthesia Devices Market in the United States Revenue (Million) Forecast, by Application 2020 & 2033
- Table 40: Germany Anesthesia Devices Market in the United States Volume (K Unit) Forecast, by Application 2020 & 2033
- Table 41: France Anesthesia Devices Market in the United States Revenue (Million) Forecast, by Application 2020 & 2033
- Table 42: France Anesthesia Devices Market in the United States Volume (K Unit) Forecast, by Application 2020 & 2033
- Table 43: Italy Anesthesia Devices Market in the United States Revenue (Million) Forecast, by Application 2020 & 2033
- Table 44: Italy Anesthesia Devices Market in the United States Volume (K Unit) Forecast, by Application 2020 & 2033
- Table 45: Spain Anesthesia Devices Market in the United States Revenue (Million) Forecast, by Application 2020 & 2033
- Table 46: Spain Anesthesia Devices Market in the United States Volume (K Unit) Forecast, by Application 2020 & 2033
- Table 47: Russia Anesthesia Devices Market in the United States Revenue (Million) Forecast, by Application 2020 & 2033
- Table 48: Russia Anesthesia Devices Market in the United States Volume (K Unit) Forecast, by Application 2020 & 2033
- Table 49: Benelux Anesthesia Devices Market in the United States Revenue (Million) Forecast, by Application 2020 & 2033
- Table 50: Benelux Anesthesia Devices Market in the United States Volume (K Unit) Forecast, by Application 2020 & 2033
- Table 51: Nordics Anesthesia Devices Market in the United States Revenue (Million) Forecast, by Application 2020 & 2033
- Table 52: Nordics Anesthesia Devices Market in the United States Volume (K Unit) Forecast, by Application 2020 & 2033
- Table 53: Rest of Europe Anesthesia Devices Market in the United States Revenue (Million) Forecast, by Application 2020 & 2033
- Table 54: Rest of Europe Anesthesia Devices Market in the United States Volume (K Unit) Forecast, by Application 2020 & 2033
- Table 55: Global Anesthesia Devices Market in the United States Revenue Million Forecast, by Product Type 2020 & 2033
- Table 56: Global Anesthesia Devices Market in the United States Volume K Unit Forecast, by Product Type 2020 & 2033
- Table 57: Global Anesthesia Devices Market in the United States Revenue Million Forecast, by Disposables and Accessories 2020 & 2033
- Table 58: Global Anesthesia Devices Market in the United States Volume K Unit Forecast, by Disposables and Accessories 2020 & 2033
- Table 59: Global Anesthesia Devices Market in the United States Revenue Million Forecast, by Country 2020 & 2033
- Table 60: Global Anesthesia Devices Market in the United States Volume K Unit Forecast, by Country 2020 & 2033
- Table 61: Turkey Anesthesia Devices Market in the United States Revenue (Million) Forecast, by Application 2020 & 2033
- Table 62: Turkey Anesthesia Devices Market in the United States Volume (K Unit) Forecast, by Application 2020 & 2033
- Table 63: Israel Anesthesia Devices Market in the United States Revenue (Million) Forecast, by Application 2020 & 2033
- Table 64: Israel Anesthesia Devices Market in the United States Volume (K Unit) Forecast, by Application 2020 & 2033
- Table 65: GCC Anesthesia Devices Market in the United States Revenue (Million) Forecast, by Application 2020 & 2033
- Table 66: GCC Anesthesia Devices Market in the United States Volume (K Unit) Forecast, by Application 2020 & 2033
- Table 67: North Africa Anesthesia Devices Market in the United States Revenue (Million) Forecast, by Application 2020 & 2033
- Table 68: North Africa Anesthesia Devices Market in the United States Volume (K Unit) Forecast, by Application 2020 & 2033
- Table 69: South Africa Anesthesia Devices Market in the United States Revenue (Million) Forecast, by Application 2020 & 2033
- Table 70: South Africa Anesthesia Devices Market in the United States Volume (K Unit) Forecast, by Application 2020 & 2033
- Table 71: Rest of Middle East & Africa Anesthesia Devices Market in the United States Revenue (Million) Forecast, by Application 2020 & 2033
- Table 72: Rest of Middle East & Africa Anesthesia Devices Market in the United States Volume (K Unit) Forecast, by Application 2020 & 2033
- Table 73: Global Anesthesia Devices Market in the United States Revenue Million Forecast, by Product Type 2020 & 2033
- Table 74: Global Anesthesia Devices Market in the United States Volume K Unit Forecast, by Product Type 2020 & 2033
- Table 75: Global Anesthesia Devices Market in the United States Revenue Million Forecast, by Disposables and Accessories 2020 & 2033
- Table 76: Global Anesthesia Devices Market in the United States Volume K Unit Forecast, by Disposables and Accessories 2020 & 2033
- Table 77: Global Anesthesia Devices Market in the United States Revenue Million Forecast, by Country 2020 & 2033
- Table 78: Global Anesthesia Devices Market in the United States Volume K Unit Forecast, by Country 2020 & 2033
- Table 79: China Anesthesia Devices Market in the United States Revenue (Million) Forecast, by Application 2020 & 2033
- Table 80: China Anesthesia Devices Market in the United States Volume (K Unit) Forecast, by Application 2020 & 2033
- Table 81: India Anesthesia Devices Market in the United States Revenue (Million) Forecast, by Application 2020 & 2033
- Table 82: India Anesthesia Devices Market in the United States Volume (K Unit) Forecast, by Application 2020 & 2033
- Table 83: Japan Anesthesia Devices Market in the United States Revenue (Million) Forecast, by Application 2020 & 2033
- Table 84: Japan Anesthesia Devices Market in the United States Volume (K Unit) Forecast, by Application 2020 & 2033
- Table 85: South Korea Anesthesia Devices Market in the United States Revenue (Million) Forecast, by Application 2020 & 2033
- Table 86: South Korea Anesthesia Devices Market in the United States Volume (K Unit) Forecast, by Application 2020 & 2033
- Table 87: ASEAN Anesthesia Devices Market in the United States Revenue (Million) Forecast, by Application 2020 & 2033
- Table 88: ASEAN Anesthesia Devices Market in the United States Volume (K Unit) Forecast, by Application 2020 & 2033
- Table 89: Oceania Anesthesia Devices Market in the United States Revenue (Million) Forecast, by Application 2020 & 2033
- Table 90: Oceania Anesthesia Devices Market in the United States Volume (K Unit) Forecast, by Application 2020 & 2033
- Table 91: Rest of Asia Pacific Anesthesia Devices Market in the United States Revenue (Million) Forecast, by Application 2020 & 2033
- Table 92: Rest of Asia Pacific Anesthesia Devices Market in the United States Volume (K Unit) Forecast, by Application 2020 & 2033
Frequently Asked Questions
1. What is the projected Compound Annual Growth Rate (CAGR) of the Anesthesia Devices Market in the United States?
The projected CAGR is approximately 7.10%.
2. Which companies are prominent players in the Anesthesia Devices Market in the United States?
Key companies in the market include Smiths Medical, GE Healthcare, Teleflex Inc , Fisher & Paykel Healthcare, Mindray Medical International Limited, Ambu A/S, Medtronic PLC, Koninklijke Philips NV, B Braun SE, Draegerwerk AG.
3. What are the main segments of the Anesthesia Devices Market in the United States?
The market segments include Product Type, Disposables and Accessories.
4. Can you provide details about the market size?
The market size is estimated to be USD 5.64 Million as of 2022.
5. What are some drivers contributing to market growth?
Technological Advancements in Anesthesia; Increasing Geriatric Population and Growing Number of Surgeries; Significant Patient Pool of Patients with Chronic Diseases.
6. What are the notable trends driving market growth?
Anesthesia Work Station to Witness Steady Growth Over the Forecast Period.
7. Are there any restraints impacting market growth?
High Cost of Equipment; Difficulties Associated with the Usage of Anesthesia Devices.
8. Can you provide examples of recent developments in the market?
May 2022: Fisher and Paykel Healthcare launched two products, optiflow Switch, and Optiflow Trace, developed specifically for use in anesthesia applications.
9. What pricing options are available for accessing the report?
Pricing options include single-user, multi-user, and enterprise licenses priced at USD 3800, USD 4500, and USD 5800 respectively.
10. Is the market size provided in terms of value or volume?
The market size is provided in terms of value, measured in Million and volume, measured in K Unit.
11. Are there any specific market keywords associated with the report?
Yes, the market keyword associated with the report is "Anesthesia Devices Market in the United States," which aids in identifying and referencing the specific market segment covered.
12. How do I determine which pricing option suits my needs best?
The pricing options vary based on user requirements and access needs. Individual users may opt for single-user licenses, while businesses requiring broader access may choose multi-user or enterprise licenses for cost-effective access to the report.
13. Are there any additional resources or data provided in the Anesthesia Devices Market in the United States report?
While the report offers comprehensive insights, it's advisable to review the specific contents or supplementary materials provided to ascertain if additional resources or data are available.
14. How can I stay updated on further developments or reports in the Anesthesia Devices Market in the United States?
To stay informed about further developments, trends, and reports in the Anesthesia Devices Market in the United States, consider subscribing to industry newsletters, following relevant companies and organizations, or regularly checking reputable industry news sources and publications.
Methodology
Step 1 - Identification of Relevant Samples Size from Population Database


Step 2 - Approaches for Defining Global Market Size (Value, Volume* & Price*)

Note*: In applicable scenarios
Step 3 - Data Sources
Primary Research
- Web Analytics
- Survey Reports
- Research Institute
- Latest Research Reports
- Opinion Leaders
Secondary Research
- Annual Reports
- White Paper
- Latest Press Release
- Industry Association
- Paid Database
- Investor Presentations

Step 4 - Data Triangulation
Involves using different sources of information in order to increase the validity of a study
These sources are likely to be stakeholders in a program - participants, other researchers, program staff, other community members, and so on.
Then we put all data in single framework & apply various statistical tools to find out the dynamic on the market.
During the analysis stage, feedback from the stakeholder groups would be compared to determine areas of agreement as well as areas of divergence