
Key Insights
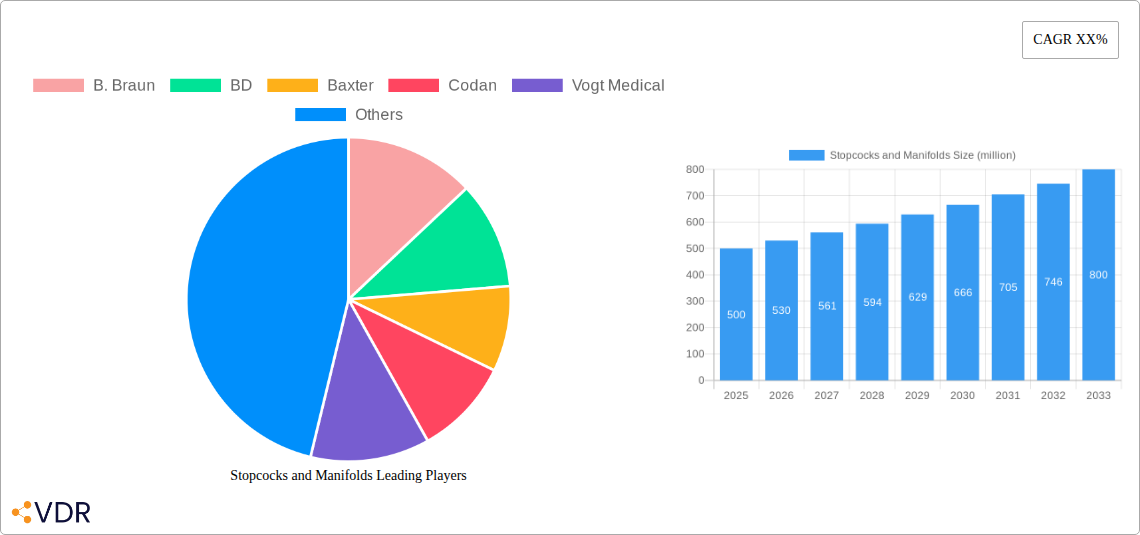
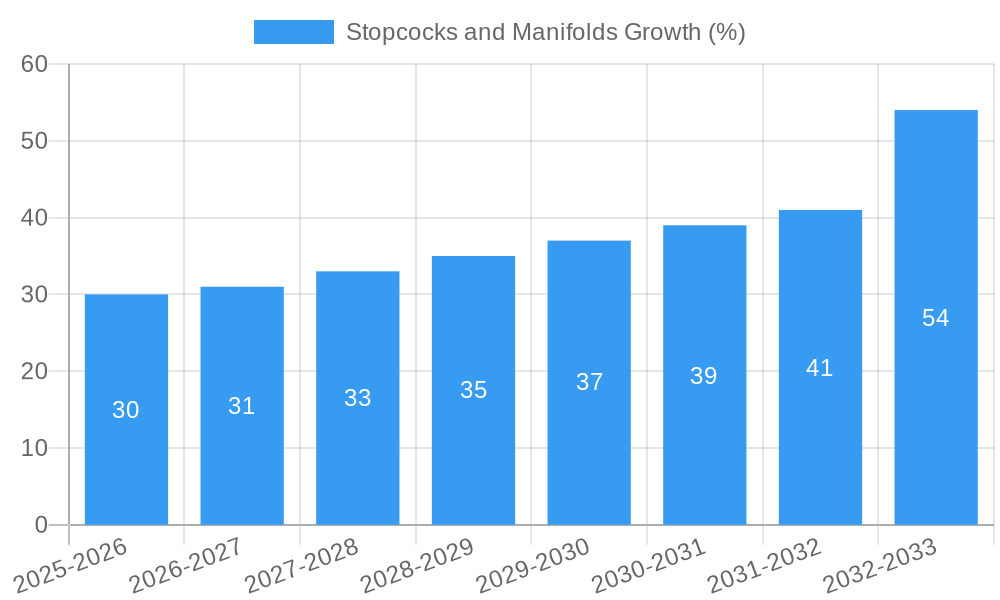
The global market for stopcocks and manifolds, crucial components in medical fluid management systems, is experiencing robust growth, driven by increasing demand for minimally invasive surgical procedures and a rise in chronic diseases requiring intravenous therapy. The market, estimated at $500 million in 2025, is projected to exhibit a Compound Annual Growth Rate (CAGR) of 6% from 2025 to 2033, reaching approximately $800 million by 2033. This expansion is fueled by several key factors. Technological advancements leading to the development of improved materials (like biocompatible polymers) and enhanced designs that minimize the risk of infection are significant contributors. Furthermore, the growing preference for single-use stopcocks and manifolds due to heightened hygiene standards in healthcare settings is driving market growth. The increasing adoption of advanced fluid management technologies in critical care settings, particularly in intensive care units (ICUs), further fuels demand. Major players like B. Braun, BD, Baxter, and others are actively engaged in product innovation and strategic partnerships to strengthen their market positions. Geographical expansion into emerging economies with expanding healthcare infrastructure also contributes to the overall market expansion.
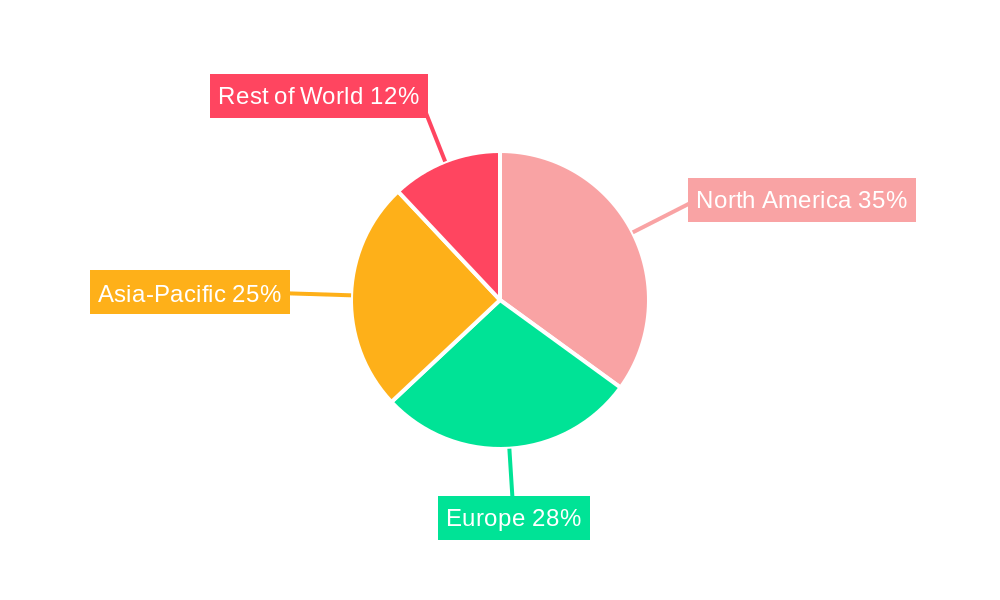
However, the market faces certain restraints. Price fluctuations in raw materials, stringent regulatory requirements for medical devices, and the potential for substitute technologies (such as needle-free drug delivery systems) could pose challenges to sustained growth. Segmentation analysis reveals a substantial share dominated by single-use stopcocks due to their hygiene benefits, while the hospital segment holds a significant market share due to high demand in critical care settings. Regional analysis shows strong growth potential in Asia-Pacific due to rising healthcare expenditure and increasing adoption of advanced medical devices. The competitive landscape is characterized by a mix of established multinational corporations and regional players focusing on innovation, product differentiation, and geographic expansion to capitalize on market opportunities.
Stopcocks and Manifolds Market Report: 2019-2033
This comprehensive report provides a detailed analysis of the global Stopcocks and Manifolds market, encompassing market dynamics, growth trends, regional analysis, competitive landscape, and future outlook. The study period covers 2019-2033, with 2025 as the base and estimated year. The report offers invaluable insights for industry professionals, investors, and strategic decision-makers seeking to navigate this dynamic market. The parent market is the medical device industry, while the child market focuses specifically on fluid management and delivery systems within healthcare.
Stopcocks and Manifolds Market Dynamics & Structure
This section analyzes the Stopcocks and Manifolds market's structure, identifying key trends and drivers influencing its evolution. The market, valued at xx million units in 2024, is expected to reach xx million units by 2033, exhibiting a CAGR of xx%.
- Market Concentration: The market is moderately concentrated, with a few major players holding significant market share. B. Braun, BD, and Baxter collectively account for approximately xx% of the market in 2024.
- Technological Innovation: Advancements in materials science (e.g., biocompatible polymers) and miniaturization are driving product innovation. Integration of smart technologies, such as sensors for fluid monitoring, is also gaining traction.
- Regulatory Framework: Stringent regulatory approvals (e.g., FDA, CE marking) impact market entry and product development timelines. Compliance costs and complexities pose significant barriers for smaller players.
- Competitive Product Substitutes: The market faces competition from alternative fluid management solutions, although Stopcocks and Manifolds maintain a strong foothold due to their established reliability and versatility.
- End-User Demographics: Hospitals and clinics are the primary end-users, with demand influenced by factors like patient volume, surgical procedures, and healthcare infrastructure development. Growth is anticipated in emerging markets due to increasing healthcare spending and improved infrastructure.
- M&A Trends: The past five years have witnessed xx M&A deals in the Stopcocks and Manifolds market, primarily driven by strategic expansion and technology acquisition. Larger companies are actively seeking to consolidate their market positions. Innovation barriers include high R&D costs, stringent regulatory requirements, and the need for specialized manufacturing capabilities.
Stopcocks and Manifolds Growth Trends & Insights
The Stopcocks and Manifolds market experienced consistent growth between 2019 and 2024, primarily driven by increasing demand from the healthcare sector. Technological advancements, particularly in minimally invasive surgical procedures and improved fluid management techniques, are key catalysts for market expansion. The adoption rate of advanced Stopcocks and Manifolds with integrated features is steadily increasing, contributing to higher market values. Consumer behavior shifts toward preference for single-use disposable devices due to hygiene concerns and cost-effectiveness are also fueling growth. The market is expected to maintain its growth trajectory over the forecast period (2025-2033), with particular emphasis on regions with growing healthcare infrastructure development.
Dominant Regions, Countries, or Segments in Stopcocks and Manifolds
North America currently dominates the Stopcocks and Manifolds market, holding approximately xx% of the global market share in 2024. This dominance is attributed to factors such as:
- High Healthcare Expenditure: Significant investments in healthcare infrastructure and advanced medical technologies fuel higher demand.
- Technological Advancements: The region is a hub for medical device innovation, leading to the development and adoption of advanced Stopcocks and Manifolds.
- Established Healthcare System: A well-established healthcare system ensures efficient distribution channels and market penetration.
Europe holds the second-largest market share, followed by Asia-Pacific which exhibits high growth potential due to:
- Rapidly Expanding Healthcare Infrastructure: Investment in hospitals and clinics is driving demand.
- Growing Awareness of Advanced Medical Technologies: Increasing awareness and adoption of sophisticated medical devices.
- Rising Disposable Incomes: Improved economic conditions lead to greater healthcare spending.
Stopcocks and Manifolds Product Landscape
The Stopcocks and Manifolds market offers a range of products, from basic manual stopcocks to sophisticated electronically controlled manifolds. Key innovations include single-use disposable devices, improved biocompatibility, and integration of pressure sensors for enhanced fluid management precision. These advancements cater to a wider range of applications in various medical settings and contribute to enhanced patient safety and improved treatment outcomes.
Key Drivers, Barriers & Challenges in Stopcocks and Manifolds
Key Drivers: The increasing prevalence of chronic diseases requiring intravenous therapies, growing demand for minimally invasive surgical procedures, and technological advancements in fluid management systems are key drivers of market growth.
Key Challenges: Supply chain disruptions due to global events can impact the availability of raw materials and manufacturing capacity, resulting in production delays and price fluctuations. Stringent regulatory requirements increase the cost and time associated with product development and market entry. Intense competition among established players and emerging market entrants exerts significant pressure on pricing and margins. These factors may collectively reduce market growth by an estimated xx% by 2033.
Emerging Opportunities in Stopcocks and Manifolds
Emerging markets in developing countries present significant growth opportunities. Innovative applications of Stopcocks and Manifolds in specialized medical fields, such as oncology and cardiology, are also promising. The increasing demand for personalized medicine and remote patient monitoring presents further opportunities for integration of smart technologies in Stopcocks and Manifolds design.
Growth Accelerators in the Stopcocks and Manifolds Industry
Technological breakthroughs in materials science, miniaturization, and sensor integration are key growth accelerators. Strategic partnerships between manufacturers and healthcare providers facilitate market access and product development. Expansion into new geographic markets, particularly in developing economies, promises significant growth potential.
Key Players Shaping the Stopcocks and Manifolds Market
- B. Braun
- BD
- Baxter
- Codan
- Vogt Medical
- ICU Medical
- Smiths Medical
- JCM MED
- Nordson Medical
- Elcam Medical
- Argon Medical
- Suzhou Health Plastic
- Wuxi Bolcom
- Shanghai Yuxing
Notable Milestones in Stopcocks and Manifolds Sector
- 2020: Launch of a new generation of biocompatible Stopcocks by B. Braun.
- 2021: Acquisition of a smaller Stopcocks manufacturer by Baxter.
- 2022: FDA approval of a novel electronically controlled manifold by BD.
- 2023: Introduction of a single-use disposable Stopcock with integrated pressure sensor by Smiths Medical.
- 2024: Strategic partnership between Argon Medical and a major hospital chain for product distribution.
In-Depth Stopcocks and Manifolds Market Outlook
The Stopcocks and Manifolds market is poised for continued growth driven by technological advancements, expanding healthcare infrastructure, and increasing demand from various medical applications. Strategic acquisitions, innovative product development, and expansion into untapped markets present lucrative opportunities for market players. The focus on improved biocompatibility, integration of smart technologies, and emphasis on single-use devices are expected to further shape the market landscape.
Stopcocks and Manifolds Segmentation
-
1. Application
- 1.1. Hospitals & Clinics
- 1.2. Ambulatory Care Centers
- 1.3. Other
-
2. Types
- 2.1. Stopcocks
- 2.2. Stopcock Manifolds
Stopcocks and Manifolds Segmentation By Geography
-
1. North America
- 1.1. United States
- 1.2. Canada
- 1.3. Mexico
-
2. South America
- 2.1. Brazil
- 2.2. Argentina
- 2.3. Rest of South America
-
3. Europe
- 3.1. United Kingdom
- 3.2. Germany
- 3.3. France
- 3.4. Italy
- 3.5. Spain
- 3.6. Russia
- 3.7. Benelux
- 3.8. Nordics
- 3.9. Rest of Europe
-
4. Middle East & Africa
- 4.1. Turkey
- 4.2. Israel
- 4.3. GCC
- 4.4. North Africa
- 4.5. South Africa
- 4.6. Rest of Middle East & Africa
-
5. Asia Pacific
- 5.1. China
- 5.2. India
- 5.3. Japan
- 5.4. South Korea
- 5.5. ASEAN
- 5.6. Oceania
- 5.7. Rest of Asia Pacific
Stopcocks and Manifolds REPORT HIGHLIGHTS
| Aspects | Details |
|---|---|
| Study Period | 2019-2033 |
| Base Year | 2024 |
| Estimated Year | 2025 |
| Forecast Period | 2025-2033 |
| Historical Period | 2019-2024 |
| Growth Rate | CAGR of XX% from 2019-2033 |
| Segmentation |
|
Table of Contents
- 1. Introduction
- 1.1. Research Scope
- 1.2. Market Segmentation
- 1.3. Research Methodology
- 1.4. Definitions and Assumptions
- 2. Executive Summary
- 2.1. Introduction
- 3. Market Dynamics
- 3.1. Introduction
- 3.2. Market Drivers
- 3.3. Market Restrains
- 3.4. Market Trends
- 4. Market Factor Analysis
- 4.1. Porters Five Forces
- 4.2. Supply/Value Chain
- 4.3. PESTEL analysis
- 4.4. Market Entropy
- 4.5. Patent/Trademark Analysis
- 5. Global Stopcocks and Manifolds Analysis, Insights and Forecast, 2019-2031
- 5.1. Market Analysis, Insights and Forecast - by Application
- 5.1.1. Hospitals & Clinics
- 5.1.2. Ambulatory Care Centers
- 5.1.3. Other
- 5.2. Market Analysis, Insights and Forecast - by Types
- 5.2.1. Stopcocks
- 5.2.2. Stopcock Manifolds
- 5.3. Market Analysis, Insights and Forecast - by Region
- 5.3.1. North America
- 5.3.2. South America
- 5.3.3. Europe
- 5.3.4. Middle East & Africa
- 5.3.5. Asia Pacific
- 5.1. Market Analysis, Insights and Forecast - by Application
- 6. North America Stopcocks and Manifolds Analysis, Insights and Forecast, 2019-2031
- 6.1. Market Analysis, Insights and Forecast - by Application
- 6.1.1. Hospitals & Clinics
- 6.1.2. Ambulatory Care Centers
- 6.1.3. Other
- 6.2. Market Analysis, Insights and Forecast - by Types
- 6.2.1. Stopcocks
- 6.2.2. Stopcock Manifolds
- 6.1. Market Analysis, Insights and Forecast - by Application
- 7. South America Stopcocks and Manifolds Analysis, Insights and Forecast, 2019-2031
- 7.1. Market Analysis, Insights and Forecast - by Application
- 7.1.1. Hospitals & Clinics
- 7.1.2. Ambulatory Care Centers
- 7.1.3. Other
- 7.2. Market Analysis, Insights and Forecast - by Types
- 7.2.1. Stopcocks
- 7.2.2. Stopcock Manifolds
- 7.1. Market Analysis, Insights and Forecast - by Application
- 8. Europe Stopcocks and Manifolds Analysis, Insights and Forecast, 2019-2031
- 8.1. Market Analysis, Insights and Forecast - by Application
- 8.1.1. Hospitals & Clinics
- 8.1.2. Ambulatory Care Centers
- 8.1.3. Other
- 8.2. Market Analysis, Insights and Forecast - by Types
- 8.2.1. Stopcocks
- 8.2.2. Stopcock Manifolds
- 8.1. Market Analysis, Insights and Forecast - by Application
- 9. Middle East & Africa Stopcocks and Manifolds Analysis, Insights and Forecast, 2019-2031
- 9.1. Market Analysis, Insights and Forecast - by Application
- 9.1.1. Hospitals & Clinics
- 9.1.2. Ambulatory Care Centers
- 9.1.3. Other
- 9.2. Market Analysis, Insights and Forecast - by Types
- 9.2.1. Stopcocks
- 9.2.2. Stopcock Manifolds
- 9.1. Market Analysis, Insights and Forecast - by Application
- 10. Asia Pacific Stopcocks and Manifolds Analysis, Insights and Forecast, 2019-2031
- 10.1. Market Analysis, Insights and Forecast - by Application
- 10.1.1. Hospitals & Clinics
- 10.1.2. Ambulatory Care Centers
- 10.1.3. Other
- 10.2. Market Analysis, Insights and Forecast - by Types
- 10.2.1. Stopcocks
- 10.2.2. Stopcock Manifolds
- 10.1. Market Analysis, Insights and Forecast - by Application
- 11. Competitive Analysis
- 11.1. Global Market Share Analysis 2024
- 11.2. Company Profiles
- 11.2.1 B. Braun
- 11.2.1.1. Overview
- 11.2.1.2. Products
- 11.2.1.3. SWOT Analysis
- 11.2.1.4. Recent Developments
- 11.2.1.5. Financials (Based on Availability)
- 11.2.2 BD
- 11.2.2.1. Overview
- 11.2.2.2. Products
- 11.2.2.3. SWOT Analysis
- 11.2.2.4. Recent Developments
- 11.2.2.5. Financials (Based on Availability)
- 11.2.3 Baxter
- 11.2.3.1. Overview
- 11.2.3.2. Products
- 11.2.3.3. SWOT Analysis
- 11.2.3.4. Recent Developments
- 11.2.3.5. Financials (Based on Availability)
- 11.2.4 Codan
- 11.2.4.1. Overview
- 11.2.4.2. Products
- 11.2.4.3. SWOT Analysis
- 11.2.4.4. Recent Developments
- 11.2.4.5. Financials (Based on Availability)
- 11.2.5 Vogt Medical
- 11.2.5.1. Overview
- 11.2.5.2. Products
- 11.2.5.3. SWOT Analysis
- 11.2.5.4. Recent Developments
- 11.2.5.5. Financials (Based on Availability)
- 11.2.6 ICU Medical
- 11.2.6.1. Overview
- 11.2.6.2. Products
- 11.2.6.3. SWOT Analysis
- 11.2.6.4. Recent Developments
- 11.2.6.5. Financials (Based on Availability)
- 11.2.7 Smiths Medical
- 11.2.7.1. Overview
- 11.2.7.2. Products
- 11.2.7.3. SWOT Analysis
- 11.2.7.4. Recent Developments
- 11.2.7.5. Financials (Based on Availability)
- 11.2.8 JCM MED
- 11.2.8.1. Overview
- 11.2.8.2. Products
- 11.2.8.3. SWOT Analysis
- 11.2.8.4. Recent Developments
- 11.2.8.5. Financials (Based on Availability)
- 11.2.9 Nordson Medical
- 11.2.9.1. Overview
- 11.2.9.2. Products
- 11.2.9.3. SWOT Analysis
- 11.2.9.4. Recent Developments
- 11.2.9.5. Financials (Based on Availability)
- 11.2.10 Elcam Medical
- 11.2.10.1. Overview
- 11.2.10.2. Products
- 11.2.10.3. SWOT Analysis
- 11.2.10.4. Recent Developments
- 11.2.10.5. Financials (Based on Availability)
- 11.2.11 Argon Medical
- 11.2.11.1. Overview
- 11.2.11.2. Products
- 11.2.11.3. SWOT Analysis
- 11.2.11.4. Recent Developments
- 11.2.11.5. Financials (Based on Availability)
- 11.2.12 Suzhou Health Plastic
- 11.2.12.1. Overview
- 11.2.12.2. Products
- 11.2.12.3. SWOT Analysis
- 11.2.12.4. Recent Developments
- 11.2.12.5. Financials (Based on Availability)
- 11.2.13 Wuxi Bolcom
- 11.2.13.1. Overview
- 11.2.13.2. Products
- 11.2.13.3. SWOT Analysis
- 11.2.13.4. Recent Developments
- 11.2.13.5. Financials (Based on Availability)
- 11.2.14 Shanghai Yuxing
- 11.2.14.1. Overview
- 11.2.14.2. Products
- 11.2.14.3. SWOT Analysis
- 11.2.14.4. Recent Developments
- 11.2.14.5. Financials (Based on Availability)
- 11.2.1 B. Braun
List of Figures
- Figure 1: Global Stopcocks and Manifolds Revenue Breakdown (million, %) by Region 2024 & 2032
- Figure 2: Global Stopcocks and Manifolds Volume Breakdown (K, %) by Region 2024 & 2032
- Figure 3: North America Stopcocks and Manifolds Revenue (million), by Application 2024 & 2032
- Figure 4: North America Stopcocks and Manifolds Volume (K), by Application 2024 & 2032
- Figure 5: North America Stopcocks and Manifolds Revenue Share (%), by Application 2024 & 2032
- Figure 6: North America Stopcocks and Manifolds Volume Share (%), by Application 2024 & 2032
- Figure 7: North America Stopcocks and Manifolds Revenue (million), by Types 2024 & 2032
- Figure 8: North America Stopcocks and Manifolds Volume (K), by Types 2024 & 2032
- Figure 9: North America Stopcocks and Manifolds Revenue Share (%), by Types 2024 & 2032
- Figure 10: North America Stopcocks and Manifolds Volume Share (%), by Types 2024 & 2032
- Figure 11: North America Stopcocks and Manifolds Revenue (million), by Country 2024 & 2032
- Figure 12: North America Stopcocks and Manifolds Volume (K), by Country 2024 & 2032
- Figure 13: North America Stopcocks and Manifolds Revenue Share (%), by Country 2024 & 2032
- Figure 14: North America Stopcocks and Manifolds Volume Share (%), by Country 2024 & 2032
- Figure 15: South America Stopcocks and Manifolds Revenue (million), by Application 2024 & 2032
- Figure 16: South America Stopcocks and Manifolds Volume (K), by Application 2024 & 2032
- Figure 17: South America Stopcocks and Manifolds Revenue Share (%), by Application 2024 & 2032
- Figure 18: South America Stopcocks and Manifolds Volume Share (%), by Application 2024 & 2032
- Figure 19: South America Stopcocks and Manifolds Revenue (million), by Types 2024 & 2032
- Figure 20: South America Stopcocks and Manifolds Volume (K), by Types 2024 & 2032
- Figure 21: South America Stopcocks and Manifolds Revenue Share (%), by Types 2024 & 2032
- Figure 22: South America Stopcocks and Manifolds Volume Share (%), by Types 2024 & 2032
- Figure 23: South America Stopcocks and Manifolds Revenue (million), by Country 2024 & 2032
- Figure 24: South America Stopcocks and Manifolds Volume (K), by Country 2024 & 2032
- Figure 25: South America Stopcocks and Manifolds Revenue Share (%), by Country 2024 & 2032
- Figure 26: South America Stopcocks and Manifolds Volume Share (%), by Country 2024 & 2032
- Figure 27: Europe Stopcocks and Manifolds Revenue (million), by Application 2024 & 2032
- Figure 28: Europe Stopcocks and Manifolds Volume (K), by Application 2024 & 2032
- Figure 29: Europe Stopcocks and Manifolds Revenue Share (%), by Application 2024 & 2032
- Figure 30: Europe Stopcocks and Manifolds Volume Share (%), by Application 2024 & 2032
- Figure 31: Europe Stopcocks and Manifolds Revenue (million), by Types 2024 & 2032
- Figure 32: Europe Stopcocks and Manifolds Volume (K), by Types 2024 & 2032
- Figure 33: Europe Stopcocks and Manifolds Revenue Share (%), by Types 2024 & 2032
- Figure 34: Europe Stopcocks and Manifolds Volume Share (%), by Types 2024 & 2032
- Figure 35: Europe Stopcocks and Manifolds Revenue (million), by Country 2024 & 2032
- Figure 36: Europe Stopcocks and Manifolds Volume (K), by Country 2024 & 2032
- Figure 37: Europe Stopcocks and Manifolds Revenue Share (%), by Country 2024 & 2032
- Figure 38: Europe Stopcocks and Manifolds Volume Share (%), by Country 2024 & 2032
- Figure 39: Middle East & Africa Stopcocks and Manifolds Revenue (million), by Application 2024 & 2032
- Figure 40: Middle East & Africa Stopcocks and Manifolds Volume (K), by Application 2024 & 2032
- Figure 41: Middle East & Africa Stopcocks and Manifolds Revenue Share (%), by Application 2024 & 2032
- Figure 42: Middle East & Africa Stopcocks and Manifolds Volume Share (%), by Application 2024 & 2032
- Figure 43: Middle East & Africa Stopcocks and Manifolds Revenue (million), by Types 2024 & 2032
- Figure 44: Middle East & Africa Stopcocks and Manifolds Volume (K), by Types 2024 & 2032
- Figure 45: Middle East & Africa Stopcocks and Manifolds Revenue Share (%), by Types 2024 & 2032
- Figure 46: Middle East & Africa Stopcocks and Manifolds Volume Share (%), by Types 2024 & 2032
- Figure 47: Middle East & Africa Stopcocks and Manifolds Revenue (million), by Country 2024 & 2032
- Figure 48: Middle East & Africa Stopcocks and Manifolds Volume (K), by Country 2024 & 2032
- Figure 49: Middle East & Africa Stopcocks and Manifolds Revenue Share (%), by Country 2024 & 2032
- Figure 50: Middle East & Africa Stopcocks and Manifolds Volume Share (%), by Country 2024 & 2032
- Figure 51: Asia Pacific Stopcocks and Manifolds Revenue (million), by Application 2024 & 2032
- Figure 52: Asia Pacific Stopcocks and Manifolds Volume (K), by Application 2024 & 2032
- Figure 53: Asia Pacific Stopcocks and Manifolds Revenue Share (%), by Application 2024 & 2032
- Figure 54: Asia Pacific Stopcocks and Manifolds Volume Share (%), by Application 2024 & 2032
- Figure 55: Asia Pacific Stopcocks and Manifolds Revenue (million), by Types 2024 & 2032
- Figure 56: Asia Pacific Stopcocks and Manifolds Volume (K), by Types 2024 & 2032
- Figure 57: Asia Pacific Stopcocks and Manifolds Revenue Share (%), by Types 2024 & 2032
- Figure 58: Asia Pacific Stopcocks and Manifolds Volume Share (%), by Types 2024 & 2032
- Figure 59: Asia Pacific Stopcocks and Manifolds Revenue (million), by Country 2024 & 2032
- Figure 60: Asia Pacific Stopcocks and Manifolds Volume (K), by Country 2024 & 2032
- Figure 61: Asia Pacific Stopcocks and Manifolds Revenue Share (%), by Country 2024 & 2032
- Figure 62: Asia Pacific Stopcocks and Manifolds Volume Share (%), by Country 2024 & 2032
List of Tables
- Table 1: Global Stopcocks and Manifolds Revenue million Forecast, by Region 2019 & 2032
- Table 2: Global Stopcocks and Manifolds Volume K Forecast, by Region 2019 & 2032
- Table 3: Global Stopcocks and Manifolds Revenue million Forecast, by Application 2019 & 2032
- Table 4: Global Stopcocks and Manifolds Volume K Forecast, by Application 2019 & 2032
- Table 5: Global Stopcocks and Manifolds Revenue million Forecast, by Types 2019 & 2032
- Table 6: Global Stopcocks and Manifolds Volume K Forecast, by Types 2019 & 2032
- Table 7: Global Stopcocks and Manifolds Revenue million Forecast, by Region 2019 & 2032
- Table 8: Global Stopcocks and Manifolds Volume K Forecast, by Region 2019 & 2032
- Table 9: Global Stopcocks and Manifolds Revenue million Forecast, by Application 2019 & 2032
- Table 10: Global Stopcocks and Manifolds Volume K Forecast, by Application 2019 & 2032
- Table 11: Global Stopcocks and Manifolds Revenue million Forecast, by Types 2019 & 2032
- Table 12: Global Stopcocks and Manifolds Volume K Forecast, by Types 2019 & 2032
- Table 13: Global Stopcocks and Manifolds Revenue million Forecast, by Country 2019 & 2032
- Table 14: Global Stopcocks and Manifolds Volume K Forecast, by Country 2019 & 2032
- Table 15: United States Stopcocks and Manifolds Revenue (million) Forecast, by Application 2019 & 2032
- Table 16: United States Stopcocks and Manifolds Volume (K) Forecast, by Application 2019 & 2032
- Table 17: Canada Stopcocks and Manifolds Revenue (million) Forecast, by Application 2019 & 2032
- Table 18: Canada Stopcocks and Manifolds Volume (K) Forecast, by Application 2019 & 2032
- Table 19: Mexico Stopcocks and Manifolds Revenue (million) Forecast, by Application 2019 & 2032
- Table 20: Mexico Stopcocks and Manifolds Volume (K) Forecast, by Application 2019 & 2032
- Table 21: Global Stopcocks and Manifolds Revenue million Forecast, by Application 2019 & 2032
- Table 22: Global Stopcocks and Manifolds Volume K Forecast, by Application 2019 & 2032
- Table 23: Global Stopcocks and Manifolds Revenue million Forecast, by Types 2019 & 2032
- Table 24: Global Stopcocks and Manifolds Volume K Forecast, by Types 2019 & 2032
- Table 25: Global Stopcocks and Manifolds Revenue million Forecast, by Country 2019 & 2032
- Table 26: Global Stopcocks and Manifolds Volume K Forecast, by Country 2019 & 2032
- Table 27: Brazil Stopcocks and Manifolds Revenue (million) Forecast, by Application 2019 & 2032
- Table 28: Brazil Stopcocks and Manifolds Volume (K) Forecast, by Application 2019 & 2032
- Table 29: Argentina Stopcocks and Manifolds Revenue (million) Forecast, by Application 2019 & 2032
- Table 30: Argentina Stopcocks and Manifolds Volume (K) Forecast, by Application 2019 & 2032
- Table 31: Rest of South America Stopcocks and Manifolds Revenue (million) Forecast, by Application 2019 & 2032
- Table 32: Rest of South America Stopcocks and Manifolds Volume (K) Forecast, by Application 2019 & 2032
- Table 33: Global Stopcocks and Manifolds Revenue million Forecast, by Application 2019 & 2032
- Table 34: Global Stopcocks and Manifolds Volume K Forecast, by Application 2019 & 2032
- Table 35: Global Stopcocks and Manifolds Revenue million Forecast, by Types 2019 & 2032
- Table 36: Global Stopcocks and Manifolds Volume K Forecast, by Types 2019 & 2032
- Table 37: Global Stopcocks and Manifolds Revenue million Forecast, by Country 2019 & 2032
- Table 38: Global Stopcocks and Manifolds Volume K Forecast, by Country 2019 & 2032
- Table 39: United Kingdom Stopcocks and Manifolds Revenue (million) Forecast, by Application 2019 & 2032
- Table 40: United Kingdom Stopcocks and Manifolds Volume (K) Forecast, by Application 2019 & 2032
- Table 41: Germany Stopcocks and Manifolds Revenue (million) Forecast, by Application 2019 & 2032
- Table 42: Germany Stopcocks and Manifolds Volume (K) Forecast, by Application 2019 & 2032
- Table 43: France Stopcocks and Manifolds Revenue (million) Forecast, by Application 2019 & 2032
- Table 44: France Stopcocks and Manifolds Volume (K) Forecast, by Application 2019 & 2032
- Table 45: Italy Stopcocks and Manifolds Revenue (million) Forecast, by Application 2019 & 2032
- Table 46: Italy Stopcocks and Manifolds Volume (K) Forecast, by Application 2019 & 2032
- Table 47: Spain Stopcocks and Manifolds Revenue (million) Forecast, by Application 2019 & 2032
- Table 48: Spain Stopcocks and Manifolds Volume (K) Forecast, by Application 2019 & 2032
- Table 49: Russia Stopcocks and Manifolds Revenue (million) Forecast, by Application 2019 & 2032
- Table 50: Russia Stopcocks and Manifolds Volume (K) Forecast, by Application 2019 & 2032
- Table 51: Benelux Stopcocks and Manifolds Revenue (million) Forecast, by Application 2019 & 2032
- Table 52: Benelux Stopcocks and Manifolds Volume (K) Forecast, by Application 2019 & 2032
- Table 53: Nordics Stopcocks and Manifolds Revenue (million) Forecast, by Application 2019 & 2032
- Table 54: Nordics Stopcocks and Manifolds Volume (K) Forecast, by Application 2019 & 2032
- Table 55: Rest of Europe Stopcocks and Manifolds Revenue (million) Forecast, by Application 2019 & 2032
- Table 56: Rest of Europe Stopcocks and Manifolds Volume (K) Forecast, by Application 2019 & 2032
- Table 57: Global Stopcocks and Manifolds Revenue million Forecast, by Application 2019 & 2032
- Table 58: Global Stopcocks and Manifolds Volume K Forecast, by Application 2019 & 2032
- Table 59: Global Stopcocks and Manifolds Revenue million Forecast, by Types 2019 & 2032
- Table 60: Global Stopcocks and Manifolds Volume K Forecast, by Types 2019 & 2032
- Table 61: Global Stopcocks and Manifolds Revenue million Forecast, by Country 2019 & 2032
- Table 62: Global Stopcocks and Manifolds Volume K Forecast, by Country 2019 & 2032
- Table 63: Turkey Stopcocks and Manifolds Revenue (million) Forecast, by Application 2019 & 2032
- Table 64: Turkey Stopcocks and Manifolds Volume (K) Forecast, by Application 2019 & 2032
- Table 65: Israel Stopcocks and Manifolds Revenue (million) Forecast, by Application 2019 & 2032
- Table 66: Israel Stopcocks and Manifolds Volume (K) Forecast, by Application 2019 & 2032
- Table 67: GCC Stopcocks and Manifolds Revenue (million) Forecast, by Application 2019 & 2032
- Table 68: GCC Stopcocks and Manifolds Volume (K) Forecast, by Application 2019 & 2032
- Table 69: North Africa Stopcocks and Manifolds Revenue (million) Forecast, by Application 2019 & 2032
- Table 70: North Africa Stopcocks and Manifolds Volume (K) Forecast, by Application 2019 & 2032
- Table 71: South Africa Stopcocks and Manifolds Revenue (million) Forecast, by Application 2019 & 2032
- Table 72: South Africa Stopcocks and Manifolds Volume (K) Forecast, by Application 2019 & 2032
- Table 73: Rest of Middle East & Africa Stopcocks and Manifolds Revenue (million) Forecast, by Application 2019 & 2032
- Table 74: Rest of Middle East & Africa Stopcocks and Manifolds Volume (K) Forecast, by Application 2019 & 2032
- Table 75: Global Stopcocks and Manifolds Revenue million Forecast, by Application 2019 & 2032
- Table 76: Global Stopcocks and Manifolds Volume K Forecast, by Application 2019 & 2032
- Table 77: Global Stopcocks and Manifolds Revenue million Forecast, by Types 2019 & 2032
- Table 78: Global Stopcocks and Manifolds Volume K Forecast, by Types 2019 & 2032
- Table 79: Global Stopcocks and Manifolds Revenue million Forecast, by Country 2019 & 2032
- Table 80: Global Stopcocks and Manifolds Volume K Forecast, by Country 2019 & 2032
- Table 81: China Stopcocks and Manifolds Revenue (million) Forecast, by Application 2019 & 2032
- Table 82: China Stopcocks and Manifolds Volume (K) Forecast, by Application 2019 & 2032
- Table 83: India Stopcocks and Manifolds Revenue (million) Forecast, by Application 2019 & 2032
- Table 84: India Stopcocks and Manifolds Volume (K) Forecast, by Application 2019 & 2032
- Table 85: Japan Stopcocks and Manifolds Revenue (million) Forecast, by Application 2019 & 2032
- Table 86: Japan Stopcocks and Manifolds Volume (K) Forecast, by Application 2019 & 2032
- Table 87: South Korea Stopcocks and Manifolds Revenue (million) Forecast, by Application 2019 & 2032
- Table 88: South Korea Stopcocks and Manifolds Volume (K) Forecast, by Application 2019 & 2032
- Table 89: ASEAN Stopcocks and Manifolds Revenue (million) Forecast, by Application 2019 & 2032
- Table 90: ASEAN Stopcocks and Manifolds Volume (K) Forecast, by Application 2019 & 2032
- Table 91: Oceania Stopcocks and Manifolds Revenue (million) Forecast, by Application 2019 & 2032
- Table 92: Oceania Stopcocks and Manifolds Volume (K) Forecast, by Application 2019 & 2032
- Table 93: Rest of Asia Pacific Stopcocks and Manifolds Revenue (million) Forecast, by Application 2019 & 2032
- Table 94: Rest of Asia Pacific Stopcocks and Manifolds Volume (K) Forecast, by Application 2019 & 2032
Frequently Asked Questions
1. What is the projected Compound Annual Growth Rate (CAGR) of the Stopcocks and Manifolds?
The projected CAGR is approximately XX%.
2. Which companies are prominent players in the Stopcocks and Manifolds?
Key companies in the market include B. Braun, BD, Baxter, Codan, Vogt Medical, ICU Medical, Smiths Medical, JCM MED, Nordson Medical, Elcam Medical, Argon Medical, Suzhou Health Plastic, Wuxi Bolcom, Shanghai Yuxing.
3. What are the main segments of the Stopcocks and Manifolds?
The market segments include Application, Types.
4. Can you provide details about the market size?
The market size is estimated to be USD XXX million as of 2022.
5. What are some drivers contributing to market growth?
N/A
6. What are the notable trends driving market growth?
N/A
7. Are there any restraints impacting market growth?
N/A
8. Can you provide examples of recent developments in the market?
N/A
9. What pricing options are available for accessing the report?
Pricing options include single-user, multi-user, and enterprise licenses priced at USD 4350.00, USD 6525.00, and USD 8700.00 respectively.
10. Is the market size provided in terms of value or volume?
The market size is provided in terms of value, measured in million and volume, measured in K.
11. Are there any specific market keywords associated with the report?
Yes, the market keyword associated with the report is "Stopcocks and Manifolds," which aids in identifying and referencing the specific market segment covered.
12. How do I determine which pricing option suits my needs best?
The pricing options vary based on user requirements and access needs. Individual users may opt for single-user licenses, while businesses requiring broader access may choose multi-user or enterprise licenses for cost-effective access to the report.
13. Are there any additional resources or data provided in the Stopcocks and Manifolds report?
While the report offers comprehensive insights, it's advisable to review the specific contents or supplementary materials provided to ascertain if additional resources or data are available.
14. How can I stay updated on further developments or reports in the Stopcocks and Manifolds?
To stay informed about further developments, trends, and reports in the Stopcocks and Manifolds, consider subscribing to industry newsletters, following relevant companies and organizations, or regularly checking reputable industry news sources and publications.
Methodology
Step 1 - Identification of Relevant Samples Size from Population Database


Step 2 - Approaches for Defining Global Market Size (Value, Volume* & Price*)

Note*: In applicable scenarios
Step 3 - Data Sources
Primary Research
- Web Analytics
- Survey Reports
- Research Institute
- Latest Research Reports
- Opinion Leaders
Secondary Research
- Annual Reports
- White Paper
- Latest Press Release
- Industry Association
- Paid Database
- Investor Presentations

Step 4 - Data Triangulation
Involves using different sources of information in order to increase the validity of a study
These sources are likely to be stakeholders in a program - participants, other researchers, program staff, other community members, and so on.
Then we put all data in single framework & apply various statistical tools to find out the dynamic on the market.
During the analysis stage, feedback from the stakeholder groups would be compared to determine areas of agreement as well as areas of divergence


