

Key Insights
The global food fibers market, projected to reach $10.04 billion by 2025, is anticipated to expand at a compound annual growth rate (CAGR) of 9.75% from 2025 to 2033. This growth is propelled by increasing consumer focus on digestive health and weight management, driving demand for fiber-rich foods and supplements. Growing awareness of fiber's role in reducing the risk of chronic diseases like type 2 diabetes and cardiovascular conditions further stimulates the market. Innovations in functional foods and beverages fortified with both soluble and insoluble fibers, alongside pharmaceutical applications for therapeutic formulations, are key growth drivers. Despite challenges such as raw material price volatility and regulatory complexities, the market presents significant opportunities across various applications and regions.
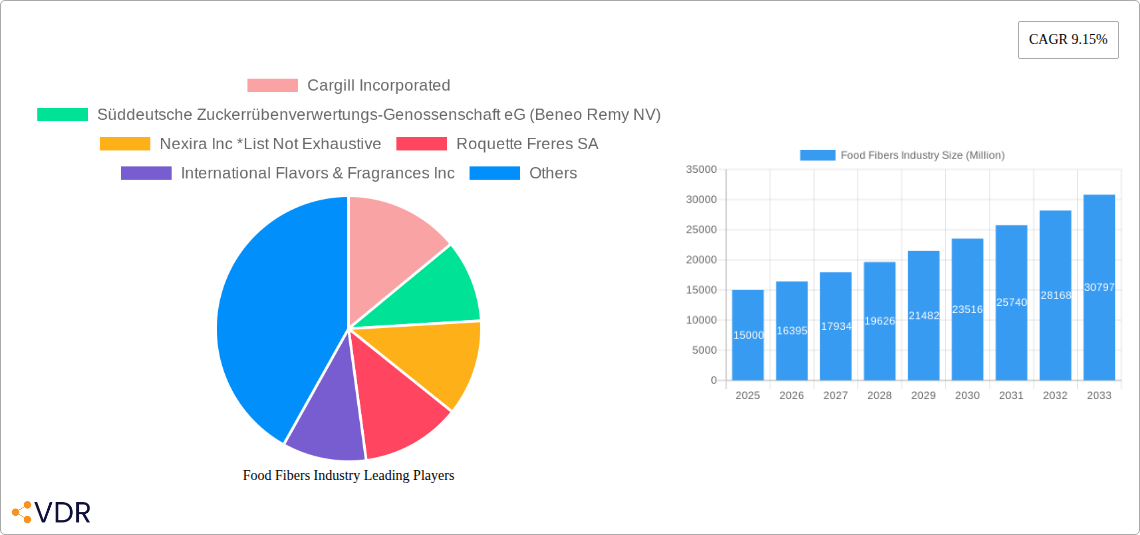
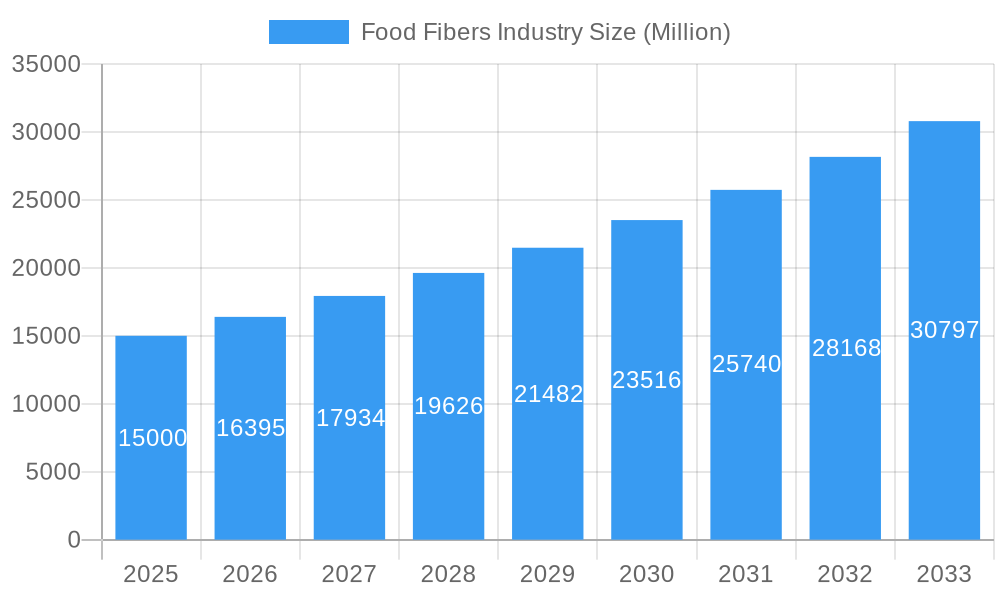
Food Fibers Industry Market Size (In Billion)
The food and beverage sector leads market applications, followed by dietary supplements and pharmaceuticals. Soluble fibers are projected for faster growth due to their benefits in blood sugar control and cholesterol reduction. North America and Europe currently dominate the market, supported by high consumer awareness and advanced food processing. The Asia-Pacific region is expected to experience significant expansion, driven by increasing disposable incomes, evolving lifestyles, and heightened health consciousness. Key industry players including Cargill, Beneo, Nexira, Roquette, and Ingredion are focused on continuous innovation and portfolio expansion to address the rising demand for diverse food fiber solutions. The forecast period (2025-2033) indicates sustained growth, influenced by persistent consumer demand, ongoing industry innovation, and market penetration in emerging economies.
Food Fibers Industry Company Market Share
Food Fibers Industry Market Report: 2019-2033
This comprehensive report provides an in-depth analysis of the Food Fibers Industry, encompassing market dynamics, growth trends, regional dominance, product landscapes, and key player strategies. With a focus on the parent market (Dietary Supplements and Food Ingredients) and child markets (Soluble and Insoluble Fibers), this report offers actionable insights for industry professionals, investors, and stakeholders. The study period spans 2019-2033, with 2025 as the base year and estimated year.
Study Period: 2019–2033 Base Year: 2025 Estimated Year: 2025 Forecast Period: 2025–2033 Historical Period: 2019–2024
Food Fibers Industry Market Dynamics & Structure
The global food fibers market, valued at xx Million in 2024, exhibits a moderately consolidated structure with key players holding significant market share. Technological innovations, particularly in extraction and processing techniques, are driving growth. Stringent regulatory frameworks regarding food safety and labeling influence product development and market access. Competitive substitutes, such as synthetic fibers, pose a challenge, but the increasing consumer preference for natural and functional foods mitigates this threat. End-user demographics, particularly the growing health-conscious population and rising demand for functional foods, are significant growth drivers. Mergers and acquisitions (M&A) activity is noteworthy, reflecting industry consolidation and expansion strategies.
- Market Concentration: Moderately consolidated, with top players holding xx% market share.
- Technological Innovation: Focus on efficient extraction, improved functionality, and sustainable sourcing.
- Regulatory Frameworks: Stringent food safety and labeling regulations impact market dynamics.
- Competitive Substitutes: Synthetic fibers pose a challenge, but natural preference remains strong.
- End-User Demographics: Health-conscious consumers and demand for functional foods fuel growth.
- M&A Trends: Significant M&A activity, reflecting industry consolidation and expansion. Total deal volume in 2022: xx Million.
Food Fibers Industry Growth Trends & Insights
The food fibers market demonstrates robust growth, driven by increasing consumer awareness of dietary fiber's health benefits and its incorporation into various food and beverage products. Market size evolution shows a significant increase from xx Million in 2019 to xx Million in 2024, with a projected CAGR of xx% during the forecast period (2025-2033). This growth is fueled by rising adoption rates in the food and beverage and dietary supplement segments, spurred by technological disruptions in extraction and processing, leading to more versatile and cost-effective fiber products. Consumer behavior is shifting towards healthier dietary choices, further accelerating demand.
Dominant Regions, Countries, or Segments in Food Fibers Industry
North America currently holds the leading position in the food fibers market, followed by Europe and Asia-Pacific. Within applications, the Food and Beverage segment dominates, driven by increasing demand for functional foods and fortified products. The Dietary Supplements segment also exhibits strong growth, reflecting the rising popularity of fiber supplements.
- Key Drivers in North America: Strong regulatory support, high consumer awareness, and a well-established food processing industry.
- Key Drivers in Europe: Stringent food safety regulations, high disposable incomes, and growing demand for natural ingredients.
- Key Drivers in Asia-Pacific: Rapid economic growth, increasing health awareness, and expanding food and beverage industries.
- Dominant Segment: Food and Beverage, accounting for xx% of market share in 2024. Projected to reach xx Million by 2033.
Food Fibers Industry Product Landscape
The food fibers market features a diverse product landscape, encompassing soluble and insoluble fibers from various sources. Innovations focus on improving fiber functionality (e.g., texture, solubility, and prebiotic properties) to enhance applications in food and beverage products. Technological advancements in extraction and processing techniques have resulted in higher yields and improved product quality, offering enhanced functionalities and better cost-effectiveness. Key selling propositions include health benefits (e.g., improved gut health, weight management), natural origin, and improved food product attributes.
Key Drivers, Barriers & Challenges in Food Fibers Industry
Key Drivers:
- Growing health consciousness and demand for functional foods.
- Technological advancements leading to cost-effective and improved fiber products.
- Increasing prevalence of chronic diseases associated with low fiber intake.
- Favorable government regulations and initiatives promoting dietary fiber consumption.
Challenges & Restraints:
- Fluctuations in raw material prices and supply chain disruptions.
- Stringent regulatory requirements for food and dietary supplements.
- Competition from synthetic fibers and other functional ingredients.
- Consumer perception and awareness of different fiber types and their benefits.
Emerging Opportunities in Food Fibers Industry
- Expansion into emerging markets with rising disposable incomes and health consciousness.
- Development of novel fiber-based products with enhanced functionalities and health benefits.
- Increasing use of food fibers in novel food applications such as meat alternatives and plant-based products.
- Strategic partnerships and collaborations to enhance product development and market reach.
Growth Accelerators in the Food Fibers Industry
Technological breakthroughs in fiber extraction and processing are creating new opportunities for product innovation and increased efficiency. Strategic partnerships between food ingredient manufacturers and food and beverage companies accelerate the adoption of food fibers in various applications. Expanding market reach into emerging economies presents significant growth potential.
Key Players Shaping the Food Fibers Industry Market
- Cargill Incorporated
- Süddeutsche Zuckerrübenverwertungs-Genossenschaft eG (Beneo Remy NV)
- Nexira Inc
- Roquette Freres SA
- International Flavors & Fragrances Inc
- Archer Daniels Midland Company
- Tate & Lyle PLC
- Kerry Group PLC
- Ingredion Incorporated
- J Rettenmaier & Söhne GmbH + Co KG
Notable Milestones in Food Fibers Industry Sector
- September 2022: Cargill announces the commercial introduction of a soluble corn fiber ingredient.
- April 2022: Tate & Lyle acquires Quantum Hi-Tech (Guangdong) Biological for USD 237 Million.
- January 2022: Kerry Group unveils a new facility in Jeddah, showcasing investment in the Middle East.
In-Depth Food Fibers Industry Market Outlook
The future of the food fibers market is bright, driven by sustained growth in the health and wellness sector, coupled with continuous innovation in product development and applications. Strategic partnerships, market expansions into untapped regions, and technological advancements in production and processing will continue to shape the market landscape. The potential for fiber-based products in novel food applications and dietary supplements remains substantial, promising significant market expansion and sustained growth in the coming years.
Food Fibers Industry Segmentation
-
1. Type
-
1.1. Soluble Fibers
- 1.1.1. Inulin
- 1.1.2. Pectin
- 1.1.3. Polydextrose
- 1.1.4. Beta-glucan
- 1.1.5. Other Soluble Fibers
-
1.2. Insoluble Fibers
- 1.2.1. Cellulose
- 1.2.2. Lignin
- 1.2.3. Hemicellulose
- 1.2.4. Chitin and Chitosan
- 1.2.5. Resistant Starch
- 1.2.6. Other Insoluble Fibers
-
1.1. Soluble Fibers
-
2. Application
-
2.1. Food and Beverage
- 2.1.1. Bakery and Confectionery
- 2.1.2. Dairy
- 2.1.3. Meat, Poultry, and Seafood
- 2.1.4. Beverages
- 2.1.5. Others
- 2.2. Dietary Supplements
- 2.3. Pharmaceuticals
-
2.1. Food and Beverage
Food Fibers Industry Segmentation By Geography
-
1. North America
- 1.1. United States
- 1.2. Canada
- 1.3. Mexico
- 1.4. Rest of North America
-
2. Europe
- 2.1. United Kingdom
- 2.2. France
- 2.3. Germany
- 2.4. Italy
- 2.5. Russia
- 2.6. Spain
- 2.7. Rest of Europe
-
3. Asia Pacific
- 3.1. China
- 3.2. Japan
- 3.3. Australia
- 3.4. India
- 3.5. Rest of Asia Pacific
-
4. South America
- 4.1. Brazil
- 4.2. Argentina
- 4.3. Rest of South America
-
5. Middle East and Africa
- 5.1. Saudi Arabia
- 5.2. South Africa
- 5.3. Rest of Middle East and Africa
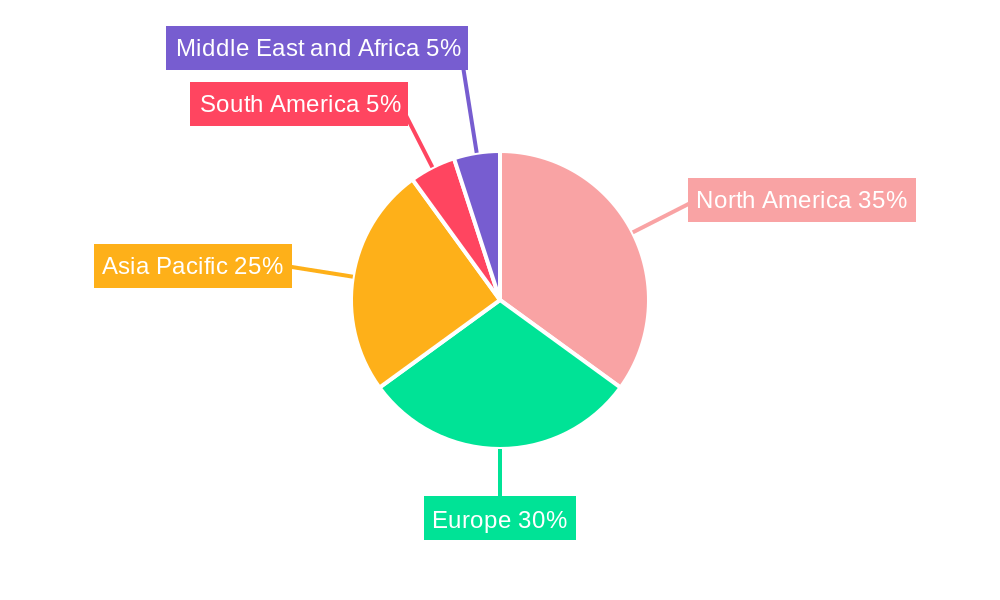
Food Fibers Industry Regional Market Share
Geographic Coverage of Food Fibers Industry
Food Fibers Industry REPORT HIGHLIGHTS
| Aspects | Details |
|---|---|
| Study Period | 2020-2034 |
| Base Year | 2025 |
| Estimated Year | 2026 |
| Forecast Period | 2026-2034 |
| Historical Period | 2020-2025 |
| Growth Rate | CAGR of 9.75% from 2020-2034 |
| Segmentation |
|
Table of Contents
- 1. Introduction
- 1.1. Research Scope
- 1.2. Market Segmentation
- 1.3. Research Objective
- 1.4. Definitions and Assumptions
- 2. Executive Summary
- 2.1. Market Snapshot
- 3. Market Dynamics
- 3.1. Market Drivers
- 3.2. Market Restrains
- 3.3. Market Trends
- 3.4. Market Opportunities
- 4. Market Factor Analysis
- 4.1. Porters Five Forces
- 4.1.1. Bargaining Power of Suppliers
- 4.1.2. Bargaining Power of Buyers
- 4.1.3. Threat of New Entrants
- 4.1.4. Threat of Substitutes
- 4.1.5. Competitive Rivalry
- 4.2. PESTEL analysis
- 4.3. BCG Analysis
- 4.3.1. Stars (High Growth, High Market Share)
- 4.3.2. Cash Cows (Low Growth, High Market Share)
- 4.3.3. Question Mark (High Growth, Low Market Share)
- 4.3.4. Dogs (Low Growth, Low Market Share)
- 4.4. Ansoff Matrix Analysis
- 4.5. Supply Chain Analysis
- 4.6. Regulatory Landscape
- 4.7. Current Market Potential and Opportunity Assessment (TAM–SAM–SOM Framework)
- 4.8. VDR Analyst Note
- 4.1. Porters Five Forces
- 5. Market Analysis, Insights and Forecast 2021-2033
- 5.1. Market Analysis, Insights and Forecast - by Type
- 5.1.1. Soluble Fibers
- 5.1.1.1. Inulin
- 5.1.1.2. Pectin
- 5.1.1.3. Polydextrose
- 5.1.1.4. Beta-glucan
- 5.1.1.5. Other Soluble Fibers
- 5.1.2. Insoluble Fibers
- 5.1.2.1. Cellulose
- 5.1.2.2. Lignin
- 5.1.2.3. Hemicellulose
- 5.1.2.4. Chitin and Chitosan
- 5.1.2.5. Resistant Starch
- 5.1.2.6. Other Insoluble Fibers
- 5.1.1. Soluble Fibers
- 5.2. Market Analysis, Insights and Forecast - by Application
- 5.2.1. Food and Beverage
- 5.2.1.1. Bakery and Confectionery
- 5.2.1.2. Dairy
- 5.2.1.3. Meat, Poultry, and Seafood
- 5.2.1.4. Beverages
- 5.2.1.5. Others
- 5.2.2. Dietary Supplements
- 5.2.3. Pharmaceuticals
- 5.2.1. Food and Beverage
- 5.3. Market Analysis, Insights and Forecast - by Region
- 5.3.1. North America
- 5.3.2. Europe
- 5.3.3. Asia Pacific
- 5.3.4. South America
- 5.3.5. Middle East and Africa
- 5.1. Market Analysis, Insights and Forecast - by Type
- 6. Global Food Fibers Industry Analysis, Insights and Forecast, 2021-2033
- 6.1. Market Analysis, Insights and Forecast - by Type
- 6.1.1. Soluble Fibers
- 6.1.1.1. Inulin
- 6.1.1.2. Pectin
- 6.1.1.3. Polydextrose
- 6.1.1.4. Beta-glucan
- 6.1.1.5. Other Soluble Fibers
- 6.1.2. Insoluble Fibers
- 6.1.2.1. Cellulose
- 6.1.2.2. Lignin
- 6.1.2.3. Hemicellulose
- 6.1.2.4. Chitin and Chitosan
- 6.1.2.5. Resistant Starch
- 6.1.2.6. Other Insoluble Fibers
- 6.1.1. Soluble Fibers
- 6.2. Market Analysis, Insights and Forecast - by Application
- 6.2.1. Food and Beverage
- 6.2.1.1. Bakery and Confectionery
- 6.2.1.2. Dairy
- 6.2.1.3. Meat, Poultry, and Seafood
- 6.2.1.4. Beverages
- 6.2.1.5. Others
- 6.2.2. Dietary Supplements
- 6.2.3. Pharmaceuticals
- 6.2.1. Food and Beverage
- 6.1. Market Analysis, Insights and Forecast - by Type
- 7. North America Food Fibers Industry Analysis, Insights and Forecast, 2021-2033
- 7.1. Market Analysis, Insights and Forecast - by Type
- 7.1.1. Soluble Fibers
- 7.1.1.1. Inulin
- 7.1.1.2. Pectin
- 7.1.1.3. Polydextrose
- 7.1.1.4. Beta-glucan
- 7.1.1.5. Other Soluble Fibers
- 7.1.2. Insoluble Fibers
- 7.1.2.1. Cellulose
- 7.1.2.2. Lignin
- 7.1.2.3. Hemicellulose
- 7.1.2.4. Chitin and Chitosan
- 7.1.2.5. Resistant Starch
- 7.1.2.6. Other Insoluble Fibers
- 7.1.1. Soluble Fibers
- 7.2. Market Analysis, Insights and Forecast - by Application
- 7.2.1. Food and Beverage
- 7.2.1.1. Bakery and Confectionery
- 7.2.1.2. Dairy
- 7.2.1.3. Meat, Poultry, and Seafood
- 7.2.1.4. Beverages
- 7.2.1.5. Others
- 7.2.2. Dietary Supplements
- 7.2.3. Pharmaceuticals
- 7.2.1. Food and Beverage
- 7.1. Market Analysis, Insights and Forecast - by Type
- 8. Europe Food Fibers Industry Analysis, Insights and Forecast, 2021-2033
- 8.1. Market Analysis, Insights and Forecast - by Type
- 8.1.1. Soluble Fibers
- 8.1.1.1. Inulin
- 8.1.1.2. Pectin
- 8.1.1.3. Polydextrose
- 8.1.1.4. Beta-glucan
- 8.1.1.5. Other Soluble Fibers
- 8.1.2. Insoluble Fibers
- 8.1.2.1. Cellulose
- 8.1.2.2. Lignin
- 8.1.2.3. Hemicellulose
- 8.1.2.4. Chitin and Chitosan
- 8.1.2.5. Resistant Starch
- 8.1.2.6. Other Insoluble Fibers
- 8.1.1. Soluble Fibers
- 8.2. Market Analysis, Insights and Forecast - by Application
- 8.2.1. Food and Beverage
- 8.2.1.1. Bakery and Confectionery
- 8.2.1.2. Dairy
- 8.2.1.3. Meat, Poultry, and Seafood
- 8.2.1.4. Beverages
- 8.2.1.5. Others
- 8.2.2. Dietary Supplements
- 8.2.3. Pharmaceuticals
- 8.2.1. Food and Beverage
- 8.1. Market Analysis, Insights and Forecast - by Type
- 9. Asia Pacific Food Fibers Industry Analysis, Insights and Forecast, 2021-2033
- 9.1. Market Analysis, Insights and Forecast - by Type
- 9.1.1. Soluble Fibers
- 9.1.1.1. Inulin
- 9.1.1.2. Pectin
- 9.1.1.3. Polydextrose
- 9.1.1.4. Beta-glucan
- 9.1.1.5. Other Soluble Fibers
- 9.1.2. Insoluble Fibers
- 9.1.2.1. Cellulose
- 9.1.2.2. Lignin
- 9.1.2.3. Hemicellulose
- 9.1.2.4. Chitin and Chitosan
- 9.1.2.5. Resistant Starch
- 9.1.2.6. Other Insoluble Fibers
- 9.1.1. Soluble Fibers
- 9.2. Market Analysis, Insights and Forecast - by Application
- 9.2.1. Food and Beverage
- 9.2.1.1. Bakery and Confectionery
- 9.2.1.2. Dairy
- 9.2.1.3. Meat, Poultry, and Seafood
- 9.2.1.4. Beverages
- 9.2.1.5. Others
- 9.2.2. Dietary Supplements
- 9.2.3. Pharmaceuticals
- 9.2.1. Food and Beverage
- 9.1. Market Analysis, Insights and Forecast - by Type
- 10. South America Food Fibers Industry Analysis, Insights and Forecast, 2021-2033
- 10.1. Market Analysis, Insights and Forecast - by Type
- 10.1.1. Soluble Fibers
- 10.1.1.1. Inulin
- 10.1.1.2. Pectin
- 10.1.1.3. Polydextrose
- 10.1.1.4. Beta-glucan
- 10.1.1.5. Other Soluble Fibers
- 10.1.2. Insoluble Fibers
- 10.1.2.1. Cellulose
- 10.1.2.2. Lignin
- 10.1.2.3. Hemicellulose
- 10.1.2.4. Chitin and Chitosan
- 10.1.2.5. Resistant Starch
- 10.1.2.6. Other Insoluble Fibers
- 10.1.1. Soluble Fibers
- 10.2. Market Analysis, Insights and Forecast - by Application
- 10.2.1. Food and Beverage
- 10.2.1.1. Bakery and Confectionery
- 10.2.1.2. Dairy
- 10.2.1.3. Meat, Poultry, and Seafood
- 10.2.1.4. Beverages
- 10.2.1.5. Others
- 10.2.2. Dietary Supplements
- 10.2.3. Pharmaceuticals
- 10.2.1. Food and Beverage
- 10.1. Market Analysis, Insights and Forecast - by Type
- 11. Middle East and Africa Food Fibers Industry Analysis, Insights and Forecast, 2021-2033
- 11.1. Market Analysis, Insights and Forecast - by Type
- 11.1.1. Soluble Fibers
- 11.1.1.1. Inulin
- 11.1.1.2. Pectin
- 11.1.1.3. Polydextrose
- 11.1.1.4. Beta-glucan
- 11.1.1.5. Other Soluble Fibers
- 11.1.2. Insoluble Fibers
- 11.1.2.1. Cellulose
- 11.1.2.2. Lignin
- 11.1.2.3. Hemicellulose
- 11.1.2.4. Chitin and Chitosan
- 11.1.2.5. Resistant Starch
- 11.1.2.6. Other Insoluble Fibers
- 11.1.1. Soluble Fibers
- 11.2. Market Analysis, Insights and Forecast - by Application
- 11.2.1. Food and Beverage
- 11.2.1.1. Bakery and Confectionery
- 11.2.1.2. Dairy
- 11.2.1.3. Meat, Poultry, and Seafood
- 11.2.1.4. Beverages
- 11.2.1.5. Others
- 11.2.2. Dietary Supplements
- 11.2.3. Pharmaceuticals
- 11.2.1. Food and Beverage
- 11.1. Market Analysis, Insights and Forecast - by Type
- 12. Competitive Analysis
- 12.1. Company Profiles
- 12.1.1 Cargill Incorporated
- 12.1.1.1. Company Overview
- 12.1.1.2. Products
- 12.1.1.3. Company Financials
- 12.1.1.4. SWOT Analysis
- 12.1.2 Süddeutsche Zuckerrübenverwertungs-Genossenschaft eG (Beneo Remy NV)
- 12.1.2.1. Company Overview
- 12.1.2.2. Products
- 12.1.2.3. Company Financials
- 12.1.2.4. SWOT Analysis
- 12.1.3 Nexira Inc *List Not Exhaustive
- 12.1.3.1. Company Overview
- 12.1.3.2. Products
- 12.1.3.3. Company Financials
- 12.1.3.4. SWOT Analysis
- 12.1.4 Roquette Freres SA
- 12.1.4.1. Company Overview
- 12.1.4.2. Products
- 12.1.4.3. Company Financials
- 12.1.4.4. SWOT Analysis
- 12.1.5 International Flavors & Fragrances Inc
- 12.1.5.1. Company Overview
- 12.1.5.2. Products
- 12.1.5.3. Company Financials
- 12.1.5.4. SWOT Analysis
- 12.1.6 Archer Daniels Midland Company
- 12.1.6.1. Company Overview
- 12.1.6.2. Products
- 12.1.6.3. Company Financials
- 12.1.6.4. SWOT Analysis
- 12.1.7 Tate & Lyle PLC
- 12.1.7.1. Company Overview
- 12.1.7.2. Products
- 12.1.7.3. Company Financials
- 12.1.7.4. SWOT Analysis
- 12.1.8 Kerry Group PLC
- 12.1.8.1. Company Overview
- 12.1.8.2. Products
- 12.1.8.3. Company Financials
- 12.1.8.4. SWOT Analysis
- 12.1.9 Ingredion Incorporated
- 12.1.9.1. Company Overview
- 12.1.9.2. Products
- 12.1.9.3. Company Financials
- 12.1.9.4. SWOT Analysis
- 12.1.10 J Rettenmaier & Söhne GmbH + Co KG
- 12.1.10.1. Company Overview
- 12.1.10.2. Products
- 12.1.10.3. Company Financials
- 12.1.10.4. SWOT Analysis
- 12.1.1 Cargill Incorporated
- 12.2. Market Entropy
- 12.2.1 Company's Key Areas Served
- 12.2.2 Recent Developments
- 12.3. Company Market Share Analysis 2025
- 12.3.1 Top 5 Companies Market Share Analysis
- 12.3.2 Top 3 Companies Market Share Analysis
- 12.4. List of Potential Customers
- 13. Research Methodology
List of Figures
- Figure 1: Global Food Fibers Industry Revenue Breakdown (billion, %) by Region 2025 & 2033
- Figure 2: North America Food Fibers Industry Revenue (billion), by Type 2025 & 2033
- Figure 3: North America Food Fibers Industry Revenue Share (%), by Type 2025 & 2033
- Figure 4: North America Food Fibers Industry Revenue (billion), by Application 2025 & 2033
- Figure 5: North America Food Fibers Industry Revenue Share (%), by Application 2025 & 2033
- Figure 6: North America Food Fibers Industry Revenue (billion), by Country 2025 & 2033
- Figure 7: North America Food Fibers Industry Revenue Share (%), by Country 2025 & 2033
- Figure 8: Europe Food Fibers Industry Revenue (billion), by Type 2025 & 2033
- Figure 9: Europe Food Fibers Industry Revenue Share (%), by Type 2025 & 2033
- Figure 10: Europe Food Fibers Industry Revenue (billion), by Application 2025 & 2033
- Figure 11: Europe Food Fibers Industry Revenue Share (%), by Application 2025 & 2033
- Figure 12: Europe Food Fibers Industry Revenue (billion), by Country 2025 & 2033
- Figure 13: Europe Food Fibers Industry Revenue Share (%), by Country 2025 & 2033
- Figure 14: Asia Pacific Food Fibers Industry Revenue (billion), by Type 2025 & 2033
- Figure 15: Asia Pacific Food Fibers Industry Revenue Share (%), by Type 2025 & 2033
- Figure 16: Asia Pacific Food Fibers Industry Revenue (billion), by Application 2025 & 2033
- Figure 17: Asia Pacific Food Fibers Industry Revenue Share (%), by Application 2025 & 2033
- Figure 18: Asia Pacific Food Fibers Industry Revenue (billion), by Country 2025 & 2033
- Figure 19: Asia Pacific Food Fibers Industry Revenue Share (%), by Country 2025 & 2033
- Figure 20: South America Food Fibers Industry Revenue (billion), by Type 2025 & 2033
- Figure 21: South America Food Fibers Industry Revenue Share (%), by Type 2025 & 2033
- Figure 22: South America Food Fibers Industry Revenue (billion), by Application 2025 & 2033
- Figure 23: South America Food Fibers Industry Revenue Share (%), by Application 2025 & 2033
- Figure 24: South America Food Fibers Industry Revenue (billion), by Country 2025 & 2033
- Figure 25: South America Food Fibers Industry Revenue Share (%), by Country 2025 & 2033
- Figure 26: Middle East and Africa Food Fibers Industry Revenue (billion), by Type 2025 & 2033
- Figure 27: Middle East and Africa Food Fibers Industry Revenue Share (%), by Type 2025 & 2033
- Figure 28: Middle East and Africa Food Fibers Industry Revenue (billion), by Application 2025 & 2033
- Figure 29: Middle East and Africa Food Fibers Industry Revenue Share (%), by Application 2025 & 2033
- Figure 30: Middle East and Africa Food Fibers Industry Revenue (billion), by Country 2025 & 2033
- Figure 31: Middle East and Africa Food Fibers Industry Revenue Share (%), by Country 2025 & 2033
List of Tables
- Table 1: Global Food Fibers Industry Revenue billion Forecast, by Type 2020 & 2033
- Table 2: Global Food Fibers Industry Revenue billion Forecast, by Application 2020 & 2033
- Table 3: Global Food Fibers Industry Revenue billion Forecast, by Region 2020 & 2033
- Table 4: Global Food Fibers Industry Revenue billion Forecast, by Type 2020 & 2033
- Table 5: Global Food Fibers Industry Revenue billion Forecast, by Application 2020 & 2033
- Table 6: Global Food Fibers Industry Revenue billion Forecast, by Country 2020 & 2033
- Table 7: United States Food Fibers Industry Revenue (billion) Forecast, by Application 2020 & 2033
- Table 8: Canada Food Fibers Industry Revenue (billion) Forecast, by Application 2020 & 2033
- Table 9: Mexico Food Fibers Industry Revenue (billion) Forecast, by Application 2020 & 2033
- Table 10: Rest of North America Food Fibers Industry Revenue (billion) Forecast, by Application 2020 & 2033
- Table 11: Global Food Fibers Industry Revenue billion Forecast, by Type 2020 & 2033
- Table 12: Global Food Fibers Industry Revenue billion Forecast, by Application 2020 & 2033
- Table 13: Global Food Fibers Industry Revenue billion Forecast, by Country 2020 & 2033
- Table 14: United Kingdom Food Fibers Industry Revenue (billion) Forecast, by Application 2020 & 2033
- Table 15: France Food Fibers Industry Revenue (billion) Forecast, by Application 2020 & 2033
- Table 16: Germany Food Fibers Industry Revenue (billion) Forecast, by Application 2020 & 2033
- Table 17: Italy Food Fibers Industry Revenue (billion) Forecast, by Application 2020 & 2033
- Table 18: Russia Food Fibers Industry Revenue (billion) Forecast, by Application 2020 & 2033
- Table 19: Spain Food Fibers Industry Revenue (billion) Forecast, by Application 2020 & 2033
- Table 20: Rest of Europe Food Fibers Industry Revenue (billion) Forecast, by Application 2020 & 2033
- Table 21: Global Food Fibers Industry Revenue billion Forecast, by Type 2020 & 2033
- Table 22: Global Food Fibers Industry Revenue billion Forecast, by Application 2020 & 2033
- Table 23: Global Food Fibers Industry Revenue billion Forecast, by Country 2020 & 2033
- Table 24: China Food Fibers Industry Revenue (billion) Forecast, by Application 2020 & 2033
- Table 25: Japan Food Fibers Industry Revenue (billion) Forecast, by Application 2020 & 2033
- Table 26: Australia Food Fibers Industry Revenue (billion) Forecast, by Application 2020 & 2033
- Table 27: India Food Fibers Industry Revenue (billion) Forecast, by Application 2020 & 2033
- Table 28: Rest of Asia Pacific Food Fibers Industry Revenue (billion) Forecast, by Application 2020 & 2033
- Table 29: Global Food Fibers Industry Revenue billion Forecast, by Type 2020 & 2033
- Table 30: Global Food Fibers Industry Revenue billion Forecast, by Application 2020 & 2033
- Table 31: Global Food Fibers Industry Revenue billion Forecast, by Country 2020 & 2033
- Table 32: Brazil Food Fibers Industry Revenue (billion) Forecast, by Application 2020 & 2033
- Table 33: Argentina Food Fibers Industry Revenue (billion) Forecast, by Application 2020 & 2033
- Table 34: Rest of South America Food Fibers Industry Revenue (billion) Forecast, by Application 2020 & 2033
- Table 35: Global Food Fibers Industry Revenue billion Forecast, by Type 2020 & 2033
- Table 36: Global Food Fibers Industry Revenue billion Forecast, by Application 2020 & 2033
- Table 37: Global Food Fibers Industry Revenue billion Forecast, by Country 2020 & 2033
- Table 38: Saudi Arabia Food Fibers Industry Revenue (billion) Forecast, by Application 2020 & 2033
- Table 39: South Africa Food Fibers Industry Revenue (billion) Forecast, by Application 2020 & 2033
- Table 40: Rest of Middle East and Africa Food Fibers Industry Revenue (billion) Forecast, by Application 2020 & 2033
Frequently Asked Questions
1. What is the projected Compound Annual Growth Rate (CAGR) of the Food Fibers Industry?
The projected CAGR is approximately 9.75%.
2. Which companies are prominent players in the Food Fibers Industry?
Key companies in the market include Cargill Incorporated, Süddeutsche Zuckerrübenverwertungs-Genossenschaft eG (Beneo Remy NV), Nexira Inc *List Not Exhaustive, Roquette Freres SA, International Flavors & Fragrances Inc, Archer Daniels Midland Company, Tate & Lyle PLC, Kerry Group PLC, Ingredion Incorporated, J Rettenmaier & Söhne GmbH + Co KG.
3. What are the main segments of the Food Fibers Industry?
The market segments include Type, Application.
4. Can you provide details about the market size?
The market size is estimated to be USD 10.04 billion as of 2022.
5. What are some drivers contributing to market growth?
Augmented demand for Natural Sweeteners; Rising Consumer Inclination Toward Clean Label and Organic Stevia.
6. What are the notable trends driving market growth?
Increasing Trend of Fiber Fortification in Food Industry.
7. Are there any restraints impacting market growth?
Side Effects and Challenges with Stevia.
8. Can you provide examples of recent developments in the market?
In September 2022, Cargill announced it would commercially introduce a soluble corn fiber ingredient in the coming year. As the component contains at least 80% fiber dry, it is possible to claim high fiber content in products. In addition to being a bulking agent, this soluble corn fiber is low in calories and has minimal effect on the texture and color of food.
9. What pricing options are available for accessing the report?
Pricing options include single-user, multi-user, and enterprise licenses priced at USD 4750, USD 5250, and USD 8750 respectively.
10. Is the market size provided in terms of value or volume?
The market size is provided in terms of value, measured in billion.
11. Are there any specific market keywords associated with the report?
Yes, the market keyword associated with the report is "Food Fibers Industry," which aids in identifying and referencing the specific market segment covered.
12. How do I determine which pricing option suits my needs best?
The pricing options vary based on user requirements and access needs. Individual users may opt for single-user licenses, while businesses requiring broader access may choose multi-user or enterprise licenses for cost-effective access to the report.
13. Are there any additional resources or data provided in the Food Fibers Industry report?
While the report offers comprehensive insights, it's advisable to review the specific contents or supplementary materials provided to ascertain if additional resources or data are available.
14. How can I stay updated on further developments or reports in the Food Fibers Industry?
To stay informed about further developments, trends, and reports in the Food Fibers Industry, consider subscribing to industry newsletters, following relevant companies and organizations, or regularly checking reputable industry news sources and publications.
Methodology
Step 1 - Identification of Relevant Samples Size from Population Database


Step 2 - Approaches for Defining Global Market Size (Value, Volume* & Price*)

Note*: In applicable scenarios
Step 3 - Data Sources
Primary Research
- Web Analytics
- Survey Reports
- Research Institute
- Latest Research Reports
- Opinion Leaders
Secondary Research
- Annual Reports
- White Paper
- Latest Press Release
- Industry Association
- Paid Database
- Investor Presentations

Step 4 - Data Triangulation
Involves using different sources of information in order to increase the validity of a study
These sources are likely to be stakeholders in a program - participants, other researchers, program staff, other community members, and so on.
Then we put all data in single framework & apply various statistical tools to find out the dynamic on the market.
During the analysis stage, feedback from the stakeholder groups would be compared to determine areas of agreement as well as areas of divergence