

Key Insights
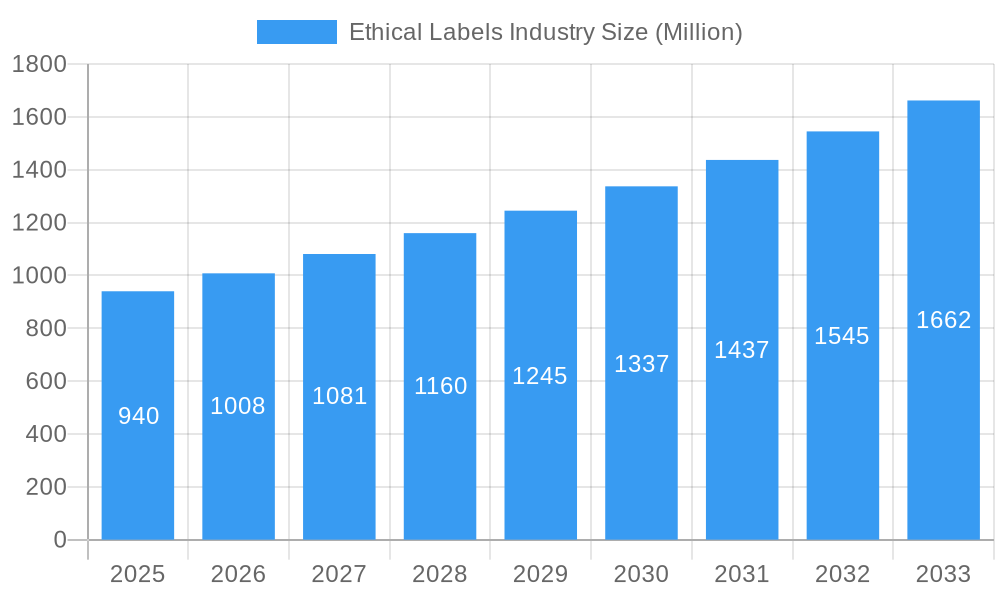
The ethical labels market, valued at $0.94 billion in 2025, is projected to experience robust growth, driven by increasing consumer demand for transparency and ethically sourced products. A compound annual growth rate (CAGR) of 7.10% from 2025 to 2033 indicates a significant expansion, reaching an estimated market size of approximately $1.8 billion by 2033. This growth is fueled by several key factors. The rising awareness of environmental and social issues among consumers is a primary driver, pushing them to actively seek products with ethical certifications like Halal, organic, fairtrade, and vegan labels. Furthermore, the increasing availability of these products across various distribution channels, both online and offline, contributes to market expansion. The food and beverage sectors constitute the largest segments, reflecting a growing preference for ethically produced food and drink items. Major players like PepsiCo, Ingredion, and Cargill are investing significantly in ethical sourcing and labeling initiatives, further accelerating market growth. While regulatory hurdles and the potential for "greenwashing" pose challenges, the overall market outlook remains positive, indicating a sustained trend toward ethical consumption.
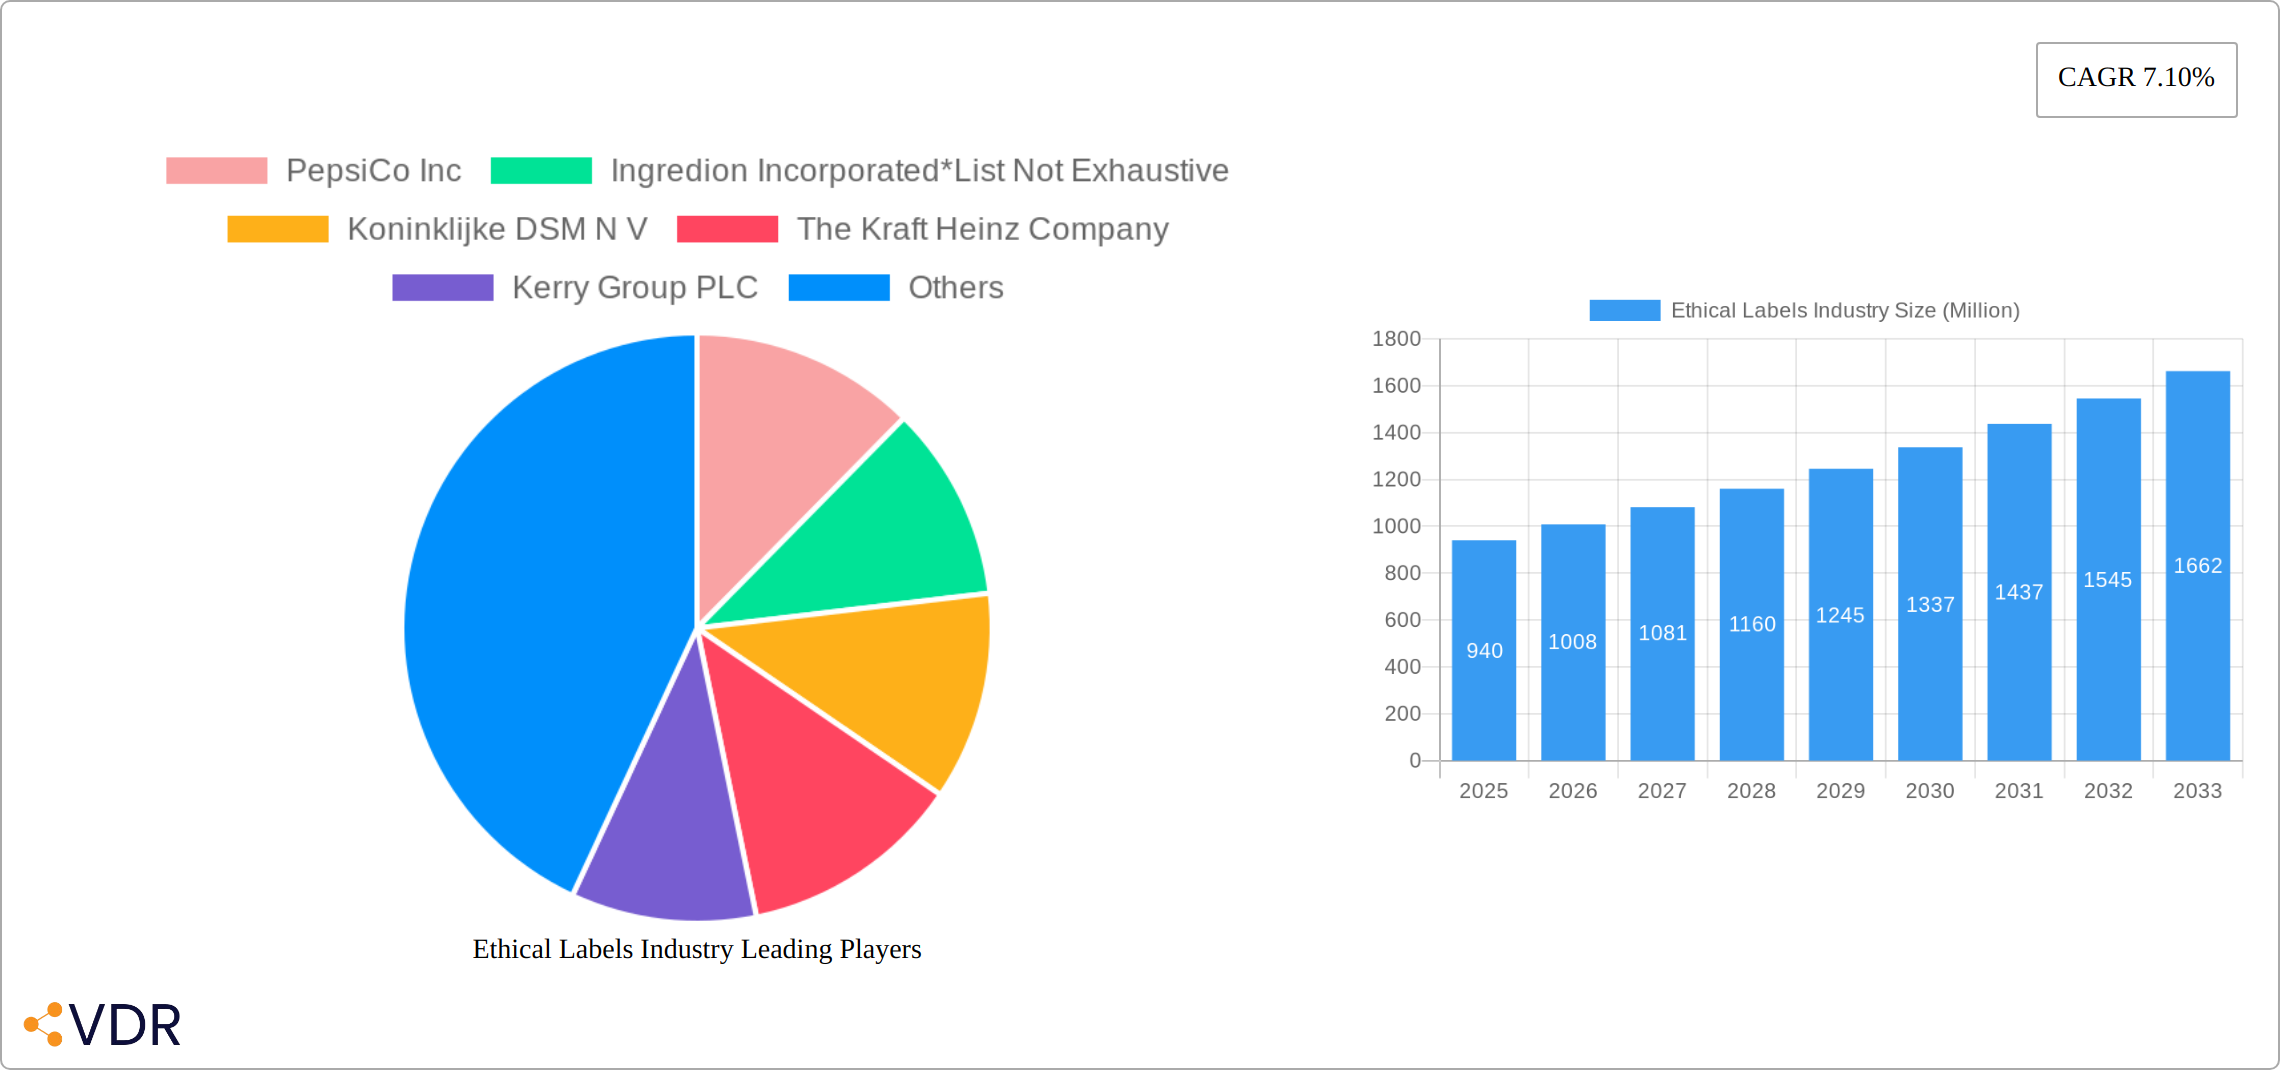
Ethical Labels Industry Market Size (In Million)
The market segmentation reveals that the "Food" product type and "Offline" distribution channel currently dominate. However, the online channel is experiencing rapid growth, reflecting the shift towards e-commerce and the increasing ease of accessing ethically labeled products online. Among label types, Halal, Organic, and Vegan labels currently hold significant market share, but we anticipate growth across all segments, particularly in Animal Welfare and Sustainability labels due to rising consumer concern for animal rights and environmental sustainability. Geographic analysis, while not fully detailed, suggests a strong presence in North America and Europe, with substantial growth potential in the Asia-Pacific region driven by increasing disposable incomes and rising environmental consciousness. Competition within the market is intense, with major food and beverage companies actively competing to capture market share by showcasing their commitment to ethical practices.
Ethical Labels Industry Company Market Share
Ethical Labels Industry: Market Report 2019-2033
This comprehensive report provides a detailed analysis of the Ethical Labels Industry, encompassing market dynamics, growth trends, regional performance, product landscape, and key players. With a focus on the parent market (Ethical Consumer Products) and child market (Ethical Labels), this report offers invaluable insights for industry professionals, investors, and stakeholders seeking to navigate this rapidly evolving sector. The study period covers 2019-2033, with a base year of 2025 and a forecast period of 2025-2033. The historical period analyzed is 2019-2024. The market size is presented in million units.
Ethical Labels Industry Market Dynamics & Structure
The Ethical Labels Industry is characterized by increasing market concentration, with a few large players dominating alongside numerous smaller niche operators. Technological innovation, driven by advancements in traceability and authentication technologies, plays a crucial role. Stringent regulatory frameworks, varying by region and label type, significantly impact market growth. Competitive product substitutes include generic labeling or no labeling at all, posing a challenge. End-user demographics are shifting towards increasingly conscious consumers demanding ethical and sustainable products. M&A activity has been moderate, with larger companies strategically acquiring smaller specialized businesses to expand their offerings.
- Market Concentration: xx% controlled by top 5 players (2024).
- Technological Innovation: Blockchain, AI-powered traceability systems.
- Regulatory Frameworks: Varying standards for organic, fair trade, and other certifications across regions.
- Competitive Substitutes: Generic labeling and absence of ethical labels pose significant competitive pressure.
- M&A Activity: xx deals in the past 5 years (estimated).
- Innovation Barriers: High certification costs and complex regulations.
Ethical Labels Industry Growth Trends & Insights
The Ethical Labels Industry has witnessed significant growth, driven by increasing consumer awareness and demand for ethical and sustainable products. Market size is projected to reach xx million units by 2025, exhibiting a CAGR of xx% during the forecast period (2025-2033). Adoption rates vary significantly across label types and regions, with organic and vegan labels showing strong growth. Technological disruptions, such as blockchain-based traceability, are enhancing transparency and building consumer trust. Consumer behavior shifts towards mindful consumption fuel continuous market expansion. This growing trend is further reinforced by the increasing number of consumers actively seeking out products with ethical labels.
Dominant Regions, Countries, or Segments in Ethical Labels Industry
North America and Europe currently dominate the Ethical Labels Industry, driven by high consumer awareness and stringent regulations. Within label types, Organic, Vegan, and Fairtrade labels exhibit the highest growth, fueled by strong consumer demand. Food and beverages represent the dominant product segments, reflecting the widespread adoption of ethical labels in these sectors. Offline distribution channels remain prominent, but online sales are growing rapidly.
- Leading Region: North America (xx% market share in 2024)
- Leading Label Type: Organic (xx% market share in 2024)
- Leading Product Type: Food (xx% market share in 2024)
- Leading Distribution Channel: Offline (xx% market share in 2024)
- Key Drivers: Stringent regulations, high consumer awareness, growing disposable incomes.
Ethical Labels Industry Product Landscape
Product innovation in the Ethical Labels Industry focuses on enhancing traceability, improving sustainability, and offering a wider range of certifications. New technologies such as blockchain and RFID are being integrated to ensure product authenticity and transparency. Performance metrics emphasize environmental impact, social responsibility, and cost-effectiveness. Unique selling propositions center on transparency, verified ethical sourcing, and environmentally friendly production methods.
Key Drivers, Barriers & Challenges in Ethical Labels Industry
Key Drivers:
- Growing Consumer Consciousness: A surge in consumer demand for ethically sourced and sustainably produced goods is a primary driver, pushing businesses to adopt transparent and responsible practices.
- Stringent Regulatory Landscapes: Governments worldwide are implementing increasingly stringent regulations to promote sustainable practices and hold businesses accountable for their environmental and social impact. This regulatory pressure is a significant impetus for ethical labeling adoption.
- Technological Advancements: Innovations such as blockchain technology, AI, and RFID are enhancing traceability and transparency throughout the supply chain, providing irrefutable proof of ethical sourcing and production.
Challenges:
- High Certification Costs: The cost of obtaining and maintaining ethical certifications can be prohibitive for smaller businesses, creating a barrier to entry and potentially limiting market participation.
- Global Regulatory Fragmentation: Navigating the complex and often inconsistent ethical labeling regulations across different regions poses a significant challenge for businesses operating internationally.
- Combating "Greenwashing": The prevalence of misleading or non-ethical labels undermines consumer trust and necessitates robust verification mechanisms to ensure genuine commitment to ethical practices.
- Supply Chain Complexity: The intricate nature of global supply chains makes it challenging to ensure complete traceability and sustainability throughout the entire production process. This complexity necessitates collaborative efforts and advanced technological solutions.
Emerging Opportunities in Ethical Labels Industry
- Expansion into developing markets with growing consumer awareness.
- Development of new label types addressing emerging consumer concerns.
- Integration of innovative technologies for enhanced traceability.
- Focus on sustainability and reduced environmental impact.
Growth Accelerators in the Ethical Labels Industry
Technological advancements, particularly blockchain technology offering immutable records and AI-powered analytics for improved traceability, are pivotal catalysts for industry growth. Strategic collaborations between businesses, certification bodies, and NGOs enhance credibility and efficiency. Expansion into emerging markets and diversification into new product categories fuel continued expansion. Supportive government policies, including tax incentives and subsidies for ethical practices, further accelerate market growth.
Key Players Shaping the Ethical Labels Industry Market
- PepsiCo Inc
- Ingredion Incorporated
- Koninklijke DSM N V
- The Kraft Heinz Company
- Kerry Group PLC
- Cargill Inc
- Go Macro LLC
- Archer-Daniels-Midland Company
- Garden of Life (Nestlé S A)
- The Hershey Company
Notable Milestones in Ethical Labels Industry Sector
- June 2023: Kerry Group PLC launched Biobake EgR, an enzyme solution promoting ethical egg sourcing in baking, highlighting the industry's innovation in sustainable practices.
- September 2023: Maranello launched its "Maranello on Earth" ethical label, focusing on sustainability and social responsibility in promotional items, showcasing the expanding reach of ethical labeling.
In-Depth Ethical Labels Industry Market Outlook
The Ethical Labels Industry is experiencing robust growth fueled by a synergistic interplay of consumer demand, technological innovation, and supportive regulatory frameworks. Significant opportunities exist in leveraging cutting-edge technologies to enhance supply chain transparency, developing innovative ethical labeling solutions tailored to specific consumer needs, and strategically expanding into high-growth markets. Future success hinges on fostering collaborative partnerships across the entire value chain, building trust and credibility, and consistently delivering superior value to consumers who are increasingly prioritizing ethical and sustainable choices.
Ethical Labels Industry Segmentation
-
1. Label Type
- 1.1. Halal
- 1.2. Organic
- 1.3. Clean
- 1.4. Sustainability and Fairtrade labels
- 1.5. Animal Welfare Labels
- 1.6. Vegan Labels
- 1.7. Other Label Types
-
2. Product Type
- 2.1. Food
- 2.2. Beverages
-
3. Distribution Channel
- 3.1. Offline
- 3.2. Online
Ethical Labels Industry Segmentation By Geography
- 1. North America
- 2. Europe
- 3. Asia
- 4. Australia and New Zealand
- 5. Latin America
- 6. Middle East and Africa
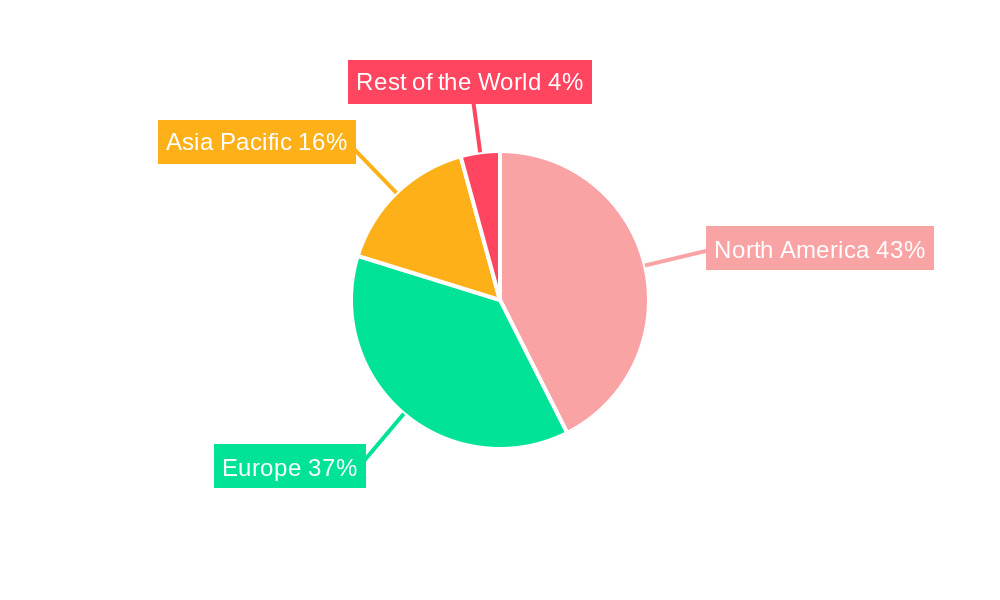
Ethical Labels Industry Regional Market Share
Geographic Coverage of Ethical Labels Industry
Ethical Labels Industry REPORT HIGHLIGHTS
| Aspects | Details |
|---|---|
| Study Period | 2020-2034 |
| Base Year | 2025 |
| Estimated Year | 2026 |
| Forecast Period | 2026-2034 |
| Historical Period | 2020-2025 |
| Growth Rate | CAGR of 7.10% from 2020-2034 |
| Segmentation |
|
Table of Contents
- 1. Introduction
- 1.1. Research Scope
- 1.2. Market Segmentation
- 1.3. Research Objective
- 1.4. Definitions and Assumptions
- 2. Executive Summary
- 2.1. Market Snapshot
- 3. Market Dynamics
- 3.1. Market Drivers
- 3.2. Market Restrains
- 3.3. Market Trends
- 3.4. Market Opportunities
- 4. Market Factor Analysis
- 4.1. Porters Five Forces
- 4.1.1. Bargaining Power of Suppliers
- 4.1.2. Bargaining Power of Buyers
- 4.1.3. Threat of New Entrants
- 4.1.4. Threat of Substitutes
- 4.1.5. Competitive Rivalry
- 4.2. PESTEL analysis
- 4.3. BCG Analysis
- 4.3.1. Stars (High Growth, High Market Share)
- 4.3.2. Cash Cows (Low Growth, High Market Share)
- 4.3.3. Question Mark (High Growth, Low Market Share)
- 4.3.4. Dogs (Low Growth, Low Market Share)
- 4.4. Ansoff Matrix Analysis
- 4.5. Supply Chain Analysis
- 4.6. Regulatory Landscape
- 4.7. Current Market Potential and Opportunity Assessment (TAM–SAM–SOM Framework)
- 4.8. VDR Analyst Note
- 4.1. Porters Five Forces
- 5. Market Analysis, Insights and Forecast 2021-2033
- 5.1. Market Analysis, Insights and Forecast - by Label Type
- 5.1.1. Halal
- 5.1.2. Organic
- 5.1.3. Clean
- 5.1.4. Sustainability and Fairtrade labels
- 5.1.5. Animal Welfare Labels
- 5.1.6. Vegan Labels
- 5.1.7. Other Label Types
- 5.2. Market Analysis, Insights and Forecast - by Product Type
- 5.2.1. Food
- 5.2.2. Beverages
- 5.3. Market Analysis, Insights and Forecast - by Distribution Channel
- 5.3.1. Offline
- 5.3.2. Online
- 5.4. Market Analysis, Insights and Forecast - by Region
- 5.4.1. North America
- 5.4.2. Europe
- 5.4.3. Asia
- 5.4.4. Australia and New Zealand
- 5.4.5. Latin America
- 5.4.6. Middle East and Africa
- 5.1. Market Analysis, Insights and Forecast - by Label Type
- 6. Global Ethical Labels Industry Analysis, Insights and Forecast, 2021-2033
- 6.1. Market Analysis, Insights and Forecast - by Label Type
- 6.1.1. Halal
- 6.1.2. Organic
- 6.1.3. Clean
- 6.1.4. Sustainability and Fairtrade labels
- 6.1.5. Animal Welfare Labels
- 6.1.6. Vegan Labels
- 6.1.7. Other Label Types
- 6.2. Market Analysis, Insights and Forecast - by Product Type
- 6.2.1. Food
- 6.2.2. Beverages
- 6.3. Market Analysis, Insights and Forecast - by Distribution Channel
- 6.3.1. Offline
- 6.3.2. Online
- 6.1. Market Analysis, Insights and Forecast - by Label Type
- 7. North America Ethical Labels Industry Analysis, Insights and Forecast, 2021-2033
- 7.1. Market Analysis, Insights and Forecast - by Label Type
- 7.1.1. Halal
- 7.1.2. Organic
- 7.1.3. Clean
- 7.1.4. Sustainability and Fairtrade labels
- 7.1.5. Animal Welfare Labels
- 7.1.6. Vegan Labels
- 7.1.7. Other Label Types
- 7.2. Market Analysis, Insights and Forecast - by Product Type
- 7.2.1. Food
- 7.2.2. Beverages
- 7.3. Market Analysis, Insights and Forecast - by Distribution Channel
- 7.3.1. Offline
- 7.3.2. Online
- 7.1. Market Analysis, Insights and Forecast - by Label Type
- 8. Europe Ethical Labels Industry Analysis, Insights and Forecast, 2021-2033
- 8.1. Market Analysis, Insights and Forecast - by Label Type
- 8.1.1. Halal
- 8.1.2. Organic
- 8.1.3. Clean
- 8.1.4. Sustainability and Fairtrade labels
- 8.1.5. Animal Welfare Labels
- 8.1.6. Vegan Labels
- 8.1.7. Other Label Types
- 8.2. Market Analysis, Insights and Forecast - by Product Type
- 8.2.1. Food
- 8.2.2. Beverages
- 8.3. Market Analysis, Insights and Forecast - by Distribution Channel
- 8.3.1. Offline
- 8.3.2. Online
- 8.1. Market Analysis, Insights and Forecast - by Label Type
- 9. Asia Ethical Labels Industry Analysis, Insights and Forecast, 2021-2033
- 9.1. Market Analysis, Insights and Forecast - by Label Type
- 9.1.1. Halal
- 9.1.2. Organic
- 9.1.3. Clean
- 9.1.4. Sustainability and Fairtrade labels
- 9.1.5. Animal Welfare Labels
- 9.1.6. Vegan Labels
- 9.1.7. Other Label Types
- 9.2. Market Analysis, Insights and Forecast - by Product Type
- 9.2.1. Food
- 9.2.2. Beverages
- 9.3. Market Analysis, Insights and Forecast - by Distribution Channel
- 9.3.1. Offline
- 9.3.2. Online
- 9.1. Market Analysis, Insights and Forecast - by Label Type
- 10. Australia and New Zealand Ethical Labels Industry Analysis, Insights and Forecast, 2021-2033
- 10.1. Market Analysis, Insights and Forecast - by Label Type
- 10.1.1. Halal
- 10.1.2. Organic
- 10.1.3. Clean
- 10.1.4. Sustainability and Fairtrade labels
- 10.1.5. Animal Welfare Labels
- 10.1.6. Vegan Labels
- 10.1.7. Other Label Types
- 10.2. Market Analysis, Insights and Forecast - by Product Type
- 10.2.1. Food
- 10.2.2. Beverages
- 10.3. Market Analysis, Insights and Forecast - by Distribution Channel
- 10.3.1. Offline
- 10.3.2. Online
- 10.1. Market Analysis, Insights and Forecast - by Label Type
- 11. Latin America Ethical Labels Industry Analysis, Insights and Forecast, 2021-2033
- 11.1. Market Analysis, Insights and Forecast - by Label Type
- 11.1.1. Halal
- 11.1.2. Organic
- 11.1.3. Clean
- 11.1.4. Sustainability and Fairtrade labels
- 11.1.5. Animal Welfare Labels
- 11.1.6. Vegan Labels
- 11.1.7. Other Label Types
- 11.2. Market Analysis, Insights and Forecast - by Product Type
- 11.2.1. Food
- 11.2.2. Beverages
- 11.3. Market Analysis, Insights and Forecast - by Distribution Channel
- 11.3.1. Offline
- 11.3.2. Online
- 11.1. Market Analysis, Insights and Forecast - by Label Type
- 12. Middle East and Africa Ethical Labels Industry Analysis, Insights and Forecast, 2021-2033
- 12.1. Market Analysis, Insights and Forecast - by Label Type
- 12.1.1. Halal
- 12.1.2. Organic
- 12.1.3. Clean
- 12.1.4. Sustainability and Fairtrade labels
- 12.1.5. Animal Welfare Labels
- 12.1.6. Vegan Labels
- 12.1.7. Other Label Types
- 12.2. Market Analysis, Insights and Forecast - by Product Type
- 12.2.1. Food
- 12.2.2. Beverages
- 12.3. Market Analysis, Insights and Forecast - by Distribution Channel
- 12.3.1. Offline
- 12.3.2. Online
- 12.1. Market Analysis, Insights and Forecast - by Label Type
- 13. Competitive Analysis
- 13.1. Company Profiles
- 13.1.1 PepsiCo Inc
- 13.1.1.1. Company Overview
- 13.1.1.2. Products
- 13.1.1.3. Company Financials
- 13.1.1.4. SWOT Analysis
- 13.1.2 Ingredion Incorporated*List Not Exhaustive
- 13.1.2.1. Company Overview
- 13.1.2.2. Products
- 13.1.2.3. Company Financials
- 13.1.2.4. SWOT Analysis
- 13.1.3 Koninklijke DSM N V
- 13.1.3.1. Company Overview
- 13.1.3.2. Products
- 13.1.3.3. Company Financials
- 13.1.3.4. SWOT Analysis
- 13.1.4 The Kraft Heinz Company
- 13.1.4.1. Company Overview
- 13.1.4.2. Products
- 13.1.4.3. Company Financials
- 13.1.4.4. SWOT Analysis
- 13.1.5 Kerry Group PLC
- 13.1.5.1. Company Overview
- 13.1.5.2. Products
- 13.1.5.3. Company Financials
- 13.1.5.4. SWOT Analysis
- 13.1.6 Cargill Inc
- 13.1.6.1. Company Overview
- 13.1.6.2. Products
- 13.1.6.3. Company Financials
- 13.1.6.4. SWOT Analysis
- 13.1.7 Go Macro LLC
- 13.1.7.1. Company Overview
- 13.1.7.2. Products
- 13.1.7.3. Company Financials
- 13.1.7.4. SWOT Analysis
- 13.1.8 Archer-Daniels-Midland Company
- 13.1.8.1. Company Overview
- 13.1.8.2. Products
- 13.1.8.3. Company Financials
- 13.1.8.4. SWOT Analysis
- 13.1.9 Garden of Life (Nestlé S A )
- 13.1.9.1. Company Overview
- 13.1.9.2. Products
- 13.1.9.3. Company Financials
- 13.1.9.4. SWOT Analysis
- 13.1.10 The Hershey Company
- 13.1.10.1. Company Overview
- 13.1.10.2. Products
- 13.1.10.3. Company Financials
- 13.1.10.4. SWOT Analysis
- 13.1.1 PepsiCo Inc
- 13.2. Market Entropy
- 13.2.1 Company's Key Areas Served
- 13.2.2 Recent Developments
- 13.3. Company Market Share Analysis 2025
- 13.3.1 Top 5 Companies Market Share Analysis
- 13.3.2 Top 3 Companies Market Share Analysis
- 13.4. List of Potential Customers
- 14. Research Methodology
List of Figures
- Figure 1: Global Ethical Labels Industry Revenue Breakdown (Million, %) by Region 2025 & 2033
- Figure 2: North America Ethical Labels Industry Revenue (Million), by Label Type 2025 & 2033
- Figure 3: North America Ethical Labels Industry Revenue Share (%), by Label Type 2025 & 2033
- Figure 4: North America Ethical Labels Industry Revenue (Million), by Product Type 2025 & 2033
- Figure 5: North America Ethical Labels Industry Revenue Share (%), by Product Type 2025 & 2033
- Figure 6: North America Ethical Labels Industry Revenue (Million), by Distribution Channel 2025 & 2033
- Figure 7: North America Ethical Labels Industry Revenue Share (%), by Distribution Channel 2025 & 2033
- Figure 8: North America Ethical Labels Industry Revenue (Million), by Country 2025 & 2033
- Figure 9: North America Ethical Labels Industry Revenue Share (%), by Country 2025 & 2033
- Figure 10: Europe Ethical Labels Industry Revenue (Million), by Label Type 2025 & 2033
- Figure 11: Europe Ethical Labels Industry Revenue Share (%), by Label Type 2025 & 2033
- Figure 12: Europe Ethical Labels Industry Revenue (Million), by Product Type 2025 & 2033
- Figure 13: Europe Ethical Labels Industry Revenue Share (%), by Product Type 2025 & 2033
- Figure 14: Europe Ethical Labels Industry Revenue (Million), by Distribution Channel 2025 & 2033
- Figure 15: Europe Ethical Labels Industry Revenue Share (%), by Distribution Channel 2025 & 2033
- Figure 16: Europe Ethical Labels Industry Revenue (Million), by Country 2025 & 2033
- Figure 17: Europe Ethical Labels Industry Revenue Share (%), by Country 2025 & 2033
- Figure 18: Asia Ethical Labels Industry Revenue (Million), by Label Type 2025 & 2033
- Figure 19: Asia Ethical Labels Industry Revenue Share (%), by Label Type 2025 & 2033
- Figure 20: Asia Ethical Labels Industry Revenue (Million), by Product Type 2025 & 2033
- Figure 21: Asia Ethical Labels Industry Revenue Share (%), by Product Type 2025 & 2033
- Figure 22: Asia Ethical Labels Industry Revenue (Million), by Distribution Channel 2025 & 2033
- Figure 23: Asia Ethical Labels Industry Revenue Share (%), by Distribution Channel 2025 & 2033
- Figure 24: Asia Ethical Labels Industry Revenue (Million), by Country 2025 & 2033
- Figure 25: Asia Ethical Labels Industry Revenue Share (%), by Country 2025 & 2033
- Figure 26: Australia and New Zealand Ethical Labels Industry Revenue (Million), by Label Type 2025 & 2033
- Figure 27: Australia and New Zealand Ethical Labels Industry Revenue Share (%), by Label Type 2025 & 2033
- Figure 28: Australia and New Zealand Ethical Labels Industry Revenue (Million), by Product Type 2025 & 2033
- Figure 29: Australia and New Zealand Ethical Labels Industry Revenue Share (%), by Product Type 2025 & 2033
- Figure 30: Australia and New Zealand Ethical Labels Industry Revenue (Million), by Distribution Channel 2025 & 2033
- Figure 31: Australia and New Zealand Ethical Labels Industry Revenue Share (%), by Distribution Channel 2025 & 2033
- Figure 32: Australia and New Zealand Ethical Labels Industry Revenue (Million), by Country 2025 & 2033
- Figure 33: Australia and New Zealand Ethical Labels Industry Revenue Share (%), by Country 2025 & 2033
- Figure 34: Latin America Ethical Labels Industry Revenue (Million), by Label Type 2025 & 2033
- Figure 35: Latin America Ethical Labels Industry Revenue Share (%), by Label Type 2025 & 2033
- Figure 36: Latin America Ethical Labels Industry Revenue (Million), by Product Type 2025 & 2033
- Figure 37: Latin America Ethical Labels Industry Revenue Share (%), by Product Type 2025 & 2033
- Figure 38: Latin America Ethical Labels Industry Revenue (Million), by Distribution Channel 2025 & 2033
- Figure 39: Latin America Ethical Labels Industry Revenue Share (%), by Distribution Channel 2025 & 2033
- Figure 40: Latin America Ethical Labels Industry Revenue (Million), by Country 2025 & 2033
- Figure 41: Latin America Ethical Labels Industry Revenue Share (%), by Country 2025 & 2033
- Figure 42: Middle East and Africa Ethical Labels Industry Revenue (Million), by Label Type 2025 & 2033
- Figure 43: Middle East and Africa Ethical Labels Industry Revenue Share (%), by Label Type 2025 & 2033
- Figure 44: Middle East and Africa Ethical Labels Industry Revenue (Million), by Product Type 2025 & 2033
- Figure 45: Middle East and Africa Ethical Labels Industry Revenue Share (%), by Product Type 2025 & 2033
- Figure 46: Middle East and Africa Ethical Labels Industry Revenue (Million), by Distribution Channel 2025 & 2033
- Figure 47: Middle East and Africa Ethical Labels Industry Revenue Share (%), by Distribution Channel 2025 & 2033
- Figure 48: Middle East and Africa Ethical Labels Industry Revenue (Million), by Country 2025 & 2033
- Figure 49: Middle East and Africa Ethical Labels Industry Revenue Share (%), by Country 2025 & 2033
List of Tables
- Table 1: Global Ethical Labels Industry Revenue Million Forecast, by Label Type 2020 & 2033
- Table 2: Global Ethical Labels Industry Revenue Million Forecast, by Product Type 2020 & 2033
- Table 3: Global Ethical Labels Industry Revenue Million Forecast, by Distribution Channel 2020 & 2033
- Table 4: Global Ethical Labels Industry Revenue Million Forecast, by Region 2020 & 2033
- Table 5: Global Ethical Labels Industry Revenue Million Forecast, by Label Type 2020 & 2033
- Table 6: Global Ethical Labels Industry Revenue Million Forecast, by Product Type 2020 & 2033
- Table 7: Global Ethical Labels Industry Revenue Million Forecast, by Distribution Channel 2020 & 2033
- Table 8: Global Ethical Labels Industry Revenue Million Forecast, by Country 2020 & 2033
- Table 9: Global Ethical Labels Industry Revenue Million Forecast, by Label Type 2020 & 2033
- Table 10: Global Ethical Labels Industry Revenue Million Forecast, by Product Type 2020 & 2033
- Table 11: Global Ethical Labels Industry Revenue Million Forecast, by Distribution Channel 2020 & 2033
- Table 12: Global Ethical Labels Industry Revenue Million Forecast, by Country 2020 & 2033
- Table 13: Global Ethical Labels Industry Revenue Million Forecast, by Label Type 2020 & 2033
- Table 14: Global Ethical Labels Industry Revenue Million Forecast, by Product Type 2020 & 2033
- Table 15: Global Ethical Labels Industry Revenue Million Forecast, by Distribution Channel 2020 & 2033
- Table 16: Global Ethical Labels Industry Revenue Million Forecast, by Country 2020 & 2033
- Table 17: Global Ethical Labels Industry Revenue Million Forecast, by Label Type 2020 & 2033
- Table 18: Global Ethical Labels Industry Revenue Million Forecast, by Product Type 2020 & 2033
- Table 19: Global Ethical Labels Industry Revenue Million Forecast, by Distribution Channel 2020 & 2033
- Table 20: Global Ethical Labels Industry Revenue Million Forecast, by Country 2020 & 2033
- Table 21: Global Ethical Labels Industry Revenue Million Forecast, by Label Type 2020 & 2033
- Table 22: Global Ethical Labels Industry Revenue Million Forecast, by Product Type 2020 & 2033
- Table 23: Global Ethical Labels Industry Revenue Million Forecast, by Distribution Channel 2020 & 2033
- Table 24: Global Ethical Labels Industry Revenue Million Forecast, by Country 2020 & 2033
- Table 25: Global Ethical Labels Industry Revenue Million Forecast, by Label Type 2020 & 2033
- Table 26: Global Ethical Labels Industry Revenue Million Forecast, by Product Type 2020 & 2033
- Table 27: Global Ethical Labels Industry Revenue Million Forecast, by Distribution Channel 2020 & 2033
- Table 28: Global Ethical Labels Industry Revenue Million Forecast, by Country 2020 & 2033
Frequently Asked Questions
1. What is the projected Compound Annual Growth Rate (CAGR) of the Ethical Labels Industry?
The projected CAGR is approximately 7.10%.
2. Which companies are prominent players in the Ethical Labels Industry?
Key companies in the market include PepsiCo Inc, Ingredion Incorporated*List Not Exhaustive, Koninklijke DSM N V, The Kraft Heinz Company, Kerry Group PLC, Cargill Inc, Go Macro LLC, Archer-Daniels-Midland Company, Garden of Life (Nestlé S A ), The Hershey Company.
3. What are the main segments of the Ethical Labels Industry?
The market segments include Label Type, Product Type, Distribution Channel.
4. Can you provide details about the market size?
The market size is estimated to be USD 0.94 Million as of 2022.
5. What are some drivers contributing to market growth?
Increased Consumer Conscious toward Health and Ethical Values; Growth due to Online Retailing and CSR Activities; Reduction in Meat Consumption for Environmental Sustainability.
6. What are the notable trends driving market growth?
Beverages To Occupy Highest Market Share.
7. Are there any restraints impacting market growth?
Increasing Competition Among Players.
8. Can you provide examples of recent developments in the market?
September 2023: Maranello launched its ethical label. To obtain the Maranello on Earth label, a product must fulfill one of 4 criteria: a useful, sustainable promotional object that can be recycled and that is biodegradable, or a renewable promotional object that uses fewer materials or eco-designed materials produced using organic and recycled materials. It can also be a promotional object with a low carbon footprint, using locally-produced raw materials and green transport over short distances, or a promotional object with a socially positive contribution, environmentally ethical, using European, national, or even local know-how; using local or international, charity-based, socially responsible or fair-trade manufacture.
9. What pricing options are available for accessing the report?
Pricing options include single-user, multi-user, and enterprise licenses priced at USD 4750, USD 5250, and USD 8750 respectively.
10. Is the market size provided in terms of value or volume?
The market size is provided in terms of value, measured in Million.
11. Are there any specific market keywords associated with the report?
Yes, the market keyword associated with the report is "Ethical Labels Industry," which aids in identifying and referencing the specific market segment covered.
12. How do I determine which pricing option suits my needs best?
The pricing options vary based on user requirements and access needs. Individual users may opt for single-user licenses, while businesses requiring broader access may choose multi-user or enterprise licenses for cost-effective access to the report.
13. Are there any additional resources or data provided in the Ethical Labels Industry report?
While the report offers comprehensive insights, it's advisable to review the specific contents or supplementary materials provided to ascertain if additional resources or data are available.
14. How can I stay updated on further developments or reports in the Ethical Labels Industry?
To stay informed about further developments, trends, and reports in the Ethical Labels Industry, consider subscribing to industry newsletters, following relevant companies and organizations, or regularly checking reputable industry news sources and publications.
Methodology
Step 1 - Identification of Relevant Samples Size from Population Database


Step 2 - Approaches for Defining Global Market Size (Value, Volume* & Price*)

Note*: In applicable scenarios
Step 3 - Data Sources
Primary Research
- Web Analytics
- Survey Reports
- Research Institute
- Latest Research Reports
- Opinion Leaders
Secondary Research
- Annual Reports
- White Paper
- Latest Press Release
- Industry Association
- Paid Database
- Investor Presentations

Step 4 - Data Triangulation
Involves using different sources of information in order to increase the validity of a study
These sources are likely to be stakeholders in a program - participants, other researchers, program staff, other community members, and so on.
Then we put all data in single framework & apply various statistical tools to find out the dynamic on the market.
During the analysis stage, feedback from the stakeholder groups would be compared to determine areas of agreement as well as areas of divergence