

Key Insights
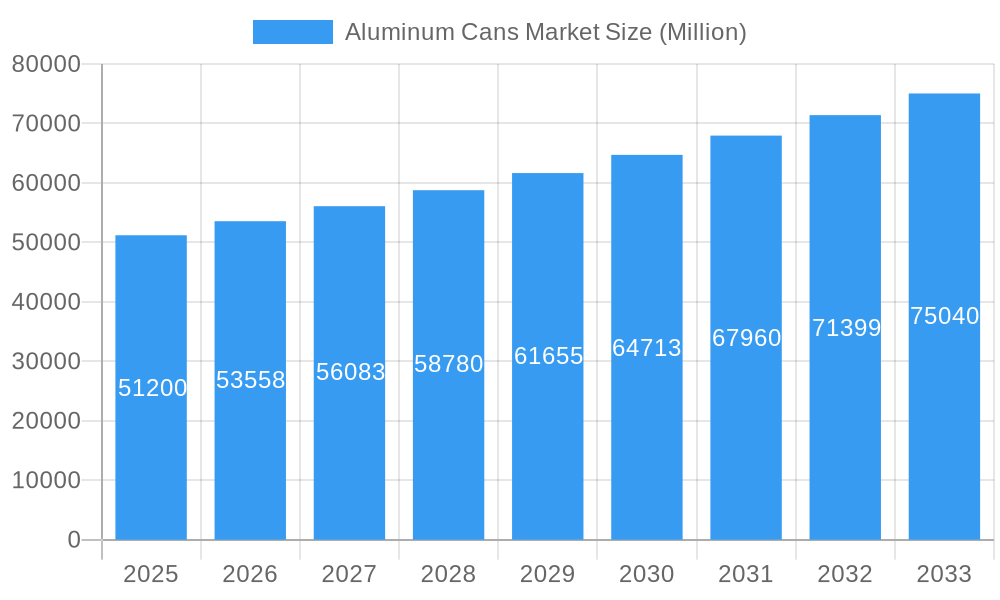
The global aluminum cans market, valued at $51.20 billion in 2025, is projected to experience robust growth, driven by several key factors. The increasing demand for convenient and sustainable packaging solutions across various end-use industries, notably the beverage and food sectors, is a primary catalyst. Consumers' preference for lightweight, recyclable, and tamper-evident packaging fuels market expansion. Furthermore, advancements in can manufacturing technologies, such as the development of thinner, lighter, and more aesthetically pleasing cans (slim, sleek designs), contribute to increased adoption. The growth is further supported by the expanding global population and rising disposable incomes, particularly in developing economies, increasing per capita consumption of packaged beverages and food items. While potential restraints include fluctuations in aluminum prices and environmental concerns related to manufacturing and disposal, the overall market outlook remains positive. Strategic partnerships between can manufacturers and beverage/food companies, along with innovations in can coatings and designs, are expected to offset these challenges and drive continued market expansion. The segment breakdown reveals that beverage applications currently dominate, but food and aerosol segments are projected to witness significant growth in the coming years. Geographically, North America and Europe currently hold substantial market share, but the Asia-Pacific region is anticipated to show the most impressive growth trajectory due to its rapidly expanding consumer base and increasing industrialization.
Aluminum Cans Market Market Size (In Billion)
The forecast period (2025-2033) anticipates a consistent CAGR of 4.53%, leading to substantial market expansion. This growth will be fueled by the continued adoption of aluminum cans across various applications, driven by its superior properties compared to alternative packaging materials. Regional variations will reflect differing economic growth rates and consumer preferences. While North America and Europe will maintain a significant presence, rapid industrialization and urbanization in the Asia-Pacific region will propel its market share significantly. The competitive landscape is characterized by both large multinational corporations and regional players. These companies are constantly innovating to enhance their product offerings, optimize production processes, and explore new market opportunities. This competitive intensity fosters innovation and helps maintain a healthy level of price competition, benefitting consumers and driving market expansion.
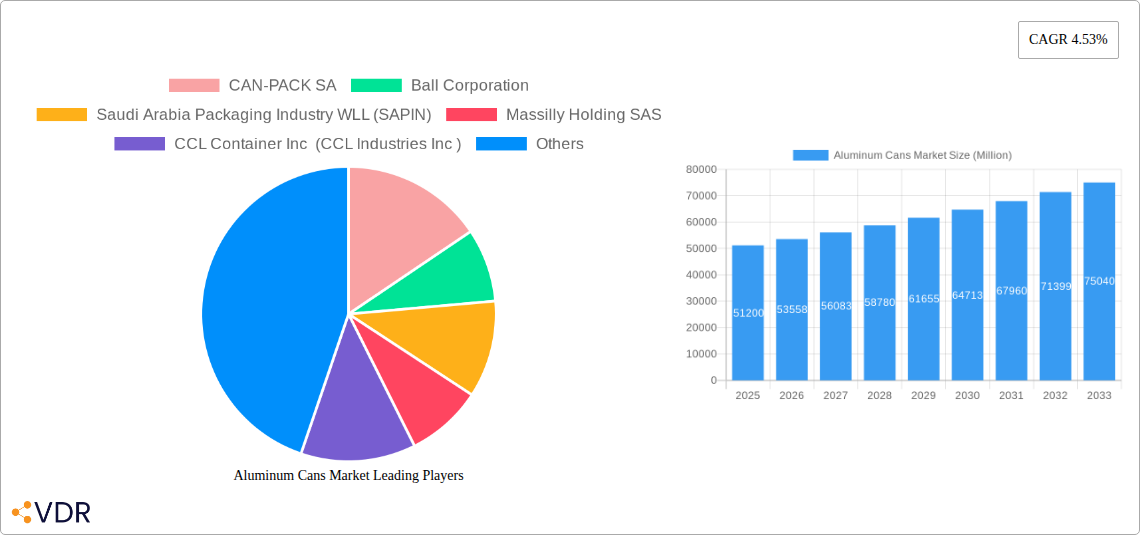
Aluminum Cans Market Company Market Share
Aluminum Cans Market: A Comprehensive Report (2019-2033)
This comprehensive report provides an in-depth analysis of the global Aluminum Cans Market, encompassing market dynamics, growth trends, regional analysis, product landscape, key players, and future outlook. The study period covers 2019-2033, with 2025 as the base and estimated year. This report is crucial for industry professionals, investors, and stakeholders seeking to understand the current market landscape and strategize for future growth within this dynamic sector. The parent market is Packaging and the child market is Metal Packaging.
Aluminum Cans Market Dynamics & Structure
The aluminum cans market exhibits moderate concentration, with key players such as Ball Corporation and Crown Holdings holding significant market share. Technological innovations, particularly in lightweighting and enhanced recyclability, are key growth drivers. Stringent environmental regulations and increasing consumer awareness of sustainability are shaping market dynamics. Competitive substitutes, such as plastic and glass containers, present challenges. The market is further segmented by can type (slim, sleek, standard, other) and end-user industry (beverage, food, aerosol, others). M&A activity has been relatively consistent, with approximately xx deals recorded in the past five years, driven by consolidation and expansion strategies.
- Market Concentration: Moderately concentrated, with top 5 players holding approximately xx% market share (2024).
- Technological Innovation: Focus on lightweighting, improved recyclability, and sustainable manufacturing processes.
- Regulatory Framework: Increasingly stringent environmental regulations driving demand for sustainable packaging.
- Competitive Substitutes: Plastic and glass containers pose significant competition.
- End-User Demographics: Shifting consumer preferences towards convenience and sustainability are influencing market trends.
- M&A Trends: Moderate level of M&A activity, primarily driven by consolidation and expansion.
Aluminum Cans Market Growth Trends & Insights
The global aluminum cans market has witnessed robust growth over the past five years, with a Compound Annual Growth Rate (CAGR) of xx% during the historical period (2019-2024). This growth is primarily fueled by the increasing demand for canned beverages, particularly carbonated soft drinks and energy drinks. Technological advancements in can manufacturing, including the introduction of lightweighting techniques and improved printing capabilities, have enhanced market competitiveness. Consumer preference shifts towards convenient and eco-friendly packaging solutions further drive market expansion. The market penetration rate for aluminum cans in the beverage industry is estimated to be xx% in 2025, with significant growth potential in developing economies.
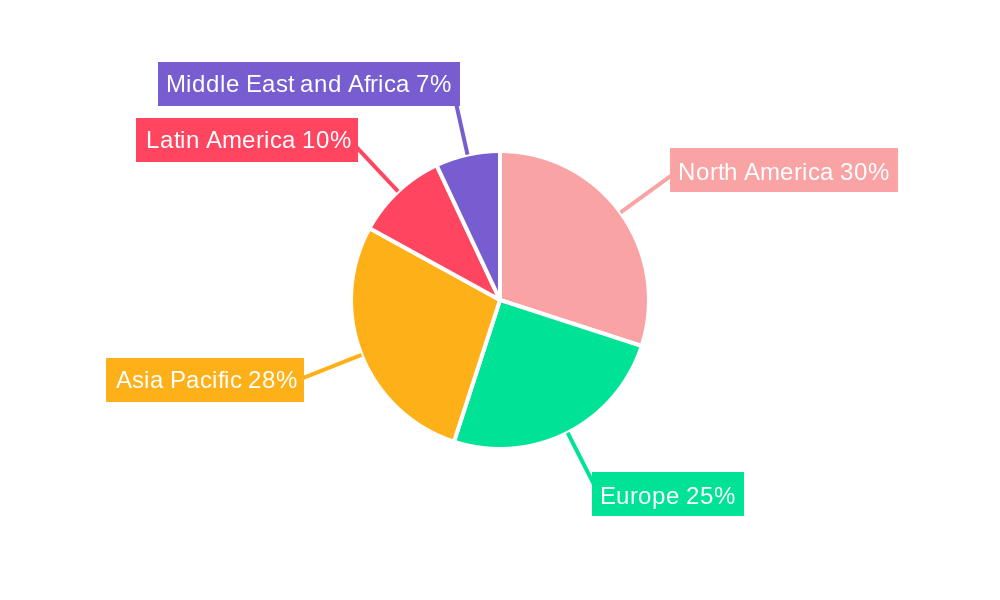
Dominant Regions, Countries, or Segments in Aluminum Cans Market
North America and Europe currently dominate the aluminum cans market, driven by high per capita consumption of canned beverages and established recycling infrastructure. The beverage segment accounts for the largest market share, followed by food and aerosol. However, Asia-Pacific is projected to experience the fastest growth in the forecast period due to rapid urbanization, rising disposable incomes, and increasing demand for convenience food and beverages.
- Key Drivers: Strong consumer demand, robust beverage industry growth, and improved recycling infrastructure.
- Dominant Regions: North America and Europe (high consumption rates).
- Fastest-Growing Regions: Asia-Pacific (rising disposable incomes and urbanization).
- Dominant Segments: Beverage segment (largest market share), followed by food and aerosol.
Aluminum Cans Market Product Landscape
The aluminum cans market offers a diverse range of products catering to varied end-user needs. Product innovations focus on improved functionality, such as enhanced barrier properties to extend shelf life and improved designs for better stackability and transportation efficiency. Technological advancements include the development of lightweight cans to reduce material consumption and optimized printing techniques to enhance product appeal. Key features driving market penetration include improved recyclability, cost-effectiveness, and attractive designs.
Key Drivers, Barriers & Challenges in Aluminum Cans Market
Key Drivers:
- Rising demand for convenient packaging solutions.
- Increasing preference for sustainable and recyclable materials.
- Growth of the beverage and food industries.
- Technological advancements in can manufacturing and design.
Challenges:
- Fluctuations in aluminum prices impacting production costs.
- Competition from alternative packaging materials (plastic, glass).
- Stringent environmental regulations and compliance costs.
- Supply chain disruptions affecting raw material availability. These disruptions have resulted in an estimated xx% increase in production costs in 2024.
Emerging Opportunities in Aluminum Cans Market
- Expanding into untapped markets in developing economies.
- Development of innovative can designs and functionalities.
- Growing demand for sustainable and eco-friendly packaging solutions.
- Exploring new applications for aluminum cans beyond beverages and food.
Growth Accelerators in the Aluminum Cans Market Industry
Technological breakthroughs in lightweighting and enhanced recyclability, coupled with strategic partnerships between can manufacturers and recycling organizations, are key catalysts driving long-term growth. Expanding into emerging markets and focusing on innovative can designs are crucial for sustained market expansion.
Key Players Shaping the Aluminum Cans Market Market
- CAN-PACK SA
- Ball Corporation
- Saudi Arabia Packaging Industry WLL (SAPIN)
- Massilly Holding SAS
- CCL Container Inc (CCL Industries Inc)
- Crown Holdings Inc
- CPMC HOLDINGS Limited (COFCO Group
- Ardagh Group S A
- Silgan Holdings Inc
- Tecnocap Group
Notable Milestones in Aluminum Cans Market Sector
- December 2023: Crown Holdings invests in AI-powered robot to boost UBC recycling rates by over 1 million units annually.
- February 2024: Emirates Global Aluminium (EGA), Crown, and CANPACK launch "Every Can Counts" recycling campaign in the UAE.
In-Depth Aluminum Cans Market Market Outlook
The aluminum cans market is poised for continued growth, driven by increasing demand, technological advancements, and a growing focus on sustainability. Strategic partnerships, expansion into new markets, and innovative product development will be key to capturing future market opportunities. The market is projected to reach xx million units by 2033, demonstrating significant growth potential.
Aluminum Cans Market Segmentation
-
1. Type
- 1.1. Slim
- 1.2. Sleek
- 1.3. Standard
- 1.4. Other Types
-
2. End-user Industry
- 2.1. Beverage
- 2.2. Food
- 2.3. Aerosol
- 2.4. Other End-user Industries
Aluminum Cans Market Segmentation By Geography
-
1. North America
- 1.1. United States
- 1.2. Canada
-
2. Europe
- 2.1. United Kingdom
- 2.2. Germany
- 2.3. France
- 2.4. Spain
- 2.5. Rest of Europe
-
3. Asia Pacific
- 3.1. China
- 3.2. India
- 3.3. Japan
- 3.4. South Korea
- 3.5. Thailand
- 3.6. Rest of Asia Pacific
-
4. Latin America
- 4.1. Brazil
- 4.2. Mexico
- 4.3. Rest of Latin America
-
5. Middle East and Africa
- 5.1. United Arab Emirates
- 5.2. Saudi Arabia
- 5.3. South Africa
- 5.4. Rest of Middle East
Aluminum Cans Market Regional Market Share
Geographic Coverage of Aluminum Cans Market
Aluminum Cans Market REPORT HIGHLIGHTS
| Aspects | Details |
|---|---|
| Study Period | 2020-2034 |
| Base Year | 2025 |
| Estimated Year | 2026 |
| Forecast Period | 2026-2034 |
| Historical Period | 2020-2025 |
| Growth Rate | CAGR of 4.53% from 2020-2034 |
| Segmentation |
|
Table of Contents
- 1. Introduction
- 1.1. Research Scope
- 1.2. Market Segmentation
- 1.3. Research Objective
- 1.4. Definitions and Assumptions
- 2. Executive Summary
- 2.1. Market Snapshot
- 3. Market Dynamics
- 3.1. Market Drivers
- 3.2. Market Restrains
- 3.3. Market Trends
- 3.4. Market Opportunities
- 4. Market Factor Analysis
- 4.1. Porters Five Forces
- 4.1.1. Bargaining Power of Suppliers
- 4.1.2. Bargaining Power of Buyers
- 4.1.3. Threat of New Entrants
- 4.1.4. Threat of Substitutes
- 4.1.5. Competitive Rivalry
- 4.2. PESTEL analysis
- 4.3. BCG Analysis
- 4.3.1. Stars (High Growth, High Market Share)
- 4.3.2. Cash Cows (Low Growth, High Market Share)
- 4.3.3. Question Mark (High Growth, Low Market Share)
- 4.3.4. Dogs (Low Growth, Low Market Share)
- 4.4. Ansoff Matrix Analysis
- 4.5. Supply Chain Analysis
- 4.6. Regulatory Landscape
- 4.7. Current Market Potential and Opportunity Assessment (TAM–SAM–SOM Framework)
- 4.8. VDR Analyst Note
- 4.1. Porters Five Forces
- 5. Market Analysis, Insights and Forecast 2021-2033
- 5.1. Market Analysis, Insights and Forecast - by Type
- 5.1.1. Slim
- 5.1.2. Sleek
- 5.1.3. Standard
- 5.1.4. Other Types
- 5.2. Market Analysis, Insights and Forecast - by End-user Industry
- 5.2.1. Beverage
- 5.2.2. Food
- 5.2.3. Aerosol
- 5.2.4. Other End-user Industries
- 5.3. Market Analysis, Insights and Forecast - by Region
- 5.3.1. North America
- 5.3.2. Europe
- 5.3.3. Asia Pacific
- 5.3.4. Latin America
- 5.3.5. Middle East and Africa
- 5.1. Market Analysis, Insights and Forecast - by Type
- 6. Global Aluminum Cans Market Analysis, Insights and Forecast, 2021-2033
- 6.1. Market Analysis, Insights and Forecast - by Type
- 6.1.1. Slim
- 6.1.2. Sleek
- 6.1.3. Standard
- 6.1.4. Other Types
- 6.2. Market Analysis, Insights and Forecast - by End-user Industry
- 6.2.1. Beverage
- 6.2.2. Food
- 6.2.3. Aerosol
- 6.2.4. Other End-user Industries
- 6.1. Market Analysis, Insights and Forecast - by Type
- 7. North America Aluminum Cans Market Analysis, Insights and Forecast, 2021-2033
- 7.1. Market Analysis, Insights and Forecast - by Type
- 7.1.1. Slim
- 7.1.2. Sleek
- 7.1.3. Standard
- 7.1.4. Other Types
- 7.2. Market Analysis, Insights and Forecast - by End-user Industry
- 7.2.1. Beverage
- 7.2.2. Food
- 7.2.3. Aerosol
- 7.2.4. Other End-user Industries
- 7.1. Market Analysis, Insights and Forecast - by Type
- 8. Europe Aluminum Cans Market Analysis, Insights and Forecast, 2021-2033
- 8.1. Market Analysis, Insights and Forecast - by Type
- 8.1.1. Slim
- 8.1.2. Sleek
- 8.1.3. Standard
- 8.1.4. Other Types
- 8.2. Market Analysis, Insights and Forecast - by End-user Industry
- 8.2.1. Beverage
- 8.2.2. Food
- 8.2.3. Aerosol
- 8.2.4. Other End-user Industries
- 8.1. Market Analysis, Insights and Forecast - by Type
- 9. Asia Pacific Aluminum Cans Market Analysis, Insights and Forecast, 2021-2033
- 9.1. Market Analysis, Insights and Forecast - by Type
- 9.1.1. Slim
- 9.1.2. Sleek
- 9.1.3. Standard
- 9.1.4. Other Types
- 9.2. Market Analysis, Insights and Forecast - by End-user Industry
- 9.2.1. Beverage
- 9.2.2. Food
- 9.2.3. Aerosol
- 9.2.4. Other End-user Industries
- 9.1. Market Analysis, Insights and Forecast - by Type
- 10. Latin America Aluminum Cans Market Analysis, Insights and Forecast, 2021-2033
- 10.1. Market Analysis, Insights and Forecast - by Type
- 10.1.1. Slim
- 10.1.2. Sleek
- 10.1.3. Standard
- 10.1.4. Other Types
- 10.2. Market Analysis, Insights and Forecast - by End-user Industry
- 10.2.1. Beverage
- 10.2.2. Food
- 10.2.3. Aerosol
- 10.2.4. Other End-user Industries
- 10.1. Market Analysis, Insights and Forecast - by Type
- 11. Middle East and Africa Aluminum Cans Market Analysis, Insights and Forecast, 2021-2033
- 11.1. Market Analysis, Insights and Forecast - by Type
- 11.1.1. Slim
- 11.1.2. Sleek
- 11.1.3. Standard
- 11.1.4. Other Types
- 11.2. Market Analysis, Insights and Forecast - by End-user Industry
- 11.2.1. Beverage
- 11.2.2. Food
- 11.2.3. Aerosol
- 11.2.4. Other End-user Industries
- 11.1. Market Analysis, Insights and Forecast - by Type
- 12. Competitive Analysis
- 12.1. Company Profiles
- 12.1.1 CAN-PACK SA
- 12.1.1.1. Company Overview
- 12.1.1.2. Products
- 12.1.1.3. Company Financials
- 12.1.1.4. SWOT Analysis
- 12.1.2 Ball Corporation
- 12.1.2.1. Company Overview
- 12.1.2.2. Products
- 12.1.2.3. Company Financials
- 12.1.2.4. SWOT Analysis
- 12.1.3 Saudi Arabia Packaging Industry WLL (SAPIN)
- 12.1.3.1. Company Overview
- 12.1.3.2. Products
- 12.1.3.3. Company Financials
- 12.1.3.4. SWOT Analysis
- 12.1.4 Massilly Holding SAS
- 12.1.4.1. Company Overview
- 12.1.4.2. Products
- 12.1.4.3. Company Financials
- 12.1.4.4. SWOT Analysis
- 12.1.5 CCL Container Inc (CCL Industries Inc )
- 12.1.5.1. Company Overview
- 12.1.5.2. Products
- 12.1.5.3. Company Financials
- 12.1.5.4. SWOT Analysis
- 12.1.6 Crown Holdings Inc
- 12.1.6.1. Company Overview
- 12.1.6.2. Products
- 12.1.6.3. Company Financials
- 12.1.6.4. SWOT Analysis
- 12.1.7 CPMC HOLDINGS Limited (COFCO Group
- 12.1.7.1. Company Overview
- 12.1.7.2. Products
- 12.1.7.3. Company Financials
- 12.1.7.4. SWOT Analysis
- 12.1.8 Ardagh Group S A
- 12.1.8.1. Company Overview
- 12.1.8.2. Products
- 12.1.8.3. Company Financials
- 12.1.8.4. SWOT Analysis
- 12.1.9 Silgan Holdings Inc
- 12.1.9.1. Company Overview
- 12.1.9.2. Products
- 12.1.9.3. Company Financials
- 12.1.9.4. SWOT Analysis
- 12.1.10 Tecnocap Group
- 12.1.10.1. Company Overview
- 12.1.10.2. Products
- 12.1.10.3. Company Financials
- 12.1.10.4. SWOT Analysis
- 12.1.1 CAN-PACK SA
- 12.2. Market Entropy
- 12.2.1 Company's Key Areas Served
- 12.2.2 Recent Developments
- 12.3. Company Market Share Analysis 2025
- 12.3.1 Top 5 Companies Market Share Analysis
- 12.3.2 Top 3 Companies Market Share Analysis
- 12.4. List of Potential Customers
- 13. Research Methodology
List of Figures
- Figure 1: Global Aluminum Cans Market Revenue Breakdown (Million, %) by Region 2025 & 2033
- Figure 2: North America Aluminum Cans Market Revenue (Million), by Type 2025 & 2033
- Figure 3: North America Aluminum Cans Market Revenue Share (%), by Type 2025 & 2033
- Figure 4: North America Aluminum Cans Market Revenue (Million), by End-user Industry 2025 & 2033
- Figure 5: North America Aluminum Cans Market Revenue Share (%), by End-user Industry 2025 & 2033
- Figure 6: North America Aluminum Cans Market Revenue (Million), by Country 2025 & 2033
- Figure 7: North America Aluminum Cans Market Revenue Share (%), by Country 2025 & 2033
- Figure 8: Europe Aluminum Cans Market Revenue (Million), by Type 2025 & 2033
- Figure 9: Europe Aluminum Cans Market Revenue Share (%), by Type 2025 & 2033
- Figure 10: Europe Aluminum Cans Market Revenue (Million), by End-user Industry 2025 & 2033
- Figure 11: Europe Aluminum Cans Market Revenue Share (%), by End-user Industry 2025 & 2033
- Figure 12: Europe Aluminum Cans Market Revenue (Million), by Country 2025 & 2033
- Figure 13: Europe Aluminum Cans Market Revenue Share (%), by Country 2025 & 2033
- Figure 14: Asia Pacific Aluminum Cans Market Revenue (Million), by Type 2025 & 2033
- Figure 15: Asia Pacific Aluminum Cans Market Revenue Share (%), by Type 2025 & 2033
- Figure 16: Asia Pacific Aluminum Cans Market Revenue (Million), by End-user Industry 2025 & 2033
- Figure 17: Asia Pacific Aluminum Cans Market Revenue Share (%), by End-user Industry 2025 & 2033
- Figure 18: Asia Pacific Aluminum Cans Market Revenue (Million), by Country 2025 & 2033
- Figure 19: Asia Pacific Aluminum Cans Market Revenue Share (%), by Country 2025 & 2033
- Figure 20: Latin America Aluminum Cans Market Revenue (Million), by Type 2025 & 2033
- Figure 21: Latin America Aluminum Cans Market Revenue Share (%), by Type 2025 & 2033
- Figure 22: Latin America Aluminum Cans Market Revenue (Million), by End-user Industry 2025 & 2033
- Figure 23: Latin America Aluminum Cans Market Revenue Share (%), by End-user Industry 2025 & 2033
- Figure 24: Latin America Aluminum Cans Market Revenue (Million), by Country 2025 & 2033
- Figure 25: Latin America Aluminum Cans Market Revenue Share (%), by Country 2025 & 2033
- Figure 26: Middle East and Africa Aluminum Cans Market Revenue (Million), by Type 2025 & 2033
- Figure 27: Middle East and Africa Aluminum Cans Market Revenue Share (%), by Type 2025 & 2033
- Figure 28: Middle East and Africa Aluminum Cans Market Revenue (Million), by End-user Industry 2025 & 2033
- Figure 29: Middle East and Africa Aluminum Cans Market Revenue Share (%), by End-user Industry 2025 & 2033
- Figure 30: Middle East and Africa Aluminum Cans Market Revenue (Million), by Country 2025 & 2033
- Figure 31: Middle East and Africa Aluminum Cans Market Revenue Share (%), by Country 2025 & 2033
List of Tables
- Table 1: Global Aluminum Cans Market Revenue Million Forecast, by Type 2020 & 2033
- Table 2: Global Aluminum Cans Market Revenue Million Forecast, by End-user Industry 2020 & 2033
- Table 3: Global Aluminum Cans Market Revenue Million Forecast, by Region 2020 & 2033
- Table 4: Global Aluminum Cans Market Revenue Million Forecast, by Type 2020 & 2033
- Table 5: Global Aluminum Cans Market Revenue Million Forecast, by End-user Industry 2020 & 2033
- Table 6: Global Aluminum Cans Market Revenue Million Forecast, by Country 2020 & 2033
- Table 7: United States Aluminum Cans Market Revenue (Million) Forecast, by Application 2020 & 2033
- Table 8: Canada Aluminum Cans Market Revenue (Million) Forecast, by Application 2020 & 2033
- Table 9: Global Aluminum Cans Market Revenue Million Forecast, by Type 2020 & 2033
- Table 10: Global Aluminum Cans Market Revenue Million Forecast, by End-user Industry 2020 & 2033
- Table 11: Global Aluminum Cans Market Revenue Million Forecast, by Country 2020 & 2033
- Table 12: United Kingdom Aluminum Cans Market Revenue (Million) Forecast, by Application 2020 & 2033
- Table 13: Germany Aluminum Cans Market Revenue (Million) Forecast, by Application 2020 & 2033
- Table 14: France Aluminum Cans Market Revenue (Million) Forecast, by Application 2020 & 2033
- Table 15: Spain Aluminum Cans Market Revenue (Million) Forecast, by Application 2020 & 2033
- Table 16: Rest of Europe Aluminum Cans Market Revenue (Million) Forecast, by Application 2020 & 2033
- Table 17: Global Aluminum Cans Market Revenue Million Forecast, by Type 2020 & 2033
- Table 18: Global Aluminum Cans Market Revenue Million Forecast, by End-user Industry 2020 & 2033
- Table 19: Global Aluminum Cans Market Revenue Million Forecast, by Country 2020 & 2033
- Table 20: China Aluminum Cans Market Revenue (Million) Forecast, by Application 2020 & 2033
- Table 21: India Aluminum Cans Market Revenue (Million) Forecast, by Application 2020 & 2033
- Table 22: Japan Aluminum Cans Market Revenue (Million) Forecast, by Application 2020 & 2033
- Table 23: South Korea Aluminum Cans Market Revenue (Million) Forecast, by Application 2020 & 2033
- Table 24: Thailand Aluminum Cans Market Revenue (Million) Forecast, by Application 2020 & 2033
- Table 25: Rest of Asia Pacific Aluminum Cans Market Revenue (Million) Forecast, by Application 2020 & 2033
- Table 26: Global Aluminum Cans Market Revenue Million Forecast, by Type 2020 & 2033
- Table 27: Global Aluminum Cans Market Revenue Million Forecast, by End-user Industry 2020 & 2033
- Table 28: Global Aluminum Cans Market Revenue Million Forecast, by Country 2020 & 2033
- Table 29: Brazil Aluminum Cans Market Revenue (Million) Forecast, by Application 2020 & 2033
- Table 30: Mexico Aluminum Cans Market Revenue (Million) Forecast, by Application 2020 & 2033
- Table 31: Rest of Latin America Aluminum Cans Market Revenue (Million) Forecast, by Application 2020 & 2033
- Table 32: Global Aluminum Cans Market Revenue Million Forecast, by Type 2020 & 2033
- Table 33: Global Aluminum Cans Market Revenue Million Forecast, by End-user Industry 2020 & 2033
- Table 34: Global Aluminum Cans Market Revenue Million Forecast, by Country 2020 & 2033
- Table 35: United Arab Emirates Aluminum Cans Market Revenue (Million) Forecast, by Application 2020 & 2033
- Table 36: Saudi Arabia Aluminum Cans Market Revenue (Million) Forecast, by Application 2020 & 2033
- Table 37: South Africa Aluminum Cans Market Revenue (Million) Forecast, by Application 2020 & 2033
- Table 38: Rest of Middle East Aluminum Cans Market Revenue (Million) Forecast, by Application 2020 & 2033
Frequently Asked Questions
1. What is the projected Compound Annual Growth Rate (CAGR) of the Aluminum Cans Market?
The projected CAGR is approximately 4.53%.
2. Which companies are prominent players in the Aluminum Cans Market?
Key companies in the market include CAN-PACK SA, Ball Corporation, Saudi Arabia Packaging Industry WLL (SAPIN), Massilly Holding SAS, CCL Container Inc (CCL Industries Inc ), Crown Holdings Inc, CPMC HOLDINGS Limited (COFCO Group, Ardagh Group S A, Silgan Holdings Inc, Tecnocap Group.
3. What are the main segments of the Aluminum Cans Market?
The market segments include Type, End-user Industry.
4. Can you provide details about the market size?
The market size is estimated to be USD 51.20 Million as of 2022.
5. What are some drivers contributing to market growth?
High Recyclability Rates of Aluminum Cans; Increasing Demand for Canned Foods driven by Cost and Convenience-related Advantages.
6. What are the notable trends driving market growth?
Food and Beverages Segment to Drive the Market.
7. Are there any restraints impacting market growth?
Availability of Alternative Packaging Solutions.
8. Can you provide examples of recent developments in the market?
February 2024 - Emirates Global Aluminium (EGA), the leading aluminum giant in the UAE, has partnered with beverage can manufacturers Crown and CANPACK to launch "Every Can Counts," an innovative campaign aimed at promoting the recycling of used aluminum drink cans. This initiative, introduced during COP28, represents a crucial step towards fostering a circular economy in the United Arab Emirates.
9. What pricing options are available for accessing the report?
Pricing options include single-user, multi-user, and enterprise licenses priced at USD 4750, USD 5250, and USD 8750 respectively.
10. Is the market size provided in terms of value or volume?
The market size is provided in terms of value, measured in Million.
11. Are there any specific market keywords associated with the report?
Yes, the market keyword associated with the report is "Aluminum Cans Market," which aids in identifying and referencing the specific market segment covered.
12. How do I determine which pricing option suits my needs best?
The pricing options vary based on user requirements and access needs. Individual users may opt for single-user licenses, while businesses requiring broader access may choose multi-user or enterprise licenses for cost-effective access to the report.
13. Are there any additional resources or data provided in the Aluminum Cans Market report?
While the report offers comprehensive insights, it's advisable to review the specific contents or supplementary materials provided to ascertain if additional resources or data are available.
14. How can I stay updated on further developments or reports in the Aluminum Cans Market?
To stay informed about further developments, trends, and reports in the Aluminum Cans Market, consider subscribing to industry newsletters, following relevant companies and organizations, or regularly checking reputable industry news sources and publications.
Methodology
Step 1 - Identification of Relevant Samples Size from Population Database


Step 2 - Approaches for Defining Global Market Size (Value, Volume* & Price*)

Note*: In applicable scenarios
Step 3 - Data Sources
Primary Research
- Web Analytics
- Survey Reports
- Research Institute
- Latest Research Reports
- Opinion Leaders
Secondary Research
- Annual Reports
- White Paper
- Latest Press Release
- Industry Association
- Paid Database
- Investor Presentations

Step 4 - Data Triangulation
Involves using different sources of information in order to increase the validity of a study
These sources are likely to be stakeholders in a program - participants, other researchers, program staff, other community members, and so on.
Then we put all data in single framework & apply various statistical tools to find out the dynamic on the market.
During the analysis stage, feedback from the stakeholder groups would be compared to determine areas of agreement as well as areas of divergence