

Key Insights
The US aerosol can market is projected to reach $12.56 billion by 2033, exhibiting a Compound Annual Growth Rate (CAGR) of 5.75% from a base year of 2025. This growth is propelled by escalating demand for convenient packaging solutions across personal care, household goods, and industrial applications. Key drivers include the rising popularity of aerosolized personal care products, household cleaning sprays, and paints. Aluminum packaging leads, favored for its recyclability and versatility. Market challenges include stringent environmental regulations on propellants and growing consumer preference for sustainable alternatives. Innovations in eco-friendly propellants and materials offer significant opportunities for market participants. Regional growth is anticipated to be higher in densely populated and economically active areas like the Northeast and West. Leading manufacturers such as CCL Container, Ball Corporation, and Crown Holdings Inc. are focusing on material science and advanced manufacturing to maintain competitive advantage.
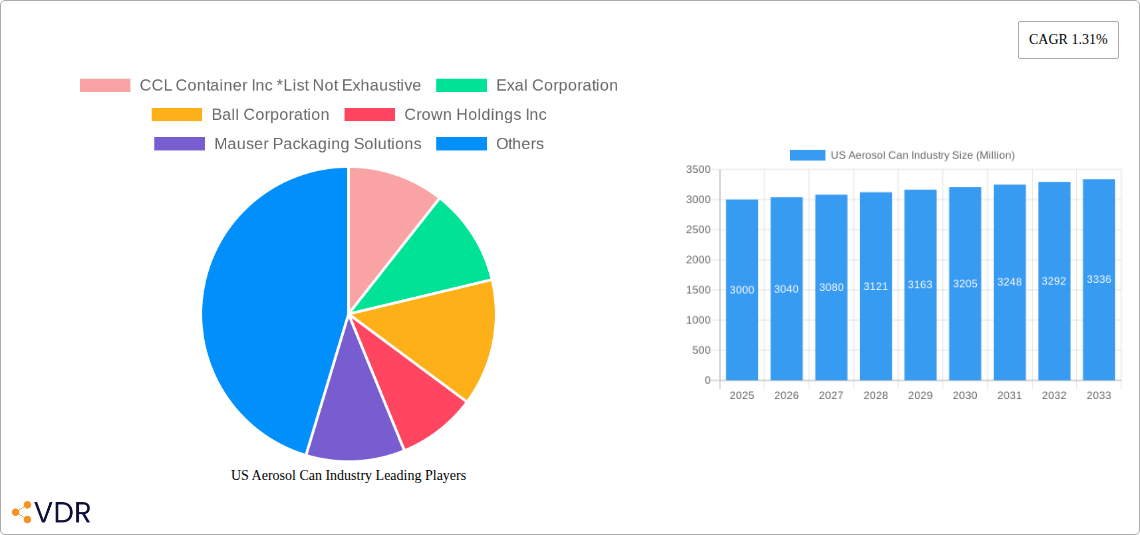
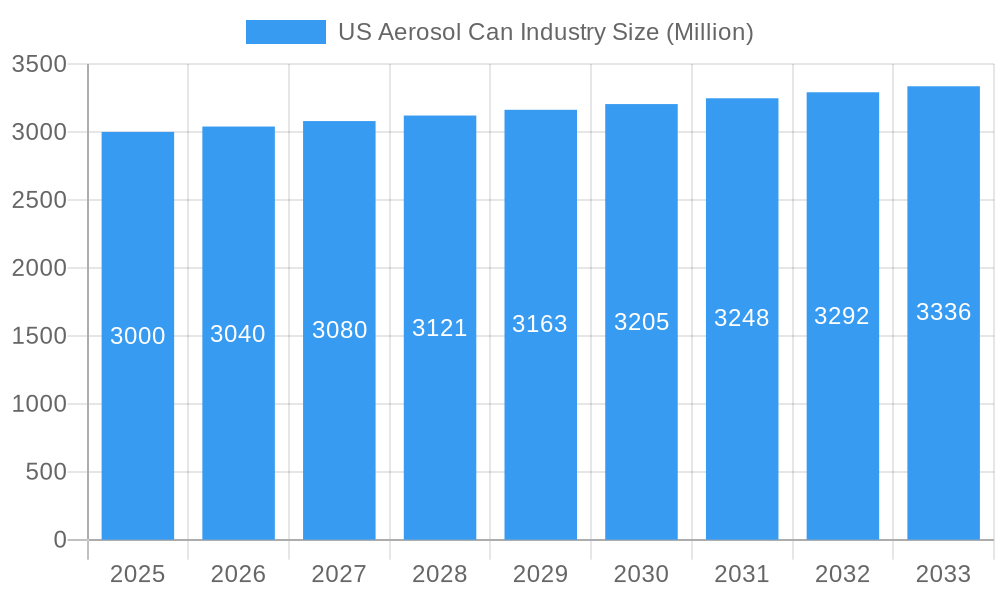
US Aerosol Can Industry Market Size (In Billion)
The forecast period (2025-2033) will witness a significant trend towards sustainable aerosol can production, driven by the increased use of recycled materials and the development of biodegradable propellants. While overall market growth is steady, segments within personal care and household products are expected to experience accelerated expansion due to product innovation and evolving consumer preferences. Intense competition among key players will persist, emphasizing cost efficiency, robust supply chains, and product differentiation. The automotive and industrial sectors represent a substantial market, albeit with slower growth potential due to industry cyclicality and established packaging norms. The market offers a stable investment outlook, with promising returns anticipated in niche segments prioritizing sustainable practices.
US Aerosol Can Industry Company Market Share
US Aerosol Can Industry Market Report: 2019-2033
This comprehensive report provides an in-depth analysis of the US aerosol can industry, encompassing market dynamics, growth trends, key players, and future outlook. The study covers the period 2019-2033, with a focus on the base year 2025 and a forecast period of 2025-2033. The report is essential for industry professionals, investors, and strategic decision-makers seeking a detailed understanding of this dynamic market. Market size is presented in Million units.
US Aerosol Can Industry Market Dynamics & Structure
This section analyzes the competitive landscape, technological advancements, regulatory environment, and market trends within the US aerosol can industry. The market is characterized by a moderate level of concentration, with several major players dominating the market share.
Market Concentration & Competitive Dynamics:
- Market share held by top 5 players: 60% (estimated)
- High barriers to entry due to specialized manufacturing and high capital expenditure.
- Increased M&A activity observed in the historical period (2019-2024), with approximately xx deals recorded. This suggests a trend towards consolidation.
Technological Innovation Drivers:
- Lightweighting of cans to reduce material costs and improve sustainability.
- Development of new coatings and materials to enhance product shelf life and performance.
- Advancements in can manufacturing processes to improve efficiency and reduce waste.
Regulatory Frameworks & Compliance:
- Stringent environmental regulations impacting material selection and waste management.
- Growing demand for recyclable and sustainable aerosol cans.
- Compliance with labeling and safety regulations.
Competitive Product Substitutes & Challenges:
- Pressure from alternative packaging solutions (e.g., pumps, pouches).
- Innovation barriers related to material compatibility and cost-effectiveness.
- Fluctuations in raw material prices impact profitability.
End-User Demographics & Trends:
- Growing demand from the cosmetic and personal care sector.
- Steady growth in household and pharmaceutical/veterinary segments.
- Increased adoption of aerosol cans in the automotive and industrial sectors.
US Aerosol Can Industry Growth Trends & Insights
The US aerosol can market exhibits steady growth driven by increasing demand across various end-use sectors. Market size witnessed a Compound Annual Growth Rate (CAGR) of xx% during the historical period (2019-2024), reaching xx million units in 2024. This growth is expected to continue at a CAGR of xx% during the forecast period (2025-2033), reaching an estimated xx million units by 2033. This growth is attributed to several factors including expanding end-user applications, consumer preference shifts, and technological advancements.
Technological disruptions, such as the introduction of sustainable materials and improved manufacturing processes, are further stimulating market expansion. Changes in consumer behavior, notably increased preference for convenience and eco-friendly products, are significantly impacting market adoption rates. Specific details on market penetration and adoption rates across various segments are provided within the complete report.
Dominant Regions, Countries, or Segments in US Aerosol Can Industry
The Cosmetic and Personal Care segment is currently the leading end-user, followed by Household and Paints and Varnishes. In terms of product type, Aluminum cans dominate the market due to their lightweight nature and recyclability, followed by Steel-Tinplate.
Key Drivers for Dominant Segments:
- Cosmetic and Personal Care: Growing consumer spending on beauty and personal care products.
- Household: Increasing demand for convenient and easy-to-use household cleaning and maintenance products.
- Aluminum: Superior properties for recyclability and lightweight design, aligning with sustainability trends.
Market Share and Growth Potential:
- Aluminum cans hold approximately xx% of the market share, with projected growth of xx% during the forecast period.
- The Cosmetic and Personal Care segment is projected to maintain its dominant position, with a growth rate of xx% during the forecast period.
US Aerosol Can Industry Product Landscape
The US aerosol can market features a diverse range of products tailored to specific applications. Aluminum cans dominate due to their lightweight, recyclable nature, and suitability for various contents. Steel-tinplate cans offer superior strength and are often used for high-pressure applications. Innovation focuses on sustainable materials, improved coatings for enhanced product shelf life, and advanced dispensing mechanisms for precise application. Unique selling propositions center around convenience, safety, and sustainability.
Key Drivers, Barriers & Challenges in US Aerosol Can Industry
Key Drivers:
- Growing demand across various end-use sectors.
- Advancements in can manufacturing technology.
- Increased consumer preference for convenient packaging.
Key Challenges:
- Fluctuations in raw material prices (e.g., aluminum, steel).
- Stringent environmental regulations and sustainability concerns.
- Competition from alternative packaging solutions.
- Supply chain disruptions impacting production and delivery times.
Emerging Opportunities in US Aerosol Can Industry
- Expansion into niche markets such as pharmaceuticals and veterinary products.
- Development of biodegradable and compostable aerosol cans.
- Growing demand for customized and aesthetically appealing aerosol can designs.
Growth Accelerators in the US Aerosol Can Industry
Long-term growth will be propelled by technological advancements in sustainable materials and manufacturing processes, strategic partnerships to expand market reach and distribution networks, and the successful penetration into new and emerging market segments such as sustainable packaging solutions.
Key Players Shaping the US Aerosol Can Industry Market
- CCL Container Inc
- Exal Corporation
- Ball Corporation
- Crown Holdings Inc
- Mauser Packaging Solutions
Notable Milestones in US Aerosol Can Industry Sector
- 2021: Introduction of a new biodegradable aerosol can by [Company Name, if available].
- 2022: Major merger between two key players in the industry [Company Names, if available].
- 2023: Launch of a new sustainable coating technology by [Company Name, if available].
In-Depth US Aerosol Can Industry Market Outlook
The future of the US aerosol can industry appears promising, driven by continued demand across diverse sectors and a strong focus on sustainability. Strategic opportunities exist for companies to capitalize on emerging trends, such as eco-friendly materials and innovative dispensing technologies. The market is poised for further consolidation and growth, with significant potential for companies that can adapt to evolving consumer preferences and regulatory landscapes.
US Aerosol Can Industry Segmentation
-
1. Product type
- 1.1. Aluminum
- 1.2. Steel-Tinplate
- 1.3. Other Materials
-
2. End-User
- 2.1. Cosmetic and Personal Care
- 2.2. Household
- 2.3. Pharmaceutical/Veterinary
- 2.4. Paints and Varnishes
- 2.5. Automotive/Industrial
- 2.6. Other End Users
US Aerosol Can Industry Segmentation By Geography
-
1. North America
- 1.1. United States
- 1.2. Canada
- 1.3. Mexico
-
2. South America
- 2.1. Brazil
- 2.2. Argentina
- 2.3. Rest of South America
-
3. Europe
- 3.1. United Kingdom
- 3.2. Germany
- 3.3. France
- 3.4. Italy
- 3.5. Spain
- 3.6. Russia
- 3.7. Benelux
- 3.8. Nordics
- 3.9. Rest of Europe
-
4. Middle East & Africa
- 4.1. Turkey
- 4.2. Israel
- 4.3. GCC
- 4.4. North Africa
- 4.5. South Africa
- 4.6. Rest of Middle East & Africa
-
5. Asia Pacific
- 5.1. China
- 5.2. India
- 5.3. Japan
- 5.4. South Korea
- 5.5. ASEAN
- 5.6. Oceania
- 5.7. Rest of Asia Pacific
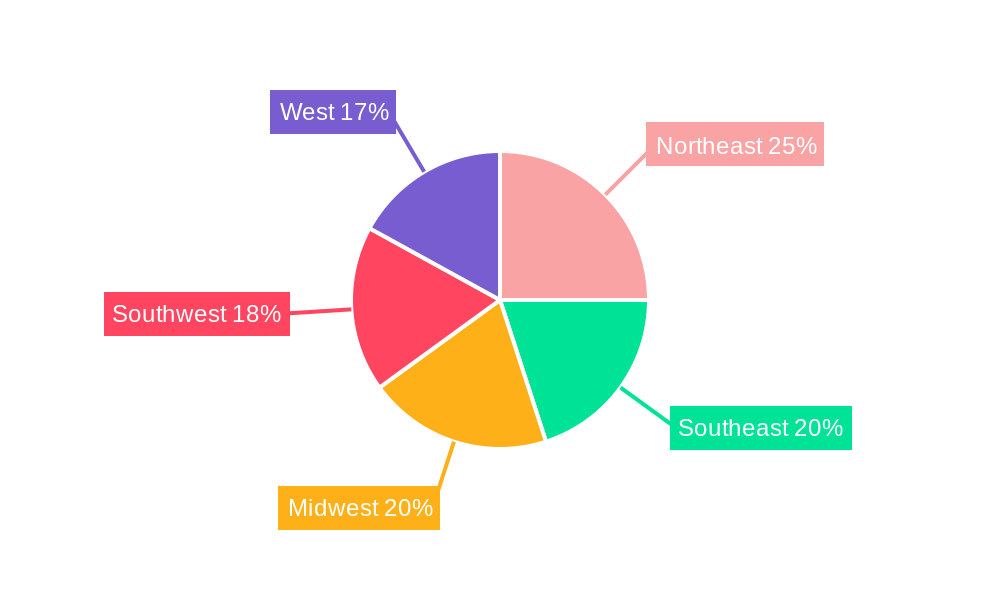
US Aerosol Can Industry Regional Market Share
Geographic Coverage of US Aerosol Can Industry
US Aerosol Can Industry REPORT HIGHLIGHTS
| Aspects | Details |
|---|---|
| Study Period | 2020-2034 |
| Base Year | 2025 |
| Estimated Year | 2026 |
| Forecast Period | 2026-2034 |
| Historical Period | 2020-2025 |
| Growth Rate | CAGR of 5.75% from 2020-2034 |
| Segmentation |
|
Table of Contents
- 1. Introduction
- 1.1. Research Scope
- 1.2. Market Segmentation
- 1.3. Research Objective
- 1.4. Definitions and Assumptions
- 2. Executive Summary
- 2.1. Market Snapshot
- 3. Market Dynamics
- 3.1. Market Drivers
- 3.2. Market Restrains
- 3.3. Market Trends
- 3.4. Market Opportunities
- 4. Market Factor Analysis
- 4.1. Porters Five Forces
- 4.1.1. Bargaining Power of Suppliers
- 4.1.2. Bargaining Power of Buyers
- 4.1.3. Threat of New Entrants
- 4.1.4. Threat of Substitutes
- 4.1.5. Competitive Rivalry
- 4.2. PESTEL analysis
- 4.3. BCG Analysis
- 4.3.1. Stars (High Growth, High Market Share)
- 4.3.2. Cash Cows (Low Growth, High Market Share)
- 4.3.3. Question Mark (High Growth, Low Market Share)
- 4.3.4. Dogs (Low Growth, Low Market Share)
- 4.4. Ansoff Matrix Analysis
- 4.5. Supply Chain Analysis
- 4.6. Regulatory Landscape
- 4.7. Current Market Potential and Opportunity Assessment (TAM–SAM–SOM Framework)
- 4.8. VDR Analyst Note
- 4.1. Porters Five Forces
- 5. Market Analysis, Insights and Forecast 2021-2033
- 5.1. Market Analysis, Insights and Forecast - by Product type
- 5.1.1. Aluminum
- 5.1.2. Steel-Tinplate
- 5.1.3. Other Materials
- 5.2. Market Analysis, Insights and Forecast - by End-User
- 5.2.1. Cosmetic and Personal Care
- 5.2.2. Household
- 5.2.3. Pharmaceutical/Veterinary
- 5.2.4. Paints and Varnishes
- 5.2.5. Automotive/Industrial
- 5.2.6. Other End Users
- 5.3. Market Analysis, Insights and Forecast - by Region
- 5.3.1. North America
- 5.3.2. South America
- 5.3.3. Europe
- 5.3.4. Middle East & Africa
- 5.3.5. Asia Pacific
- 5.1. Market Analysis, Insights and Forecast - by Product type
- 6. Global US Aerosol Can Industry Analysis, Insights and Forecast, 2021-2033
- 6.1. Market Analysis, Insights and Forecast - by Product type
- 6.1.1. Aluminum
- 6.1.2. Steel-Tinplate
- 6.1.3. Other Materials
- 6.2. Market Analysis, Insights and Forecast - by End-User
- 6.2.1. Cosmetic and Personal Care
- 6.2.2. Household
- 6.2.3. Pharmaceutical/Veterinary
- 6.2.4. Paints and Varnishes
- 6.2.5. Automotive/Industrial
- 6.2.6. Other End Users
- 6.1. Market Analysis, Insights and Forecast - by Product type
- 7. North America US Aerosol Can Industry Analysis, Insights and Forecast, 2021-2033
- 7.1. Market Analysis, Insights and Forecast - by Product type
- 7.1.1. Aluminum
- 7.1.2. Steel-Tinplate
- 7.1.3. Other Materials
- 7.2. Market Analysis, Insights and Forecast - by End-User
- 7.2.1. Cosmetic and Personal Care
- 7.2.2. Household
- 7.2.3. Pharmaceutical/Veterinary
- 7.2.4. Paints and Varnishes
- 7.2.5. Automotive/Industrial
- 7.2.6. Other End Users
- 7.1. Market Analysis, Insights and Forecast - by Product type
- 8. South America US Aerosol Can Industry Analysis, Insights and Forecast, 2021-2033
- 8.1. Market Analysis, Insights and Forecast - by Product type
- 8.1.1. Aluminum
- 8.1.2. Steel-Tinplate
- 8.1.3. Other Materials
- 8.2. Market Analysis, Insights and Forecast - by End-User
- 8.2.1. Cosmetic and Personal Care
- 8.2.2. Household
- 8.2.3. Pharmaceutical/Veterinary
- 8.2.4. Paints and Varnishes
- 8.2.5. Automotive/Industrial
- 8.2.6. Other End Users
- 8.1. Market Analysis, Insights and Forecast - by Product type
- 9. Europe US Aerosol Can Industry Analysis, Insights and Forecast, 2021-2033
- 9.1. Market Analysis, Insights and Forecast - by Product type
- 9.1.1. Aluminum
- 9.1.2. Steel-Tinplate
- 9.1.3. Other Materials
- 9.2. Market Analysis, Insights and Forecast - by End-User
- 9.2.1. Cosmetic and Personal Care
- 9.2.2. Household
- 9.2.3. Pharmaceutical/Veterinary
- 9.2.4. Paints and Varnishes
- 9.2.5. Automotive/Industrial
- 9.2.6. Other End Users
- 9.1. Market Analysis, Insights and Forecast - by Product type
- 10. Middle East & Africa US Aerosol Can Industry Analysis, Insights and Forecast, 2021-2033
- 10.1. Market Analysis, Insights and Forecast - by Product type
- 10.1.1. Aluminum
- 10.1.2. Steel-Tinplate
- 10.1.3. Other Materials
- 10.2. Market Analysis, Insights and Forecast - by End-User
- 10.2.1. Cosmetic and Personal Care
- 10.2.2. Household
- 10.2.3. Pharmaceutical/Veterinary
- 10.2.4. Paints and Varnishes
- 10.2.5. Automotive/Industrial
- 10.2.6. Other End Users
- 10.1. Market Analysis, Insights and Forecast - by Product type
- 11. Asia Pacific US Aerosol Can Industry Analysis, Insights and Forecast, 2021-2033
- 11.1. Market Analysis, Insights and Forecast - by Product type
- 11.1.1. Aluminum
- 11.1.2. Steel-Tinplate
- 11.1.3. Other Materials
- 11.2. Market Analysis, Insights and Forecast - by End-User
- 11.2.1. Cosmetic and Personal Care
- 11.2.2. Household
- 11.2.3. Pharmaceutical/Veterinary
- 11.2.4. Paints and Varnishes
- 11.2.5. Automotive/Industrial
- 11.2.6. Other End Users
- 11.1. Market Analysis, Insights and Forecast - by Product type
- 12. Competitive Analysis
- 12.1. Company Profiles
- 12.1.1 CCL Container Inc *List Not Exhaustive
- 12.1.1.1. Company Overview
- 12.1.1.2. Products
- 12.1.1.3. Company Financials
- 12.1.1.4. SWOT Analysis
- 12.1.2 Exal Corporation
- 12.1.2.1. Company Overview
- 12.1.2.2. Products
- 12.1.2.3. Company Financials
- 12.1.2.4. SWOT Analysis
- 12.1.3 Ball Corporation
- 12.1.3.1. Company Overview
- 12.1.3.2. Products
- 12.1.3.3. Company Financials
- 12.1.3.4. SWOT Analysis
- 12.1.4 Crown Holdings Inc
- 12.1.4.1. Company Overview
- 12.1.4.2. Products
- 12.1.4.3. Company Financials
- 12.1.4.4. SWOT Analysis
- 12.1.5 Mauser Packaging Solutions
- 12.1.5.1. Company Overview
- 12.1.5.2. Products
- 12.1.5.3. Company Financials
- 12.1.5.4. SWOT Analysis
- 12.1.1 CCL Container Inc *List Not Exhaustive
- 12.2. Market Entropy
- 12.2.1 Company's Key Areas Served
- 12.2.2 Recent Developments
- 12.3. Company Market Share Analysis 2025
- 12.3.1 Top 5 Companies Market Share Analysis
- 12.3.2 Top 3 Companies Market Share Analysis
- 12.4. List of Potential Customers
- 13. Research Methodology
List of Figures
- Figure 1: Global US Aerosol Can Industry Revenue Breakdown (billion, %) by Region 2025 & 2033
- Figure 2: North America US Aerosol Can Industry Revenue (billion), by Product type 2025 & 2033
- Figure 3: North America US Aerosol Can Industry Revenue Share (%), by Product type 2025 & 2033
- Figure 4: North America US Aerosol Can Industry Revenue (billion), by End-User 2025 & 2033
- Figure 5: North America US Aerosol Can Industry Revenue Share (%), by End-User 2025 & 2033
- Figure 6: North America US Aerosol Can Industry Revenue (billion), by Country 2025 & 2033
- Figure 7: North America US Aerosol Can Industry Revenue Share (%), by Country 2025 & 2033
- Figure 8: South America US Aerosol Can Industry Revenue (billion), by Product type 2025 & 2033
- Figure 9: South America US Aerosol Can Industry Revenue Share (%), by Product type 2025 & 2033
- Figure 10: South America US Aerosol Can Industry Revenue (billion), by End-User 2025 & 2033
- Figure 11: South America US Aerosol Can Industry Revenue Share (%), by End-User 2025 & 2033
- Figure 12: South America US Aerosol Can Industry Revenue (billion), by Country 2025 & 2033
- Figure 13: South America US Aerosol Can Industry Revenue Share (%), by Country 2025 & 2033
- Figure 14: Europe US Aerosol Can Industry Revenue (billion), by Product type 2025 & 2033
- Figure 15: Europe US Aerosol Can Industry Revenue Share (%), by Product type 2025 & 2033
- Figure 16: Europe US Aerosol Can Industry Revenue (billion), by End-User 2025 & 2033
- Figure 17: Europe US Aerosol Can Industry Revenue Share (%), by End-User 2025 & 2033
- Figure 18: Europe US Aerosol Can Industry Revenue (billion), by Country 2025 & 2033
- Figure 19: Europe US Aerosol Can Industry Revenue Share (%), by Country 2025 & 2033
- Figure 20: Middle East & Africa US Aerosol Can Industry Revenue (billion), by Product type 2025 & 2033
- Figure 21: Middle East & Africa US Aerosol Can Industry Revenue Share (%), by Product type 2025 & 2033
- Figure 22: Middle East & Africa US Aerosol Can Industry Revenue (billion), by End-User 2025 & 2033
- Figure 23: Middle East & Africa US Aerosol Can Industry Revenue Share (%), by End-User 2025 & 2033
- Figure 24: Middle East & Africa US Aerosol Can Industry Revenue (billion), by Country 2025 & 2033
- Figure 25: Middle East & Africa US Aerosol Can Industry Revenue Share (%), by Country 2025 & 2033
- Figure 26: Asia Pacific US Aerosol Can Industry Revenue (billion), by Product type 2025 & 2033
- Figure 27: Asia Pacific US Aerosol Can Industry Revenue Share (%), by Product type 2025 & 2033
- Figure 28: Asia Pacific US Aerosol Can Industry Revenue (billion), by End-User 2025 & 2033
- Figure 29: Asia Pacific US Aerosol Can Industry Revenue Share (%), by End-User 2025 & 2033
- Figure 30: Asia Pacific US Aerosol Can Industry Revenue (billion), by Country 2025 & 2033
- Figure 31: Asia Pacific US Aerosol Can Industry Revenue Share (%), by Country 2025 & 2033
List of Tables
- Table 1: Global US Aerosol Can Industry Revenue billion Forecast, by Product type 2020 & 2033
- Table 2: Global US Aerosol Can Industry Revenue billion Forecast, by End-User 2020 & 2033
- Table 3: Global US Aerosol Can Industry Revenue billion Forecast, by Region 2020 & 2033
- Table 4: Global US Aerosol Can Industry Revenue billion Forecast, by Product type 2020 & 2033
- Table 5: Global US Aerosol Can Industry Revenue billion Forecast, by End-User 2020 & 2033
- Table 6: Global US Aerosol Can Industry Revenue billion Forecast, by Country 2020 & 2033
- Table 7: United States US Aerosol Can Industry Revenue (billion) Forecast, by Application 2020 & 2033
- Table 8: Canada US Aerosol Can Industry Revenue (billion) Forecast, by Application 2020 & 2033
- Table 9: Mexico US Aerosol Can Industry Revenue (billion) Forecast, by Application 2020 & 2033
- Table 10: Global US Aerosol Can Industry Revenue billion Forecast, by Product type 2020 & 2033
- Table 11: Global US Aerosol Can Industry Revenue billion Forecast, by End-User 2020 & 2033
- Table 12: Global US Aerosol Can Industry Revenue billion Forecast, by Country 2020 & 2033
- Table 13: Brazil US Aerosol Can Industry Revenue (billion) Forecast, by Application 2020 & 2033
- Table 14: Argentina US Aerosol Can Industry Revenue (billion) Forecast, by Application 2020 & 2033
- Table 15: Rest of South America US Aerosol Can Industry Revenue (billion) Forecast, by Application 2020 & 2033
- Table 16: Global US Aerosol Can Industry Revenue billion Forecast, by Product type 2020 & 2033
- Table 17: Global US Aerosol Can Industry Revenue billion Forecast, by End-User 2020 & 2033
- Table 18: Global US Aerosol Can Industry Revenue billion Forecast, by Country 2020 & 2033
- Table 19: United Kingdom US Aerosol Can Industry Revenue (billion) Forecast, by Application 2020 & 2033
- Table 20: Germany US Aerosol Can Industry Revenue (billion) Forecast, by Application 2020 & 2033
- Table 21: France US Aerosol Can Industry Revenue (billion) Forecast, by Application 2020 & 2033
- Table 22: Italy US Aerosol Can Industry Revenue (billion) Forecast, by Application 2020 & 2033
- Table 23: Spain US Aerosol Can Industry Revenue (billion) Forecast, by Application 2020 & 2033
- Table 24: Russia US Aerosol Can Industry Revenue (billion) Forecast, by Application 2020 & 2033
- Table 25: Benelux US Aerosol Can Industry Revenue (billion) Forecast, by Application 2020 & 2033
- Table 26: Nordics US Aerosol Can Industry Revenue (billion) Forecast, by Application 2020 & 2033
- Table 27: Rest of Europe US Aerosol Can Industry Revenue (billion) Forecast, by Application 2020 & 2033
- Table 28: Global US Aerosol Can Industry Revenue billion Forecast, by Product type 2020 & 2033
- Table 29: Global US Aerosol Can Industry Revenue billion Forecast, by End-User 2020 & 2033
- Table 30: Global US Aerosol Can Industry Revenue billion Forecast, by Country 2020 & 2033
- Table 31: Turkey US Aerosol Can Industry Revenue (billion) Forecast, by Application 2020 & 2033
- Table 32: Israel US Aerosol Can Industry Revenue (billion) Forecast, by Application 2020 & 2033
- Table 33: GCC US Aerosol Can Industry Revenue (billion) Forecast, by Application 2020 & 2033
- Table 34: North Africa US Aerosol Can Industry Revenue (billion) Forecast, by Application 2020 & 2033
- Table 35: South Africa US Aerosol Can Industry Revenue (billion) Forecast, by Application 2020 & 2033
- Table 36: Rest of Middle East & Africa US Aerosol Can Industry Revenue (billion) Forecast, by Application 2020 & 2033
- Table 37: Global US Aerosol Can Industry Revenue billion Forecast, by Product type 2020 & 2033
- Table 38: Global US Aerosol Can Industry Revenue billion Forecast, by End-User 2020 & 2033
- Table 39: Global US Aerosol Can Industry Revenue billion Forecast, by Country 2020 & 2033
- Table 40: China US Aerosol Can Industry Revenue (billion) Forecast, by Application 2020 & 2033
- Table 41: India US Aerosol Can Industry Revenue (billion) Forecast, by Application 2020 & 2033
- Table 42: Japan US Aerosol Can Industry Revenue (billion) Forecast, by Application 2020 & 2033
- Table 43: South Korea US Aerosol Can Industry Revenue (billion) Forecast, by Application 2020 & 2033
- Table 44: ASEAN US Aerosol Can Industry Revenue (billion) Forecast, by Application 2020 & 2033
- Table 45: Oceania US Aerosol Can Industry Revenue (billion) Forecast, by Application 2020 & 2033
- Table 46: Rest of Asia Pacific US Aerosol Can Industry Revenue (billion) Forecast, by Application 2020 & 2033
Frequently Asked Questions
1. What is the projected Compound Annual Growth Rate (CAGR) of the US Aerosol Can Industry?
The projected CAGR is approximately 5.75%.
2. Which companies are prominent players in the US Aerosol Can Industry?
Key companies in the market include CCL Container Inc *List Not Exhaustive, Exal Corporation, Ball Corporation, Crown Holdings Inc, Mauser Packaging Solutions.
3. What are the main segments of the US Aerosol Can Industry?
The market segments include Product type, End-User.
4. Can you provide details about the market size?
The market size is estimated to be USD 12.56 billion as of 2022.
5. What are some drivers contributing to market growth?
; Growing Demand from the Cosmetic Industry.
6. What are the notable trends driving market growth?
Aluminum Cans to Register Highest Growth.
7. Are there any restraints impacting market growth?
; Increasing Competition from Substitute Packaging.
8. Can you provide examples of recent developments in the market?
N/A
9. What pricing options are available for accessing the report?
Pricing options include single-user, multi-user, and enterprise licenses priced at USD 3800, USD 4500, and USD 5800 respectively.
10. Is the market size provided in terms of value or volume?
The market size is provided in terms of value, measured in billion.
11. Are there any specific market keywords associated with the report?
Yes, the market keyword associated with the report is "US Aerosol Can Industry," which aids in identifying and referencing the specific market segment covered.
12. How do I determine which pricing option suits my needs best?
The pricing options vary based on user requirements and access needs. Individual users may opt for single-user licenses, while businesses requiring broader access may choose multi-user or enterprise licenses for cost-effective access to the report.
13. Are there any additional resources or data provided in the US Aerosol Can Industry report?
While the report offers comprehensive insights, it's advisable to review the specific contents or supplementary materials provided to ascertain if additional resources or data are available.
14. How can I stay updated on further developments or reports in the US Aerosol Can Industry?
To stay informed about further developments, trends, and reports in the US Aerosol Can Industry, consider subscribing to industry newsletters, following relevant companies and organizations, or regularly checking reputable industry news sources and publications.
Methodology
Step 1 - Identification of Relevant Samples Size from Population Database


Step 2 - Approaches for Defining Global Market Size (Value, Volume* & Price*)

Note*: In applicable scenarios
Step 3 - Data Sources
Primary Research
- Web Analytics
- Survey Reports
- Research Institute
- Latest Research Reports
- Opinion Leaders
Secondary Research
- Annual Reports
- White Paper
- Latest Press Release
- Industry Association
- Paid Database
- Investor Presentations

Step 4 - Data Triangulation
Involves using different sources of information in order to increase the validity of a study
These sources are likely to be stakeholders in a program - participants, other researchers, program staff, other community members, and so on.
Then we put all data in single framework & apply various statistical tools to find out the dynamic on the market.
During the analysis stage, feedback from the stakeholder groups would be compared to determine areas of agreement as well as areas of divergence