

Key Insights
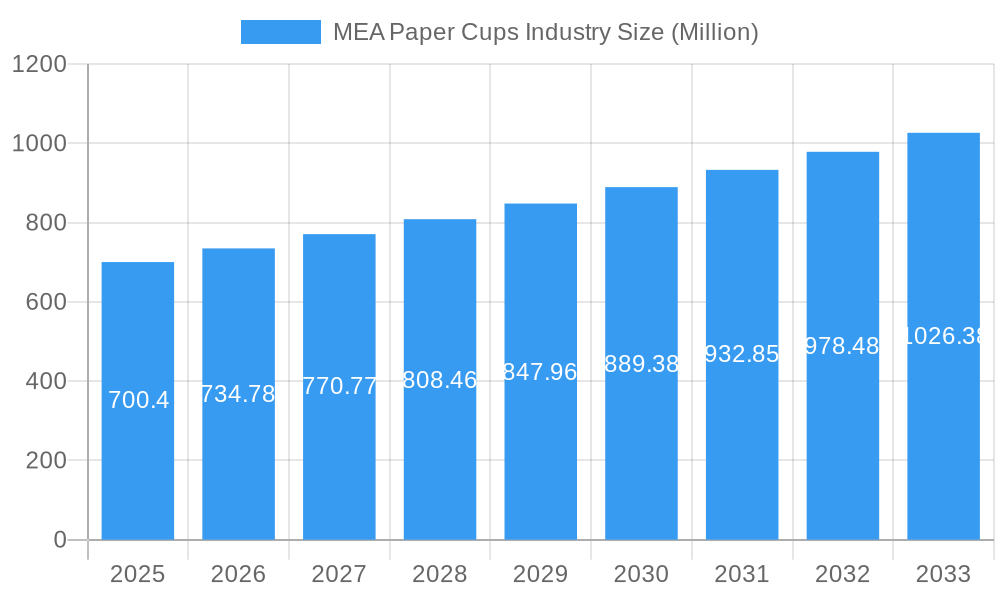
The Middle East and Africa (MEA) paper cups market is poised for significant expansion, with a current market size estimated at USD 700.40 million and a projected Compound Annual Growth Rate (CAGR) of 4.81% from 2025 to 2033. This robust growth is primarily fueled by an increasing demand for disposable convenience and a burgeoning foodservice sector across the region. Key drivers include the rapid urbanization and population growth in countries like Egypt, Nigeria, and Kenya, which directly translate to a higher consumption of ready-to-eat meals and beverages, thus amplifying the need for paper cups. The expansion of quick-service restaurants (QSRs) and coffee shop chains, particularly in the GCC countries and South Africa, is a major contributor, as these establishments rely heavily on single-use paper cups for their daily operations. Furthermore, a growing awareness regarding the environmental impact of plastic, coupled with stricter government regulations on single-use plastics in some MEA nations, is gradually shifting consumer and business preferences towards more sustainable alternatives like paper cups. This environmental consciousness, though still developing across the entire region, presents a substantial opportunity for paper cup manufacturers.
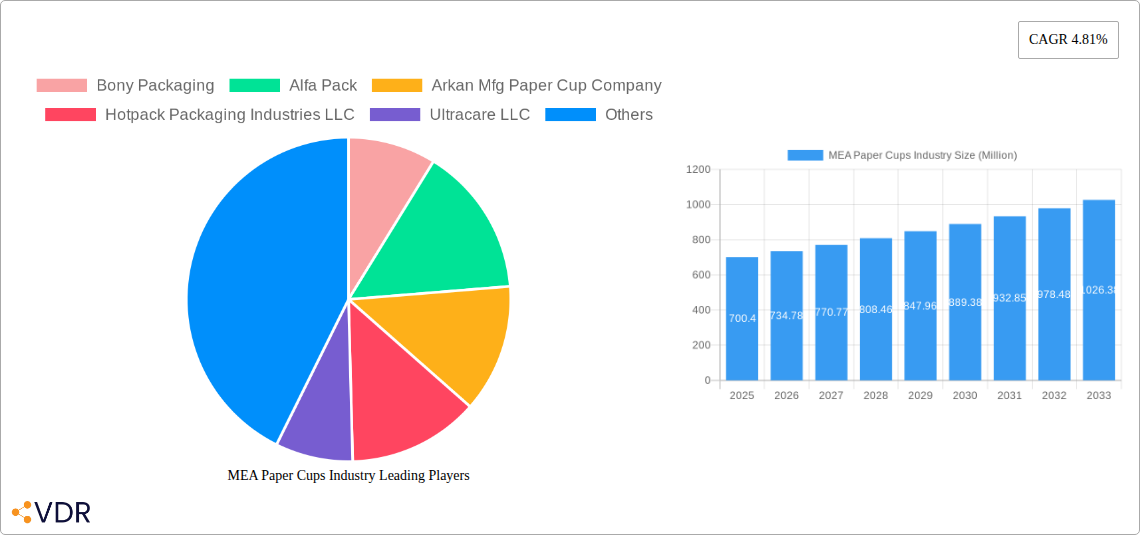
MEA Paper Cups Industry Market Size (In Million)
The MEA paper cups market is characterized by a diverse range of applications, with Quick Service Restaurants (QSRs) emerging as the dominant segment, followed by institutional use and other applications like events and office pantries. Within the paper cup types, both hot and cold paper cups are experiencing steady demand, catering to the varied beverage preferences across the region, from hot tea and coffee to chilled juices and sodas. While the market is experiencing healthy growth, certain factors could influence its trajectory. For instance, the fluctuating raw material costs, particularly for paper pulp, and the logistical challenges associated with distribution across the vast and diverse MEA region could pose restraints. However, the increasing investments by prominent players such as Huhtamaki Group, Detpak South Africa, and Alfa Pack in expanding their production capacities and distribution networks are indicative of strong market confidence. Technological advancements in paper cup manufacturing, focusing on improved barrier properties and eco-friendly coatings, will further bolster market competitiveness and consumer acceptance in the coming years. The market's dynamism is also shaped by the adoption of innovative designs and branding by manufacturers to appeal to a wider consumer base.
MEA Paper Cups Industry Company Market Share
This comprehensive market research report delves deep into the Middle East & Africa (MEA) Paper Cups Industry, providing an in-depth analysis of market dynamics, growth trends, key players, and future outlook. Covering the period from 2019 to 2033, with a base year of 2025, this report is an indispensable resource for stakeholders seeking to understand the evolving landscape of disposable paper cup solutions in the region. With a focus on high-traffic keywords such as "MEA paper cups," "disposable cups Africa," "paper coffee cups Middle East," and "sustainable packaging MEA," this report ensures maximum search engine visibility and engagement for industry professionals. We also analyze parent and child markets to offer a holistic view of market influence and demand.
MEA Paper Cups Industry Market Dynamics & Structure
The MEA Paper Cups Industry exhibits a moderately concentrated market structure, with a growing emphasis on technological innovation and sustainability. Key drivers include the expanding food service sector, particularly quick-service restaurants (QSRs) and the increasing demand for convenient beverage consumption. Regulatory frameworks are gradually evolving to encourage eco-friendly packaging solutions, impacting the competitive landscape and pushing manufacturers towards greener alternatives. While paper cups offer distinct advantages over plastic, competitive product substitutes, such as reusable cups and biodegradable alternatives, are gaining traction, necessitating continuous product development. End-user demographics reveal a rising middle class with a preference for on-the-go consumption. Mergers and acquisitions (M&A) are becoming more prevalent as larger players seek to consolidate market share and expand their geographical reach.
- Market Concentration: Moderately concentrated, with a few key players holding significant market share, alongside a growing number of smaller regional manufacturers.
- Technological Innovation Drivers: Focus on improving insulation, leak-proof designs, and sustainable materials.
- Regulatory Frameworks: Growing government initiatives promoting waste reduction and recycling of disposable packaging.
- Competitive Product Substitutes: Reusable cups, biodegradable alternatives, and other single-use packaging formats.
- End-User Demographics: Increasing urbanization, a growing young population, and a rise in disposable income driving away-from-home consumption.
- M&A Trends: Strategic acquisitions and partnerships aimed at expanding production capacity and market penetration.
MEA Paper Cups Industry Growth Trends & Insights
The MEA Paper Cups Industry is poised for robust growth, driven by a confluence of economic, social, and technological factors. The market size is projected to expand significantly, fueled by the burgeoning hospitality and food service sectors across the Middle East and Africa. Adoption rates of paper cups are steadily increasing as businesses prioritize convenience and hygiene for their customers. Technological disruptions are playing a crucial role, with advancements in materials science leading to more durable, leak-resistant, and eco-friendlier paper cup options. Consumer behavior shifts, particularly the growing environmental consciousness, are compelling manufacturers to invest in sustainable production processes and recyclable materials. The expanding quick-service restaurant (QSR) segment, coupled with the increasing popularity of coffee shops and beverage outlets, are major contributors to this upward trajectory.
The forecast period (2025–2033) anticipates a Compound Annual Growth Rate (CAGR) of approximately XX%, indicating a substantial expansion of the MEA paper cups market. This growth is underpinned by several key trends:
- Market Size Evolution: From an estimated XX million units in 2025 to a projected XX million units by 2033.
- Adoption Rates: Increasing preference for single-use paper cups in high-traffic areas and events.
- Technological Disruptions: Innovations in barrier coatings, improved printing techniques, and the development of compostable materials.
- Consumer Behavior Shifts: Heightened awareness regarding plastic pollution is driving demand for paper-based alternatives.
- Market Penetration: Expected to rise from XX% in 2025 to XX% by 2033, particularly in developing economies within the MEA region.
- Disposable Income Growth: Rising disposable incomes in various MEA countries are leading to increased spending on convenience foods and beverages.
- Urbanization Trends: Growing urban populations create a larger customer base for on-the-go food and beverage services.
Dominant Regions, Countries, or Segments in MEA Paper Cups Industry
The MEA Paper Cups Industry's growth is significantly influenced by specific regions, countries, and application segments. The Hot Paper Cup segment, driven by the pervasive coffee culture and the robust demand from Quick Service Restaurants (QSRs), stands out as a dominant force. Within the MEA region, countries like the United Arab Emirates (UAE) and Saudi Arabia are leading the charge due to their well-established food service infrastructure, high disposable incomes, and a significant presence of international QSR chains. The UAE, in particular, serves as a regional hub for innovation and consumption of disposable food packaging.
The dominance of the Hot Paper Cup segment is intrinsically linked to the Quick Service Restaurants (QSR) application. As these establishments continue to expand their footprint across the region, the demand for convenient, branded paper cups for hot beverages like coffee, tea, and other drinks remains exceptionally high. The ease of use, hygiene, and portability offered by hot paper cups perfectly align with the QSR business model.
- Dominant Segment: Hot Paper Cup, accounting for an estimated XX% market share in 2025.
- Key Application: Quick Service Restaurants (QSR), projected to consume XX% of paper cups in 2025.
- Leading Countries:
- United Arab Emirates (UAE): Driven by a thriving tourism and hospitality sector, a high density of QSRs, and a strong consumer preference for convenience. Expected market share of XX% in 2025.
- Saudi Arabia: Benefiting from a large population, ongoing economic diversification, and a rapidly growing food service industry. Projected market share of XX% in 2025.
- Driving Factors:
- Economic Policies: Government initiatives promoting investment in the food and beverage sector.
- Infrastructure Development: Expansion of retail spaces and commercial hubs supporting food service outlets.
- Consumer Lifestyles: Increasing demand for on-the-go consumption and a growing coffee culture.
- Brand Marketing: Use of paper cups as a marketing tool by beverage and food companies.
- Growth Potential: While Cold Paper Cups are growing, the established preference and higher volume for hot beverages solidify the current dominance. The "Other Applications" segment, including events and catering, also presents significant growth opportunities, albeit starting from a smaller base.
MEA Paper Cups Industry Product Landscape
The MEA Paper Cups Industry is characterized by a diverse product landscape focused on functionality, branding, and sustainability. Innovations are centered around improved insulation for hot beverages, enhanced leak-proof capabilities for cold drinks, and the increasing use of eco-friendly materials such as sustainably sourced paperboard and compostable coatings. Manufacturers are investing in high-quality printing technologies to offer vibrant and engaging brand customizations, turning paper cups into effective marketing tools. Performance metrics like durability, heat resistance, and liquid retention are key differentiating factors. The industry is actively exploring biodegradable and recyclable options to meet growing environmental concerns.
Key Drivers, Barriers & Challenges in MEA Paper Cups Industry
Key Drivers:
- Rising Disposable Incomes: Increasing purchasing power fuels demand for convenience food and beverages.
- Growing Food Service Sector: Expansion of QSRs, cafes, and restaurants across the MEA region.
- Urbanization: Concentration of populations in urban centers drives on-the-go consumption.
- Environmental Consciousness: Growing consumer preference for sustainable and eco-friendly packaging.
Barriers & Challenges:
- Fluctuating Raw Material Costs: Volatility in paper pulp and chemical prices impacts production costs.
- Supply Chain Disruptions: Geopolitical factors and logistical challenges can affect the availability of raw materials and finished goods.
- Competition from Alternatives: Increasing availability and adoption of reusable cups and other sustainable packaging materials.
- Recycling Infrastructure Limitations: Inadequate collection and processing facilities in some parts of the MEA region hinder effective recycling of paper cups.
- Regulatory Variances: Inconsistent environmental regulations across different MEA countries can create operational complexities.
Emerging Opportunities in MEA Paper Cups Industry
Emerging opportunities within the MEA Paper Cups Industry lie in the development and widespread adoption of fully compostable and biodegradable paper cup solutions. Tapping into the growing market for sustainable packaging in emerging economies within Africa presents a significant untapped market. Furthermore, innovative applications beyond traditional beverage service, such as specialized cups for soups or desserts, offer avenues for product diversification. Evolving consumer preferences for personalized and aesthetically pleasing cup designs also present an opportunity for enhanced customization services.
Growth Accelerators in the MEA Paper Cups Industry Industry
Growth in the MEA Paper Cups Industry is being significantly accelerated by advancements in eco-friendly material science, leading to the development of more sustainable and high-performance paper cups. Strategic partnerships between paper cup manufacturers and beverage brands are crucial for expanding market reach and co-branding initiatives. Furthermore, significant investments in manufacturing capacity and the adoption of advanced production technologies by key players are streamlining operations and increasing output to meet rising demand. The ongoing expansion of the food service infrastructure, coupled with increasing consumer awareness about the environmental impact of plastic, are pivotal accelerators for long-term growth.
Key Players Shaping the MEA Paper Cups Industry Market
- Bony Packaging
- Alfa Pack
- Arkan Mfg Paper Cup Company
- Hotpack Packaging Industries LLC
- Ultracare LLC
- Golden Paper Cups Manufacturing LLC
- Falcon Pack
- Detpak South Africa (Pty) Ltd
- Huhtamaki Group
- Pack- Zone
- MAIMOON Papers Industry LLC
- Saqr Pack
- Enpi Group
- Gulf East Paper & Plastic Group
- Graphic International
- Saham Group
Notable Milestones in MEA Paper Cups Industry Sector
- November 2022: HotpackGlobal, the UAE-based global leader in disposable food packaging products, launched its manufacturing plant in Qatar. This 15th Hotpack-owned and operated factory worldwide reflects the company's global vision to become a global food packaging brand leader by 2030. The Doha-based plant specializes in various paper products, including paper bags and cups.
- September 2022: Huhtamaki and Stora Enso launched a paper cup recycling initiative, The Cup Collective program. This initiative aims to recycle used paper cups on an industrial scale and provide consumers and businesses convenient access to recycling solutions, allowing used cups to be renewed into valuable recycled raw material.
In-Depth MEA Paper Cups Industry Market Outlook
The MEA Paper Cups Industry is on a strong trajectory, with future market potential driven by sustained demand from a growing population and an expanding food service sector. Strategic opportunities abound in developing innovative, biodegradable, and recyclable paper cup solutions tailored to specific regional needs. The industry is expected to witness further consolidation through M&A activities, as companies aim to achieve economies of scale and broaden their product portfolios. Investments in advanced manufacturing technologies and robust supply chain management will be critical for navigating market complexities and capitalizing on the burgeoning demand for convenient and increasingly sustainable disposable packaging solutions across the Middle East and Africa.
MEA Paper Cups Industry Segmentation
-
1. Cup Type
- 1.1. Hot Paper Cup
- 1.2. Cold Paper Cup
-
2. Application
- 2.1. Quick Service Restaurants
- 2.2. Institutional
- 2.3. Other Applications
MEA Paper Cups Industry Segmentation By Geography
-
1. North America
- 1.1. United States
- 1.2. Canada
- 1.3. Mexico
-
2. South America
- 2.1. Brazil
- 2.2. Argentina
- 2.3. Rest of South America
-
3. Europe
- 3.1. United Kingdom
- 3.2. Germany
- 3.3. France
- 3.4. Italy
- 3.5. Spain
- 3.6. Russia
- 3.7. Benelux
- 3.8. Nordics
- 3.9. Rest of Europe
-
4. Middle East & Africa
- 4.1. Turkey
- 4.2. Israel
- 4.3. GCC
- 4.4. North Africa
- 4.5. South Africa
- 4.6. Rest of Middle East & Africa
-
5. Asia Pacific
- 5.1. China
- 5.2. India
- 5.3. Japan
- 5.4. South Korea
- 5.5. ASEAN
- 5.6. Oceania
- 5.7. Rest of Asia Pacific
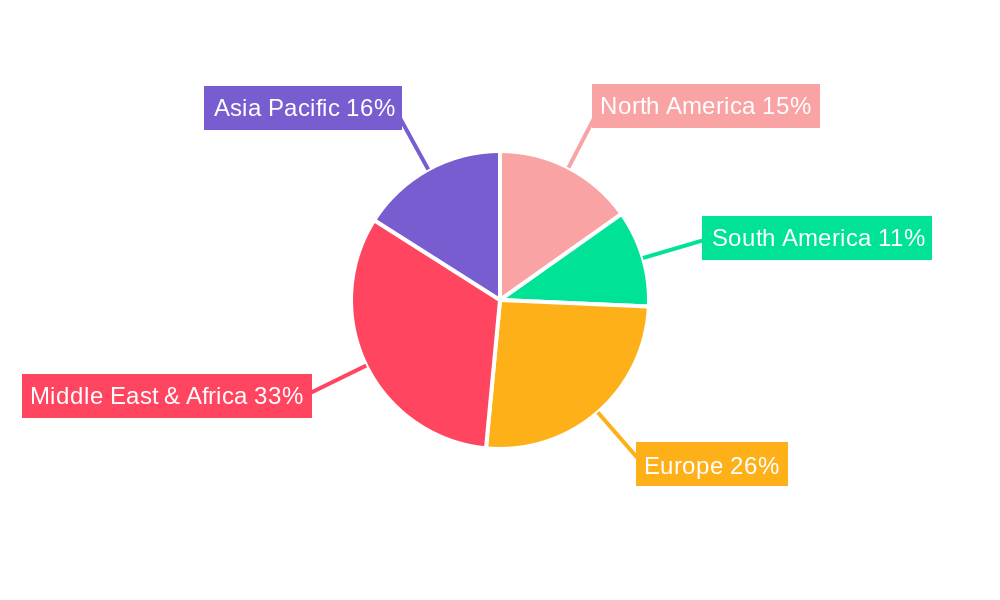
MEA Paper Cups Industry Regional Market Share
Geographic Coverage of MEA Paper Cups Industry
MEA Paper Cups Industry REPORT HIGHLIGHTS
| Aspects | Details |
|---|---|
| Study Period | 2020-2034 |
| Base Year | 2025 |
| Estimated Year | 2026 |
| Forecast Period | 2026-2034 |
| Historical Period | 2020-2025 |
| Growth Rate | CAGR of 4.81% from 2020-2034 |
| Segmentation |
|
Table of Contents
- 1. Introduction
- 1.1. Research Scope
- 1.2. Market Segmentation
- 1.3. Research Objective
- 1.4. Definitions and Assumptions
- 2. Executive Summary
- 2.1. Market Snapshot
- 3. Market Dynamics
- 3.1. Market Drivers
- 3.2. Market Restrains
- 3.3. Market Trends
- 3.4. Market Opportunities
- 4. Market Factor Analysis
- 4.1. Porters Five Forces
- 4.1.1. Bargaining Power of Suppliers
- 4.1.2. Bargaining Power of Buyers
- 4.1.3. Threat of New Entrants
- 4.1.4. Threat of Substitutes
- 4.1.5. Competitive Rivalry
- 4.2. PESTEL analysis
- 4.3. BCG Analysis
- 4.3.1. Stars (High Growth, High Market Share)
- 4.3.2. Cash Cows (Low Growth, High Market Share)
- 4.3.3. Question Mark (High Growth, Low Market Share)
- 4.3.4. Dogs (Low Growth, Low Market Share)
- 4.4. Ansoff Matrix Analysis
- 4.5. Supply Chain Analysis
- 4.6. Regulatory Landscape
- 4.7. Current Market Potential and Opportunity Assessment (TAM–SAM–SOM Framework)
- 4.8. VDR Analyst Note
- 4.1. Porters Five Forces
- 5. Market Analysis, Insights and Forecast 2021-2033
- 5.1. Market Analysis, Insights and Forecast - by Cup Type
- 5.1.1. Hot Paper Cup
- 5.1.2. Cold Paper Cup
- 5.2. Market Analysis, Insights and Forecast - by Application
- 5.2.1. Quick Service Restaurants
- 5.2.2. Institutional
- 5.2.3. Other Applications
- 5.3. Market Analysis, Insights and Forecast - by Region
- 5.3.1. North America
- 5.3.2. South America
- 5.3.3. Europe
- 5.3.4. Middle East & Africa
- 5.3.5. Asia Pacific
- 5.1. Market Analysis, Insights and Forecast - by Cup Type
- 6. Global MEA Paper Cups Industry Analysis, Insights and Forecast, 2021-2033
- 6.1. Market Analysis, Insights and Forecast - by Cup Type
- 6.1.1. Hot Paper Cup
- 6.1.2. Cold Paper Cup
- 6.2. Market Analysis, Insights and Forecast - by Application
- 6.2.1. Quick Service Restaurants
- 6.2.2. Institutional
- 6.2.3. Other Applications
- 6.1. Market Analysis, Insights and Forecast - by Cup Type
- 7. North America MEA Paper Cups Industry Analysis, Insights and Forecast, 2021-2033
- 7.1. Market Analysis, Insights and Forecast - by Cup Type
- 7.1.1. Hot Paper Cup
- 7.1.2. Cold Paper Cup
- 7.2. Market Analysis, Insights and Forecast - by Application
- 7.2.1. Quick Service Restaurants
- 7.2.2. Institutional
- 7.2.3. Other Applications
- 7.1. Market Analysis, Insights and Forecast - by Cup Type
- 8. South America MEA Paper Cups Industry Analysis, Insights and Forecast, 2021-2033
- 8.1. Market Analysis, Insights and Forecast - by Cup Type
- 8.1.1. Hot Paper Cup
- 8.1.2. Cold Paper Cup
- 8.2. Market Analysis, Insights and Forecast - by Application
- 8.2.1. Quick Service Restaurants
- 8.2.2. Institutional
- 8.2.3. Other Applications
- 8.1. Market Analysis, Insights and Forecast - by Cup Type
- 9. Europe MEA Paper Cups Industry Analysis, Insights and Forecast, 2021-2033
- 9.1. Market Analysis, Insights and Forecast - by Cup Type
- 9.1.1. Hot Paper Cup
- 9.1.2. Cold Paper Cup
- 9.2. Market Analysis, Insights and Forecast - by Application
- 9.2.1. Quick Service Restaurants
- 9.2.2. Institutional
- 9.2.3. Other Applications
- 9.1. Market Analysis, Insights and Forecast - by Cup Type
- 10. Middle East & Africa MEA Paper Cups Industry Analysis, Insights and Forecast, 2021-2033
- 10.1. Market Analysis, Insights and Forecast - by Cup Type
- 10.1.1. Hot Paper Cup
- 10.1.2. Cold Paper Cup
- 10.2. Market Analysis, Insights and Forecast - by Application
- 10.2.1. Quick Service Restaurants
- 10.2.2. Institutional
- 10.2.3. Other Applications
- 10.1. Market Analysis, Insights and Forecast - by Cup Type
- 11. Asia Pacific MEA Paper Cups Industry Analysis, Insights and Forecast, 2021-2033
- 11.1. Market Analysis, Insights and Forecast - by Cup Type
- 11.1.1. Hot Paper Cup
- 11.1.2. Cold Paper Cup
- 11.2. Market Analysis, Insights and Forecast - by Application
- 11.2.1. Quick Service Restaurants
- 11.2.2. Institutional
- 11.2.3. Other Applications
- 11.1. Market Analysis, Insights and Forecast - by Cup Type
- 12. Competitive Analysis
- 12.1. Company Profiles
- 12.1.1 Bony Packaging
- 12.1.1.1. Company Overview
- 12.1.1.2. Products
- 12.1.1.3. Company Financials
- 12.1.1.4. SWOT Analysis
- 12.1.2 Alfa Pack
- 12.1.2.1. Company Overview
- 12.1.2.2. Products
- 12.1.2.3. Company Financials
- 12.1.2.4. SWOT Analysis
- 12.1.3 Arkan Mfg Paper Cup Company
- 12.1.3.1. Company Overview
- 12.1.3.2. Products
- 12.1.3.3. Company Financials
- 12.1.3.4. SWOT Analysis
- 12.1.4 Hotpack Packaging Industries LLC
- 12.1.4.1. Company Overview
- 12.1.4.2. Products
- 12.1.4.3. Company Financials
- 12.1.4.4. SWOT Analysis
- 12.1.5 Ultracare LLC
- 12.1.5.1. Company Overview
- 12.1.5.2. Products
- 12.1.5.3. Company Financials
- 12.1.5.4. SWOT Analysis
- 12.1.6 Golden Paper Cups Manufacturing LLC
- 12.1.6.1. Company Overview
- 12.1.6.2. Products
- 12.1.6.3. Company Financials
- 12.1.6.4. SWOT Analysis
- 12.1.7 Falcon Pack*List Not Exhaustive
- 12.1.7.1. Company Overview
- 12.1.7.2. Products
- 12.1.7.3. Company Financials
- 12.1.7.4. SWOT Analysis
- 12.1.8 Detpak South Africa (Pty) Ltd
- 12.1.8.1. Company Overview
- 12.1.8.2. Products
- 12.1.8.3. Company Financials
- 12.1.8.4. SWOT Analysis
- 12.1.9 Huhtamaki Group
- 12.1.9.1. Company Overview
- 12.1.9.2. Products
- 12.1.9.3. Company Financials
- 12.1.9.4. SWOT Analysis
- 12.1.10 Pack- Zone
- 12.1.10.1. Company Overview
- 12.1.10.2. Products
- 12.1.10.3. Company Financials
- 12.1.10.4. SWOT Analysis
- 12.1.11 MAIMOON Papers Industry LLC
- 12.1.11.1. Company Overview
- 12.1.11.2. Products
- 12.1.11.3. Company Financials
- 12.1.11.4. SWOT Analysis
- 12.1.12 Saqr Pack
- 12.1.12.1. Company Overview
- 12.1.12.2. Products
- 12.1.12.3. Company Financials
- 12.1.12.4. SWOT Analysis
- 12.1.13 Enpi Group
- 12.1.13.1. Company Overview
- 12.1.13.2. Products
- 12.1.13.3. Company Financials
- 12.1.13.4. SWOT Analysis
- 12.1.14 Gulf East Paper & Plastic Group
- 12.1.14.1. Company Overview
- 12.1.14.2. Products
- 12.1.14.3. Company Financials
- 12.1.14.4. SWOT Analysis
- 12.1.15 Graphic Packaging International
- 12.1.15.1. Company Overview
- 12.1.15.2. Products
- 12.1.15.3. Company Financials
- 12.1.15.4. SWOT Analysis
- 12.1.16 Saham Group
- 12.1.16.1. Company Overview
- 12.1.16.2. Products
- 12.1.16.3. Company Financials
- 12.1.16.4. SWOT Analysis
- 12.1.1 Bony Packaging
- 12.2. Market Entropy
- 12.2.1 Company's Key Areas Served
- 12.2.2 Recent Developments
- 12.3. Company Market Share Analysis 2025
- 12.3.1 Top 5 Companies Market Share Analysis
- 12.3.2 Top 3 Companies Market Share Analysis
- 12.4. List of Potential Customers
- 13. Research Methodology
List of Figures
- Figure 1: Global MEA Paper Cups Industry Revenue Breakdown (Million, %) by Region 2025 & 2033
- Figure 2: North America MEA Paper Cups Industry Revenue (Million), by Cup Type 2025 & 2033
- Figure 3: North America MEA Paper Cups Industry Revenue Share (%), by Cup Type 2025 & 2033
- Figure 4: North America MEA Paper Cups Industry Revenue (Million), by Application 2025 & 2033
- Figure 5: North America MEA Paper Cups Industry Revenue Share (%), by Application 2025 & 2033
- Figure 6: North America MEA Paper Cups Industry Revenue (Million), by Country 2025 & 2033
- Figure 7: North America MEA Paper Cups Industry Revenue Share (%), by Country 2025 & 2033
- Figure 8: South America MEA Paper Cups Industry Revenue (Million), by Cup Type 2025 & 2033
- Figure 9: South America MEA Paper Cups Industry Revenue Share (%), by Cup Type 2025 & 2033
- Figure 10: South America MEA Paper Cups Industry Revenue (Million), by Application 2025 & 2033
- Figure 11: South America MEA Paper Cups Industry Revenue Share (%), by Application 2025 & 2033
- Figure 12: South America MEA Paper Cups Industry Revenue (Million), by Country 2025 & 2033
- Figure 13: South America MEA Paper Cups Industry Revenue Share (%), by Country 2025 & 2033
- Figure 14: Europe MEA Paper Cups Industry Revenue (Million), by Cup Type 2025 & 2033
- Figure 15: Europe MEA Paper Cups Industry Revenue Share (%), by Cup Type 2025 & 2033
- Figure 16: Europe MEA Paper Cups Industry Revenue (Million), by Application 2025 & 2033
- Figure 17: Europe MEA Paper Cups Industry Revenue Share (%), by Application 2025 & 2033
- Figure 18: Europe MEA Paper Cups Industry Revenue (Million), by Country 2025 & 2033
- Figure 19: Europe MEA Paper Cups Industry Revenue Share (%), by Country 2025 & 2033
- Figure 20: Middle East & Africa MEA Paper Cups Industry Revenue (Million), by Cup Type 2025 & 2033
- Figure 21: Middle East & Africa MEA Paper Cups Industry Revenue Share (%), by Cup Type 2025 & 2033
- Figure 22: Middle East & Africa MEA Paper Cups Industry Revenue (Million), by Application 2025 & 2033
- Figure 23: Middle East & Africa MEA Paper Cups Industry Revenue Share (%), by Application 2025 & 2033
- Figure 24: Middle East & Africa MEA Paper Cups Industry Revenue (Million), by Country 2025 & 2033
- Figure 25: Middle East & Africa MEA Paper Cups Industry Revenue Share (%), by Country 2025 & 2033
- Figure 26: Asia Pacific MEA Paper Cups Industry Revenue (Million), by Cup Type 2025 & 2033
- Figure 27: Asia Pacific MEA Paper Cups Industry Revenue Share (%), by Cup Type 2025 & 2033
- Figure 28: Asia Pacific MEA Paper Cups Industry Revenue (Million), by Application 2025 & 2033
- Figure 29: Asia Pacific MEA Paper Cups Industry Revenue Share (%), by Application 2025 & 2033
- Figure 30: Asia Pacific MEA Paper Cups Industry Revenue (Million), by Country 2025 & 2033
- Figure 31: Asia Pacific MEA Paper Cups Industry Revenue Share (%), by Country 2025 & 2033
List of Tables
- Table 1: Global MEA Paper Cups Industry Revenue Million Forecast, by Cup Type 2020 & 2033
- Table 2: Global MEA Paper Cups Industry Revenue Million Forecast, by Application 2020 & 2033
- Table 3: Global MEA Paper Cups Industry Revenue Million Forecast, by Region 2020 & 2033
- Table 4: Global MEA Paper Cups Industry Revenue Million Forecast, by Cup Type 2020 & 2033
- Table 5: Global MEA Paper Cups Industry Revenue Million Forecast, by Application 2020 & 2033
- Table 6: Global MEA Paper Cups Industry Revenue Million Forecast, by Country 2020 & 2033
- Table 7: United States MEA Paper Cups Industry Revenue (Million) Forecast, by Application 2020 & 2033
- Table 8: Canada MEA Paper Cups Industry Revenue (Million) Forecast, by Application 2020 & 2033
- Table 9: Mexico MEA Paper Cups Industry Revenue (Million) Forecast, by Application 2020 & 2033
- Table 10: Global MEA Paper Cups Industry Revenue Million Forecast, by Cup Type 2020 & 2033
- Table 11: Global MEA Paper Cups Industry Revenue Million Forecast, by Application 2020 & 2033
- Table 12: Global MEA Paper Cups Industry Revenue Million Forecast, by Country 2020 & 2033
- Table 13: Brazil MEA Paper Cups Industry Revenue (Million) Forecast, by Application 2020 & 2033
- Table 14: Argentina MEA Paper Cups Industry Revenue (Million) Forecast, by Application 2020 & 2033
- Table 15: Rest of South America MEA Paper Cups Industry Revenue (Million) Forecast, by Application 2020 & 2033
- Table 16: Global MEA Paper Cups Industry Revenue Million Forecast, by Cup Type 2020 & 2033
- Table 17: Global MEA Paper Cups Industry Revenue Million Forecast, by Application 2020 & 2033
- Table 18: Global MEA Paper Cups Industry Revenue Million Forecast, by Country 2020 & 2033
- Table 19: United Kingdom MEA Paper Cups Industry Revenue (Million) Forecast, by Application 2020 & 2033
- Table 20: Germany MEA Paper Cups Industry Revenue (Million) Forecast, by Application 2020 & 2033
- Table 21: France MEA Paper Cups Industry Revenue (Million) Forecast, by Application 2020 & 2033
- Table 22: Italy MEA Paper Cups Industry Revenue (Million) Forecast, by Application 2020 & 2033
- Table 23: Spain MEA Paper Cups Industry Revenue (Million) Forecast, by Application 2020 & 2033
- Table 24: Russia MEA Paper Cups Industry Revenue (Million) Forecast, by Application 2020 & 2033
- Table 25: Benelux MEA Paper Cups Industry Revenue (Million) Forecast, by Application 2020 & 2033
- Table 26: Nordics MEA Paper Cups Industry Revenue (Million) Forecast, by Application 2020 & 2033
- Table 27: Rest of Europe MEA Paper Cups Industry Revenue (Million) Forecast, by Application 2020 & 2033
- Table 28: Global MEA Paper Cups Industry Revenue Million Forecast, by Cup Type 2020 & 2033
- Table 29: Global MEA Paper Cups Industry Revenue Million Forecast, by Application 2020 & 2033
- Table 30: Global MEA Paper Cups Industry Revenue Million Forecast, by Country 2020 & 2033
- Table 31: Turkey MEA Paper Cups Industry Revenue (Million) Forecast, by Application 2020 & 2033
- Table 32: Israel MEA Paper Cups Industry Revenue (Million) Forecast, by Application 2020 & 2033
- Table 33: GCC MEA Paper Cups Industry Revenue (Million) Forecast, by Application 2020 & 2033
- Table 34: North Africa MEA Paper Cups Industry Revenue (Million) Forecast, by Application 2020 & 2033
- Table 35: South Africa MEA Paper Cups Industry Revenue (Million) Forecast, by Application 2020 & 2033
- Table 36: Rest of Middle East & Africa MEA Paper Cups Industry Revenue (Million) Forecast, by Application 2020 & 2033
- Table 37: Global MEA Paper Cups Industry Revenue Million Forecast, by Cup Type 2020 & 2033
- Table 38: Global MEA Paper Cups Industry Revenue Million Forecast, by Application 2020 & 2033
- Table 39: Global MEA Paper Cups Industry Revenue Million Forecast, by Country 2020 & 2033
- Table 40: China MEA Paper Cups Industry Revenue (Million) Forecast, by Application 2020 & 2033
- Table 41: India MEA Paper Cups Industry Revenue (Million) Forecast, by Application 2020 & 2033
- Table 42: Japan MEA Paper Cups Industry Revenue (Million) Forecast, by Application 2020 & 2033
- Table 43: South Korea MEA Paper Cups Industry Revenue (Million) Forecast, by Application 2020 & 2033
- Table 44: ASEAN MEA Paper Cups Industry Revenue (Million) Forecast, by Application 2020 & 2033
- Table 45: Oceania MEA Paper Cups Industry Revenue (Million) Forecast, by Application 2020 & 2033
- Table 46: Rest of Asia Pacific MEA Paper Cups Industry Revenue (Million) Forecast, by Application 2020 & 2033
Frequently Asked Questions
1. What is the projected Compound Annual Growth Rate (CAGR) of the MEA Paper Cups Industry?
The projected CAGR is approximately 4.81%.
2. Which companies are prominent players in the MEA Paper Cups Industry?
Key companies in the market include Bony Packaging, Alfa Pack, Arkan Mfg Paper Cup Company, Hotpack Packaging Industries LLC, Ultracare LLC, Golden Paper Cups Manufacturing LLC, Falcon Pack*List Not Exhaustive, Detpak South Africa (Pty) Ltd, Huhtamaki Group, Pack- Zone, MAIMOON Papers Industry LLC, Saqr Pack, Enpi Group, Gulf East Paper & Plastic Group, Graphic Packaging International, Saham Group.
3. What are the main segments of the MEA Paper Cups Industry?
The market segments include Cup Type, Application.
4. Can you provide details about the market size?
The market size is estimated to be USD 700.40 Million as of 2022.
5. What are some drivers contributing to market growth?
Rising Demand For on-the-go Consumption of Beverages; Sustainability Measures Coupled with Recent Innovations have Played a Role in Shelf Life of Products.
6. What are the notable trends driving market growth?
Quick Service Restaurants to Witness the Growth.
7. Are there any restraints impacting market growth?
Ongoing Market Fragmentation and the Dependence on Materials Expected to Affect Margins.
8. Can you provide examples of recent developments in the market?
November 2022: HotpackGlobal, the UAE-based global leader in disposable food packaging products, launched its manufacturing plant in Qatar. The plant is the 15th Hotpack-owned and operated factory worldwide, reflecting the company's global vision to become a global food packaging brand leader by 2030. The manufacturing plant is located in Doha's new industrial area, specializing in various Hotpackpaper products ranging from folding and corrugated cartons to paper bags and cups.
9. What pricing options are available for accessing the report?
Pricing options include single-user, multi-user, and enterprise licenses priced at USD 4750, USD 5250, and USD 8750 respectively.
10. Is the market size provided in terms of value or volume?
The market size is provided in terms of value, measured in Million.
11. Are there any specific market keywords associated with the report?
Yes, the market keyword associated with the report is "MEA Paper Cups Industry," which aids in identifying and referencing the specific market segment covered.
12. How do I determine which pricing option suits my needs best?
The pricing options vary based on user requirements and access needs. Individual users may opt for single-user licenses, while businesses requiring broader access may choose multi-user or enterprise licenses for cost-effective access to the report.
13. Are there any additional resources or data provided in the MEA Paper Cups Industry report?
While the report offers comprehensive insights, it's advisable to review the specific contents or supplementary materials provided to ascertain if additional resources or data are available.
14. How can I stay updated on further developments or reports in the MEA Paper Cups Industry?
To stay informed about further developments, trends, and reports in the MEA Paper Cups Industry, consider subscribing to industry newsletters, following relevant companies and organizations, or regularly checking reputable industry news sources and publications.
Methodology
Step 1 - Identification of Relevant Samples Size from Population Database


Step 2 - Approaches for Defining Global Market Size (Value, Volume* & Price*)

Note*: In applicable scenarios
Step 3 - Data Sources
Primary Research
- Web Analytics
- Survey Reports
- Research Institute
- Latest Research Reports
- Opinion Leaders
Secondary Research
- Annual Reports
- White Paper
- Latest Press Release
- Industry Association
- Paid Database
- Investor Presentations

Step 4 - Data Triangulation
Involves using different sources of information in order to increase the validity of a study
These sources are likely to be stakeholders in a program - participants, other researchers, program staff, other community members, and so on.
Then we put all data in single framework & apply various statistical tools to find out the dynamic on the market.
During the analysis stage, feedback from the stakeholder groups would be compared to determine areas of agreement as well as areas of divergence