

Key Insights
The global beverage caps and closures market is projected to reach $13.3 billion by 2025, with a Compound Annual Growth Rate (CAGR) of 4.6% from 2025 to 2033. This expansion is propelled by the increasing demand for convenient, tamper-evident packaging across diverse beverage sectors, including soft drinks, juices, bottled water, and alcoholic beverages. The growing adoption of sustainable materials like recycled plastics and bio-based polymers is a key trend. Enhanced product safety and brand protection also drive innovation in closure design. The market is segmented by material, with plastic currently leading due to its cost-effectiveness and versatility, followed by metal and other materials. Growing environmental awareness is pushing manufacturers towards eco-friendly closure solutions. Geographic expansion, particularly in emerging economies of Asia-Pacific and Latin America, is a significant growth driver, complementing contributions from mature markets in North America and Europe. Key players are pursuing product innovation, mergers, and acquisitions to maintain market share.
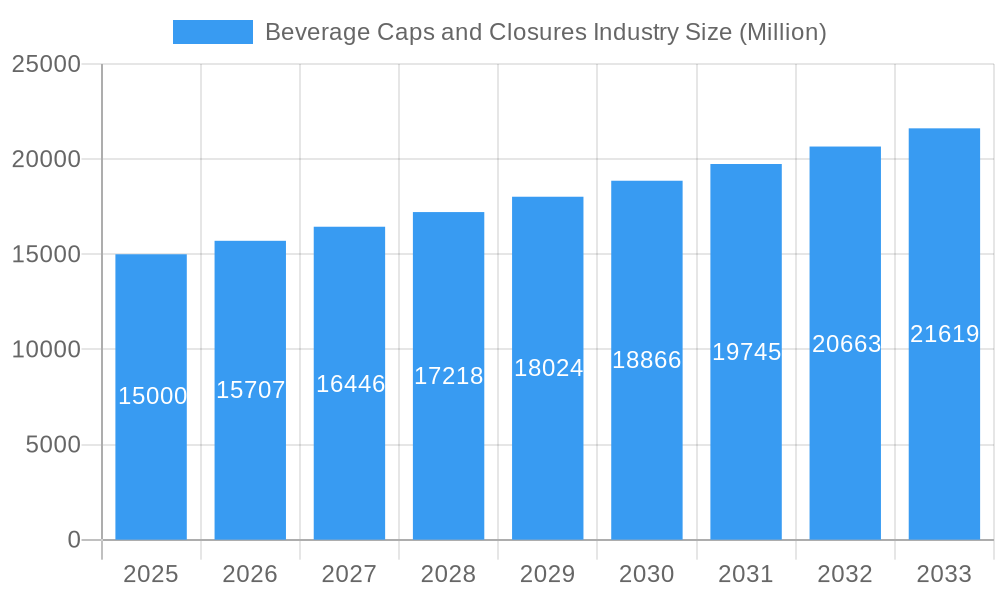
Beverage Caps and Closures Industry Market Size (In Billion)
Market growth faces challenges including fluctuating raw material prices and stringent regulatory requirements for food safety and environmental compliance. Evolving consumer preferences and alternative packaging technologies also present potential disruptions. To address these, industry leaders are prioritizing innovative material development, manufacturing efficiency, and product portfolio diversification. The long-term outlook remains robust, supported by sustained beverage industry growth and the demand for advanced packaging solutions offering convenience, safety, and sustainability.
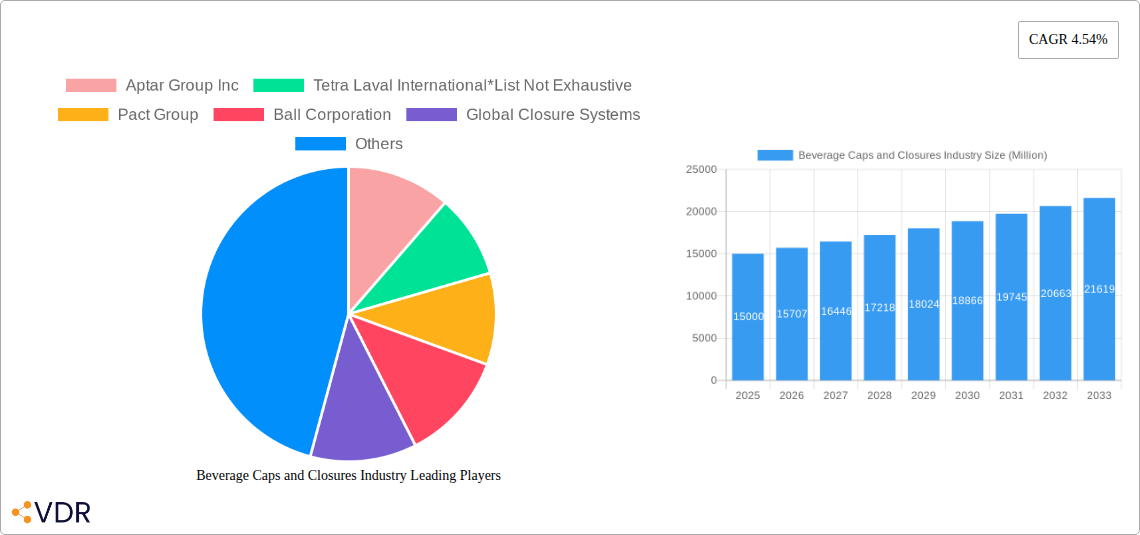
Beverage Caps and Closures Industry Company Market Share
Beverage Caps and Closures Industry Market Report: 2019-2033
This comprehensive report provides a detailed analysis of the global beverage caps and closures market, encompassing market dynamics, growth trends, regional performance, product landscape, and key players. The report covers the period from 2019 to 2033, with a focus on the forecast period of 2025-2033 and a base year of 2025. The market is segmented by material type: Metal, Plastic, and Other Materials (Rubber, Cork). The analysis includes both parent (Packaging Industry) and child market (Beverage Caps & Closures) perspectives for a holistic understanding. Market values are presented in Million units.
Beverage Caps and Closures Industry Market Dynamics & Structure
The beverage caps and closures market is characterized by moderate concentration, with several major players holding significant market share. Technological innovation, particularly in sustainable materials and closure designs, is a key driver. Stringent regulatory frameworks concerning material safety and recyclability influence product development and manufacturing processes. Competition from alternative closure types and the increasing adoption of reusable containers pose challenges. End-user demographics, including shifting consumer preferences towards convenience and sustainability, significantly influence market demand. M&A activity within the sector is relatively frequent, with larger companies acquiring smaller players to expand their product portfolios and geographical reach.
- Market Concentration: Moderately concentrated, with top 10 players holding approximately xx% of the market share in 2025.
- Technological Innovation: Focus on lightweighting, improved sealing performance, and sustainable materials (e.g., bioplastics, recycled content).
- Regulatory Frameworks: Increasing regulations on recyclability and material safety (e.g., BPA-free plastics) impacting material choices.
- Competitive Substitutes: Reusable containers, alternative closure mechanisms (e.g., screw caps vs. crown corks) pose competitive pressure.
- M&A Trends: A steady rate of mergers and acquisitions, with xx deals recorded between 2019 and 2024.
Beverage Caps and Closures Industry Growth Trends & Insights
The global beverage caps and closures market exhibited a Compound Annual Growth Rate (CAGR) of xx% during the historical period (2019-2024) and is projected to grow at a CAGR of xx% during the forecast period (2025-2033). Market size is expected to reach xx million units by 2033, driven by increasing beverage consumption globally, particularly in developing economies. The adoption rate of innovative closures, such as tamper-evident and resealable designs, is steadily increasing. Technological disruptions, such as the introduction of smart closures with integrated sensors, are creating new growth opportunities. Consumer behavior shifts towards sustainability are driving demand for eco-friendly materials and recyclable closures.
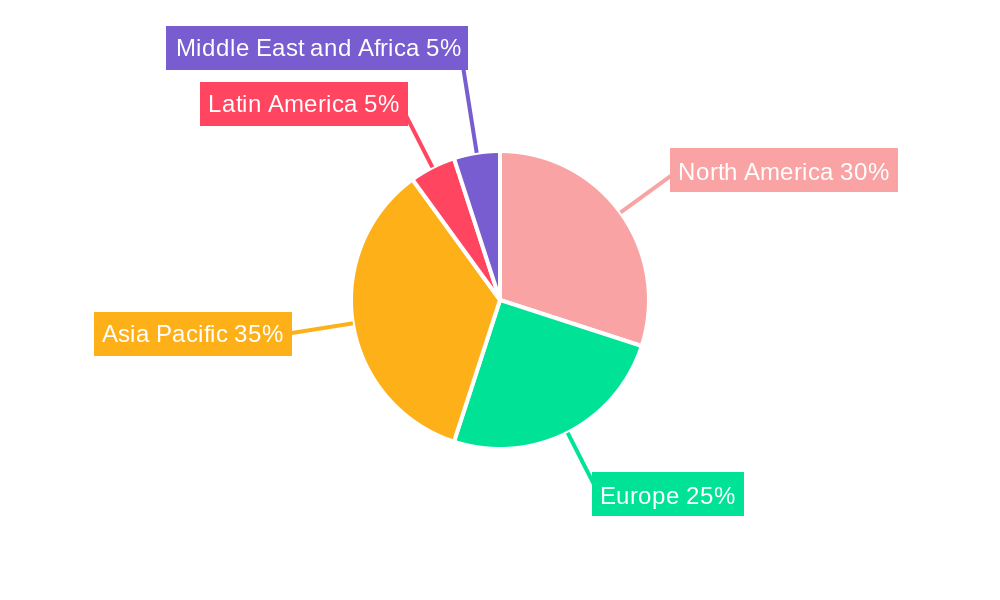
Dominant Regions, Countries, or Segments in Beverage Caps and Closures Industry
The Asia-Pacific region is the dominant market for beverage caps and closures, driven by rapid economic growth, rising disposable incomes, and increasing beverage consumption. Within this region, China and India are key markets. The plastic segment holds the largest market share due to its cost-effectiveness and versatility. However, the metal segment is experiencing growth driven by premiumization trends and increased demand for aesthetically appealing closures.
- Key Drivers in Asia-Pacific:
- Rapid economic growth and rising disposable incomes.
- Increasing beverage consumption (carbonated soft drinks, bottled water, juices).
- Expanding manufacturing base and infrastructure development.
- Plastic Segment Dominance:
- Cost-effectiveness and ease of manufacturing.
- Versatility in design and functionality.
- Wide range of applications across various beverage types.
- Metal Segment Growth:
- Premiumization trends in the beverage industry.
- Demand for aesthetically pleasing and high-quality closures.
- Perceived superior barrier properties and recyclability.
Beverage Caps and Closures Industry Product Landscape
The beverage caps and closures market offers a diverse range of products, including screw caps, crown corks, flip-top closures, and tamper-evident seals. Continuous innovation focuses on enhancing sealing performance, improving recyclability, and incorporating features like easy opening and reclosability. Unique selling propositions include sustainable materials, improved barrier properties, and integrated sensors for tracking and authentication. Technological advancements include the incorporation of bio-based polymers, lightweight designs, and smart closures with interactive capabilities.
Key Drivers, Barriers & Challenges in Beverage Caps and Closures Industry
Key Drivers:
- Growing demand for convenient packaging.
- Increased beverage consumption globally.
- Stringent food safety regulations driving demand for advanced closure technologies.
Key Challenges:
- Fluctuations in raw material prices (e.g., plastic resins, metals).
- Increasing competition from alternative packaging solutions.
- Environmental concerns and stricter regulations on plastic waste. Supply chain disruptions caused by geopolitical instability could significantly impact material availability and pricing, potentially resulting in a xx% increase in production costs in 2026.
Emerging Opportunities in Beverage Caps and Closures Industry
- Growth in the functional beverage sector.
- Rising demand for sustainable and eco-friendly packaging solutions.
- Increasing adoption of smart closures with integrated sensors and track-and-trace capabilities.
- Expansion into emerging markets with high growth potential.
Growth Accelerators in the Beverage Caps and Closures Industry Industry
Technological breakthroughs in materials science, such as the development of bio-based and recycled polymers, are key catalysts for growth. Strategic partnerships between closure manufacturers and beverage companies are facilitating the development of innovative packaging solutions. Expansion into new markets, particularly in developing economies, is expected to drive substantial growth.
Key Players Shaping the Beverage Caps and Closures Industry Market
- Aptar Group Inc
- Tetra Laval International
- Pact Group
- Ball Corporation
- Global Closure Systems
- Bericap GmbH & Co KG
- Guala Closures Group
- Crown Holdings Inc
- Albea Group
- Evergreen Packaging Inc
- Berry Global Inc
- Silgan Holdings Inc
- Amcor Ltd
Notable Milestones in Beverage Caps and Closures Industry Sector
- 2021: Berry Global launches a new line of recyclable plastic closures.
- 2022: Amcor partners with a bioplastics supplier to develop sustainable closure solutions.
- 2023: Crown Holdings acquires a smaller closure manufacturer, expanding its market share. (Further milestones require specific data).
In-Depth Beverage Caps and Closures Industry Market Outlook
The beverage caps and closures market is poised for significant growth in the coming years, driven by several factors including increasing beverage consumption, technological innovation, and a focus on sustainability. Strategic opportunities lie in developing innovative, eco-friendly closures and expanding into emerging markets. Companies that can effectively adapt to evolving consumer preferences and regulatory changes will be well-positioned for success in this dynamic market.
Beverage Caps and Closures Industry Segmentation
-
1. Material
- 1.1. Metal
- 1.2. Plastic
- 1.3. Other Materials (Rubber, Cork)
Beverage Caps and Closures Industry Segmentation By Geography
-
1. North America
- 1.1. US
- 1.2. Canada
-
2. Europe
- 2.1. Germany
- 2.2. UK
- 2.3. France
- 2.4. Rest of Europe
-
3. Asia Pacific
- 3.1. China
- 3.2. Japan
- 3.3. India
- 3.4. Rest of Asia Pacific
-
4. Latin America
- 4.1. Brazil
- 4.2. Mexico
- 4.3. Rest of Latin America
-
5. Middle East and Africa
- 5.1. UAE
- 5.2. Saudi Arabia
- 5.3. South Africa
- 5.4. Rest of Middle East
Beverage Caps and Closures Industry Regional Market Share
Geographic Coverage of Beverage Caps and Closures Industry
Beverage Caps and Closures Industry REPORT HIGHLIGHTS
| Aspects | Details |
|---|---|
| Study Period | 2020-2034 |
| Base Year | 2025 |
| Estimated Year | 2026 |
| Forecast Period | 2026-2034 |
| Historical Period | 2020-2025 |
| Growth Rate | CAGR of 4.6% from 2020-2034 |
| Segmentation |
|
Table of Contents
- 1. Introduction
- 1.1. Research Scope
- 1.2. Market Segmentation
- 1.3. Research Objective
- 1.4. Definitions and Assumptions
- 2. Executive Summary
- 2.1. Market Snapshot
- 3. Market Dynamics
- 3.1. Market Drivers
- 3.2. Market Restrains
- 3.3. Market Trends
- 3.4. Market Opportunities
- 4. Market Factor Analysis
- 4.1. Porters Five Forces
- 4.1.1. Bargaining Power of Suppliers
- 4.1.2. Bargaining Power of Buyers
- 4.1.3. Threat of New Entrants
- 4.1.4. Threat of Substitutes
- 4.1.5. Competitive Rivalry
- 4.2. PESTEL analysis
- 4.3. BCG Analysis
- 4.3.1. Stars (High Growth, High Market Share)
- 4.3.2. Cash Cows (Low Growth, High Market Share)
- 4.3.3. Question Mark (High Growth, Low Market Share)
- 4.3.4. Dogs (Low Growth, Low Market Share)
- 4.4. Ansoff Matrix Analysis
- 4.5. Supply Chain Analysis
- 4.6. Regulatory Landscape
- 4.7. Current Market Potential and Opportunity Assessment (TAM–SAM–SOM Framework)
- 4.8. VDR Analyst Note
- 4.1. Porters Five Forces
- 5. Market Analysis, Insights and Forecast 2021-2033
- 5.1. Market Analysis, Insights and Forecast - by Material
- 5.1.1. Metal
- 5.1.2. Plastic
- 5.1.3. Other Materials (Rubber, Cork)
- 5.2. Market Analysis, Insights and Forecast - by Region
- 5.2.1. North America
- 5.2.2. Europe
- 5.2.3. Asia Pacific
- 5.2.4. Latin America
- 5.2.5. Middle East and Africa
- 5.1. Market Analysis, Insights and Forecast - by Material
- 6. Global Beverage Caps and Closures Industry Analysis, Insights and Forecast, 2021-2033
- 6.1. Market Analysis, Insights and Forecast - by Material
- 6.1.1. Metal
- 6.1.2. Plastic
- 6.1.3. Other Materials (Rubber, Cork)
- 6.1. Market Analysis, Insights and Forecast - by Material
- 7. North America Beverage Caps and Closures Industry Analysis, Insights and Forecast, 2021-2033
- 7.1. Market Analysis, Insights and Forecast - by Material
- 7.1.1. Metal
- 7.1.2. Plastic
- 7.1.3. Other Materials (Rubber, Cork)
- 7.1. Market Analysis, Insights and Forecast - by Material
- 8. Europe Beverage Caps and Closures Industry Analysis, Insights and Forecast, 2021-2033
- 8.1. Market Analysis, Insights and Forecast - by Material
- 8.1.1. Metal
- 8.1.2. Plastic
- 8.1.3. Other Materials (Rubber, Cork)
- 8.1. Market Analysis, Insights and Forecast - by Material
- 9. Asia Pacific Beverage Caps and Closures Industry Analysis, Insights and Forecast, 2021-2033
- 9.1. Market Analysis, Insights and Forecast - by Material
- 9.1.1. Metal
- 9.1.2. Plastic
- 9.1.3. Other Materials (Rubber, Cork)
- 9.1. Market Analysis, Insights and Forecast - by Material
- 10. Latin America Beverage Caps and Closures Industry Analysis, Insights and Forecast, 2021-2033
- 10.1. Market Analysis, Insights and Forecast - by Material
- 10.1.1. Metal
- 10.1.2. Plastic
- 10.1.3. Other Materials (Rubber, Cork)
- 10.1. Market Analysis, Insights and Forecast - by Material
- 11. Middle East and Africa Beverage Caps and Closures Industry Analysis, Insights and Forecast, 2021-2033
- 11.1. Market Analysis, Insights and Forecast - by Material
- 11.1.1. Metal
- 11.1.2. Plastic
- 11.1.3. Other Materials (Rubber, Cork)
- 11.1. Market Analysis, Insights and Forecast - by Material
- 12. Competitive Analysis
- 12.1. Company Profiles
- 12.1.1 Aptar Group Inc
- 12.1.1.1. Company Overview
- 12.1.1.2. Products
- 12.1.1.3. Company Financials
- 12.1.1.4. SWOT Analysis
- 12.1.2 Tetra Laval International*List Not Exhaustive
- 12.1.2.1. Company Overview
- 12.1.2.2. Products
- 12.1.2.3. Company Financials
- 12.1.2.4. SWOT Analysis
- 12.1.3 Pact Group
- 12.1.3.1. Company Overview
- 12.1.3.2. Products
- 12.1.3.3. Company Financials
- 12.1.3.4. SWOT Analysis
- 12.1.4 Ball Corporation
- 12.1.4.1. Company Overview
- 12.1.4.2. Products
- 12.1.4.3. Company Financials
- 12.1.4.4. SWOT Analysis
- 12.1.5 Global Closure Systems
- 12.1.5.1. Company Overview
- 12.1.5.2. Products
- 12.1.5.3. Company Financials
- 12.1.5.4. SWOT Analysis
- 12.1.6 Bericap GmbH & Co KG
- 12.1.6.1. Company Overview
- 12.1.6.2. Products
- 12.1.6.3. Company Financials
- 12.1.6.4. SWOT Analysis
- 12.1.7 Guala Closures Group
- 12.1.7.1. Company Overview
- 12.1.7.2. Products
- 12.1.7.3. Company Financials
- 12.1.7.4. SWOT Analysis
- 12.1.8 Crown Holdings Inc
- 12.1.8.1. Company Overview
- 12.1.8.2. Products
- 12.1.8.3. Company Financials
- 12.1.8.4. SWOT Analysis
- 12.1.9 Albea Group
- 12.1.9.1. Company Overview
- 12.1.9.2. Products
- 12.1.9.3. Company Financials
- 12.1.9.4. SWOT Analysis
- 12.1.10 Evergreen Packaging Inc
- 12.1.10.1. Company Overview
- 12.1.10.2. Products
- 12.1.10.3. Company Financials
- 12.1.10.4. SWOT Analysis
- 12.1.11 Berry Global Inc
- 12.1.11.1. Company Overview
- 12.1.11.2. Products
- 12.1.11.3. Company Financials
- 12.1.11.4. SWOT Analysis
- 12.1.12 Silgan Holdings Inc
- 12.1.12.1. Company Overview
- 12.1.12.2. Products
- 12.1.12.3. Company Financials
- 12.1.12.4. SWOT Analysis
- 12.1.13 Amcor Ltd
- 12.1.13.1. Company Overview
- 12.1.13.2. Products
- 12.1.13.3. Company Financials
- 12.1.13.4. SWOT Analysis
- 12.1.1 Aptar Group Inc
- 12.2. Market Entropy
- 12.2.1 Company's Key Areas Served
- 12.2.2 Recent Developments
- 12.3. Company Market Share Analysis 2025
- 12.3.1 Top 5 Companies Market Share Analysis
- 12.3.2 Top 3 Companies Market Share Analysis
- 12.4. List of Potential Customers
- 13. Research Methodology
List of Figures
- Figure 1: Global Beverage Caps and Closures Industry Revenue Breakdown (billion, %) by Region 2025 & 2033
- Figure 2: North America Beverage Caps and Closures Industry Revenue (billion), by Material 2025 & 2033
- Figure 3: North America Beverage Caps and Closures Industry Revenue Share (%), by Material 2025 & 2033
- Figure 4: North America Beverage Caps and Closures Industry Revenue (billion), by Country 2025 & 2033
- Figure 5: North America Beverage Caps and Closures Industry Revenue Share (%), by Country 2025 & 2033
- Figure 6: Europe Beverage Caps and Closures Industry Revenue (billion), by Material 2025 & 2033
- Figure 7: Europe Beverage Caps and Closures Industry Revenue Share (%), by Material 2025 & 2033
- Figure 8: Europe Beverage Caps and Closures Industry Revenue (billion), by Country 2025 & 2033
- Figure 9: Europe Beverage Caps and Closures Industry Revenue Share (%), by Country 2025 & 2033
- Figure 10: Asia Pacific Beverage Caps and Closures Industry Revenue (billion), by Material 2025 & 2033
- Figure 11: Asia Pacific Beverage Caps and Closures Industry Revenue Share (%), by Material 2025 & 2033
- Figure 12: Asia Pacific Beverage Caps and Closures Industry Revenue (billion), by Country 2025 & 2033
- Figure 13: Asia Pacific Beverage Caps and Closures Industry Revenue Share (%), by Country 2025 & 2033
- Figure 14: Latin America Beverage Caps and Closures Industry Revenue (billion), by Material 2025 & 2033
- Figure 15: Latin America Beverage Caps and Closures Industry Revenue Share (%), by Material 2025 & 2033
- Figure 16: Latin America Beverage Caps and Closures Industry Revenue (billion), by Country 2025 & 2033
- Figure 17: Latin America Beverage Caps and Closures Industry Revenue Share (%), by Country 2025 & 2033
- Figure 18: Middle East and Africa Beverage Caps and Closures Industry Revenue (billion), by Material 2025 & 2033
- Figure 19: Middle East and Africa Beverage Caps and Closures Industry Revenue Share (%), by Material 2025 & 2033
- Figure 20: Middle East and Africa Beverage Caps and Closures Industry Revenue (billion), by Country 2025 & 2033
- Figure 21: Middle East and Africa Beverage Caps and Closures Industry Revenue Share (%), by Country 2025 & 2033
List of Tables
- Table 1: Global Beverage Caps and Closures Industry Revenue billion Forecast, by Material 2020 & 2033
- Table 2: Global Beverage Caps and Closures Industry Revenue billion Forecast, by Region 2020 & 2033
- Table 3: Global Beverage Caps and Closures Industry Revenue billion Forecast, by Material 2020 & 2033
- Table 4: Global Beverage Caps and Closures Industry Revenue billion Forecast, by Country 2020 & 2033
- Table 5: US Beverage Caps and Closures Industry Revenue (billion) Forecast, by Application 2020 & 2033
- Table 6: Canada Beverage Caps and Closures Industry Revenue (billion) Forecast, by Application 2020 & 2033
- Table 7: Global Beverage Caps and Closures Industry Revenue billion Forecast, by Material 2020 & 2033
- Table 8: Global Beverage Caps and Closures Industry Revenue billion Forecast, by Country 2020 & 2033
- Table 9: Germany Beverage Caps and Closures Industry Revenue (billion) Forecast, by Application 2020 & 2033
- Table 10: UK Beverage Caps and Closures Industry Revenue (billion) Forecast, by Application 2020 & 2033
- Table 11: France Beverage Caps and Closures Industry Revenue (billion) Forecast, by Application 2020 & 2033
- Table 12: Rest of Europe Beverage Caps and Closures Industry Revenue (billion) Forecast, by Application 2020 & 2033
- Table 13: Global Beverage Caps and Closures Industry Revenue billion Forecast, by Material 2020 & 2033
- Table 14: Global Beverage Caps and Closures Industry Revenue billion Forecast, by Country 2020 & 2033
- Table 15: China Beverage Caps and Closures Industry Revenue (billion) Forecast, by Application 2020 & 2033
- Table 16: Japan Beverage Caps and Closures Industry Revenue (billion) Forecast, by Application 2020 & 2033
- Table 17: India Beverage Caps and Closures Industry Revenue (billion) Forecast, by Application 2020 & 2033
- Table 18: Rest of Asia Pacific Beverage Caps and Closures Industry Revenue (billion) Forecast, by Application 2020 & 2033
- Table 19: Global Beverage Caps and Closures Industry Revenue billion Forecast, by Material 2020 & 2033
- Table 20: Global Beverage Caps and Closures Industry Revenue billion Forecast, by Country 2020 & 2033
- Table 21: Brazil Beverage Caps and Closures Industry Revenue (billion) Forecast, by Application 2020 & 2033
- Table 22: Mexico Beverage Caps and Closures Industry Revenue (billion) Forecast, by Application 2020 & 2033
- Table 23: Rest of Latin America Beverage Caps and Closures Industry Revenue (billion) Forecast, by Application 2020 & 2033
- Table 24: Global Beverage Caps and Closures Industry Revenue billion Forecast, by Material 2020 & 2033
- Table 25: Global Beverage Caps and Closures Industry Revenue billion Forecast, by Country 2020 & 2033
- Table 26: UAE Beverage Caps and Closures Industry Revenue (billion) Forecast, by Application 2020 & 2033
- Table 27: Saudi Arabia Beverage Caps and Closures Industry Revenue (billion) Forecast, by Application 2020 & 2033
- Table 28: South Africa Beverage Caps and Closures Industry Revenue (billion) Forecast, by Application 2020 & 2033
- Table 29: Rest of Middle East Beverage Caps and Closures Industry Revenue (billion) Forecast, by Application 2020 & 2033
Frequently Asked Questions
1. What is the projected Compound Annual Growth Rate (CAGR) of the Beverage Caps and Closures Industry?
The projected CAGR is approximately 4.6%.
2. Which companies are prominent players in the Beverage Caps and Closures Industry?
Key companies in the market include Aptar Group Inc, Tetra Laval International*List Not Exhaustive, Pact Group, Ball Corporation, Global Closure Systems, Bericap GmbH & Co KG, Guala Closures Group, Crown Holdings Inc, Albea Group, Evergreen Packaging Inc, Berry Global Inc, Silgan Holdings Inc, Amcor Ltd.
3. What are the main segments of the Beverage Caps and Closures Industry?
The market segments include Material.
4. Can you provide details about the market size?
The market size is estimated to be USD 13.3 billion as of 2022.
5. What are some drivers contributing to market growth?
; Increasing Beverage Consumption in Developing Economies; Technological Advancements and Innovative Packaging Solutions.
6. What are the notable trends driving market growth?
Plastic is Expected to Experience a Significant Market Share.
7. Are there any restraints impacting market growth?
; Stringent Regulations on the Usage of Plastic Bottles.
8. Can you provide examples of recent developments in the market?
N/A
9. What pricing options are available for accessing the report?
Pricing options include single-user, multi-user, and enterprise licenses priced at USD 4750, USD 5250, and USD 8750 respectively.
10. Is the market size provided in terms of value or volume?
The market size is provided in terms of value, measured in billion.
11. Are there any specific market keywords associated with the report?
Yes, the market keyword associated with the report is "Beverage Caps and Closures Industry," which aids in identifying and referencing the specific market segment covered.
12. How do I determine which pricing option suits my needs best?
The pricing options vary based on user requirements and access needs. Individual users may opt for single-user licenses, while businesses requiring broader access may choose multi-user or enterprise licenses for cost-effective access to the report.
13. Are there any additional resources or data provided in the Beverage Caps and Closures Industry report?
While the report offers comprehensive insights, it's advisable to review the specific contents or supplementary materials provided to ascertain if additional resources or data are available.
14. How can I stay updated on further developments or reports in the Beverage Caps and Closures Industry?
To stay informed about further developments, trends, and reports in the Beverage Caps and Closures Industry, consider subscribing to industry newsletters, following relevant companies and organizations, or regularly checking reputable industry news sources and publications.
Methodology
Step 1 - Identification of Relevant Samples Size from Population Database


Step 2 - Approaches for Defining Global Market Size (Value, Volume* & Price*)

Note*: In applicable scenarios
Step 3 - Data Sources
Primary Research
- Web Analytics
- Survey Reports
- Research Institute
- Latest Research Reports
- Opinion Leaders
Secondary Research
- Annual Reports
- White Paper
- Latest Press Release
- Industry Association
- Paid Database
- Investor Presentations

Step 4 - Data Triangulation
Involves using different sources of information in order to increase the validity of a study
These sources are likely to be stakeholders in a program - participants, other researchers, program staff, other community members, and so on.
Then we put all data in single framework & apply various statistical tools to find out the dynamic on the market.
During the analysis stage, feedback from the stakeholder groups would be compared to determine areas of agreement as well as areas of divergence