

Key Insights
The global beer cans market is projected to reach a significant size of 65.9 billion by 2025, with a robust Compound Annual Growth Rate (CAGR) of 5.3% through 2033. This expansion is fueled by increasing demand for convenient and sustainable beverage packaging, especially for beer. Key growth drivers include the rising popularity of single-serve cans and the preference for recyclable, lightweight aluminum cans. Evolving consumer lifestyles, growing disposable incomes in emerging economies, and the widespread availability of craft beers in cans further contribute to this positive market trajectory. The market is primarily segmented by product type, with aluminum cans leading due to their environmental benefits and cost-effectiveness, followed by steel/tin cans. Leading manufacturers like Toyo Seikan Kaisha Ltd., Ball Corporation, and Crown Holdings Inc. are driving innovation in can design, material efficiency, and sustainable manufacturing.
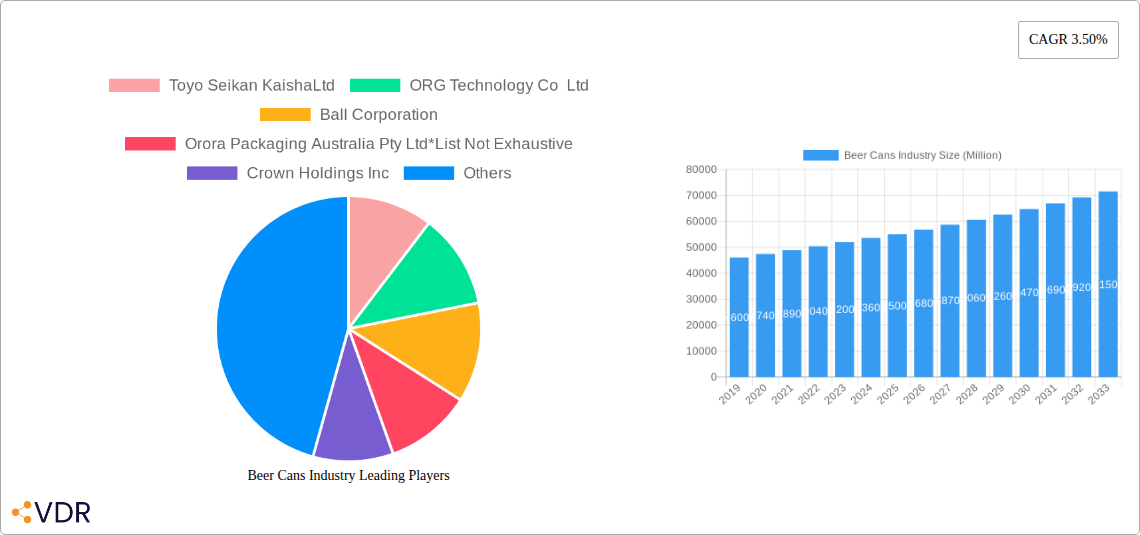
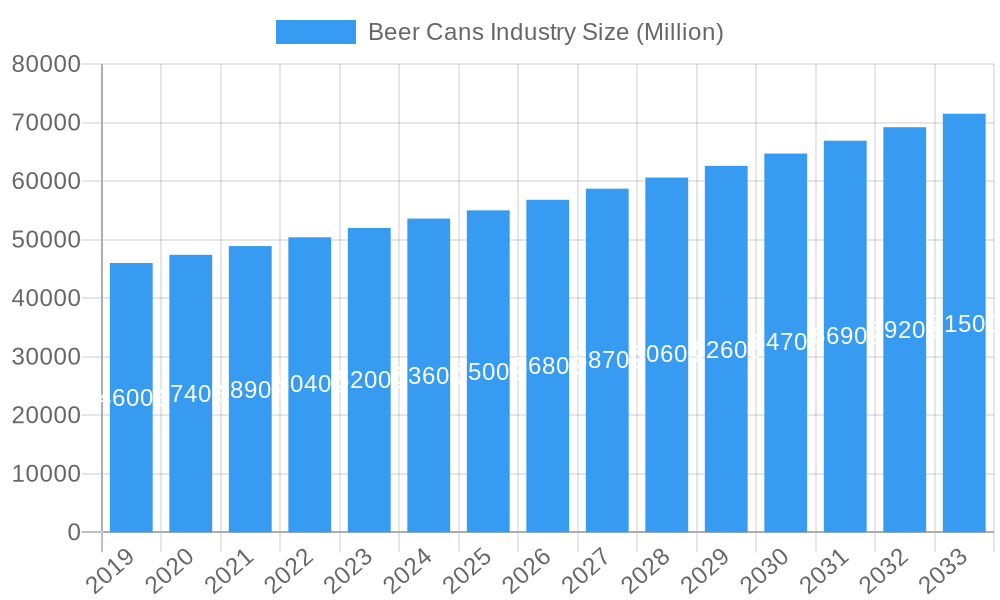
Beer Cans Industry Market Size (In Billion)
Market growth faces challenges from fluctuating raw material prices, particularly for aluminum, and competition from alternative packaging formats such as glass bottles and PET containers. However, strategic initiatives focused on capacity expansion, R&D investment in advanced can technologies, and a strong emphasis on circular economy principles are expected to mitigate these restraints. Geographically, the Asia Pacific region, led by China and India, is poised for substantial growth due to its large population and expanding middle class. North America and Europe remain key markets, driven by strong consumer demand for premium and craft beers in cans. Latin America and the Middle East also present significant growth opportunities as beer consumption patterns diversify.
Beer Cans Industry Company Market Share
Beer Cans Market Analysis Report: 2019–2033 (Forecast)
This comprehensive report provides critical insights into the global beer cans market. Covering the historical period 2019–2024 and a forecast period extending to 2033, with 2025 as the base year, this analysis examines market size evolution, regional dominance, product innovation, and key industry trends. Leveraging extensive data and expert analysis, the report details the growth trajectory of aluminum and steel/tin beer cans, identifying key drivers, barriers, and emerging opportunities.
This report is structured to deliver actionable intelligence, focusing on market segments and presenting all quantitative values in millions for clarity and ease of comparison.
Beer Cans Industry Market Dynamics & Structure
The Beer Cans Industry is characterized by a moderate to high level of market concentration, with a few dominant players controlling a significant share. Technological innovation is a primary driver, particularly in lightweighting and sustainability, pushing advancements in aluminum can manufacturing. Regulatory frameworks, including recycling mandates and environmental protection laws, significantly shape production processes and material choices. Competitive product substitutes, such as glass bottles and PET containers, exert pressure, but the superior recyclability and portability of metal cans maintain their strong market position. End-user demographics, with a growing preference for convenience and sustainable packaging among younger consumers, are increasingly influencing product development. Mergers and acquisitions (M&A) are strategic tools employed by major companies to expand their global reach, enhance production capacities, and acquire new technologies.
- Market Concentration: Dominated by key global players, with significant regional variations.
- Technological Innovation: Focus on lightweighting, enhanced barrier properties, and improved recyclability.
- Regulatory Frameworks: Environmental regulations and extended producer responsibility schemes are crucial influences.
- Competitive Substitutes: While present, metal cans offer distinct advantages in sustainability and shelf-life.
- End-User Demographics: Millennial and Gen Z consumers increasingly favor sustainable and convenient packaging.
- M&A Trends: Strategic acquisitions to consolidate market share and expand product portfolios.
Beer Cans Industry Growth Trends & Insights
The Beer Cans Industry is poised for robust growth, driven by an escalating global demand for beer and a discernible shift towards sustainable packaging solutions. The market size is projected to expand significantly from approximately 230,000 Million Units in 2019 to an estimated 350,000 Million Units by 2033, exhibiting a Compound Annual Growth Rate (CAGR) of XX%. Adoption rates for aluminum cans, particularly those with high recycled content, are accelerating due to strong consumer preference and increasing environmental consciousness. Technological disruptions, such as advancements in can manufacturing that allow for thinner walls and more efficient material usage, are contributing to cost reductions and enhanced product performance. Consumer behavior shifts, including a growing appreciation for craft beers often packaged in cans and an increasing awareness of the circular economy, are further fueling market penetration. The inherent recyclability of aluminum and steel ensures that metal cans remain the preferred choice for many beverage producers.
Dominant Regions, Countries, or Segments in Beer Cans Industry
The Aluminum Can segment is the dominant force driving growth within the Beer Cans Industry, accounting for an estimated 75% of the global market share. This dominance is propelled by several key factors. Economically, aluminum's lightweight nature translates to lower transportation costs and a reduced carbon footprint throughout the supply chain, appealing to both manufacturers and environmentally conscious consumers. Infrastructure development in regions like North America and Europe has supported extensive recycling programs, ensuring a high availability of recycled aluminum, which further strengthens the economic viability and environmental credentials of aluminum cans. Market share in this segment is substantial, with an estimated 250,000 Million Units in the forecast year 2025.
Key drivers for the dominance of aluminum cans include:
- Sustainability: Infinite recyclability and high recycled content rates (e.g., 90% in Ball's new cups) resonate with consumer demand for eco-friendly products.
- Lightweighting: Continuous advancements in can technology have led to significant weight reductions (e.g., Crown Holdings' 4% global average reduction in standard can weight), improving efficiency and reducing environmental impact.
- Brand Protection: Aluminum cans offer excellent barrier properties, preserving the flavor and quality of beer.
- Consumer Preference: Growing demand for convenience and single-serving portions, often associated with canned beverages, especially in emerging markets.
- Economic Viability: Lower manufacturing costs due to efficient recycling processes and reduced material usage.
Beer Cans Industry Product Landscape
The product landscape of the Beer Cans Industry is defined by continuous innovation focused on enhancing sustainability and consumer appeal. Aluminum cans dominate due to their infinitely recyclable nature and lightweight properties. Advancements in lightweighting technology have led to thinner-walled cans, reducing material usage and environmental impact, as exemplified by Crown Holdings' R&D efforts. Furthermore, the industry is witnessing a trend towards expanded product offerings, with companies like Ball Corporation introducing smaller, more versatile cup sizes (9-ounce and 12-ounce) for the food service sector, further solidifying aluminum's position. Unique selling propositions increasingly revolve around recycled content, with Ball Aluminum Cup now boasting 90% recycled content, setting a new benchmark in beverage packaging.
Key Drivers, Barriers & Challenges in Beer Cans Industry
Key Drivers:
- Rising Global Beer Consumption: Increasing per capita consumption of beer worldwide directly fuels demand for beer cans.
- Sustainability Imperative: Growing consumer and regulatory pressure for environmentally friendly packaging options strongly favors infinitely recyclable metal cans.
- Lightweighting Innovations: Ongoing technological advancements in reducing can weight lead to cost efficiencies and a lower carbon footprint.
- Convenience and Portability: The single-serving, durable nature of beer cans appeals to on-the-go consumers and outdoor activities.
Barriers & Challenges:
- Raw Material Price Volatility: Fluctuations in the prices of aluminum and steel can impact manufacturing costs and profit margins.
- Recycling Infrastructure Gaps: Inconsistent and underdeveloped recycling infrastructure in certain regions can hinder circularity and increase reliance on virgin materials.
- Competition from Substitutes: While metal cans hold a strong position, alternatives like glass bottles and emerging bioplastics continue to pose competitive challenges.
- Energy-Intensive Production: The production of primary aluminum, though decreasingly relied upon due to recycling, still requires significant energy.
Emerging Opportunities in Beer Cans Industry
Emerging opportunities in the Beer Cans Industry lie in the expansion of direct-to-consumer (DTC) models and the increasing demand for innovative can formats that cater to diverse consumption occasions. The growing craft beer market, with its emphasis on unique branding and packaging, presents a significant avenue for growth. Furthermore, advancements in printing and coating technologies are enabling more sophisticated and appealing can designs, enhancing brand visibility and consumer engagement. The push for enhanced sustainability also opens doors for the development of even higher recycled content cans and the exploration of novel end-of-life solutions.
Growth Accelerators in the Beer Cans Industry Industry
The Beer Cans Industry's long-term growth is being significantly accelerated by technological breakthroughs in sustainable manufacturing and the increasing integration of advanced recycling technologies. Strategic partnerships between can manufacturers, breweries, and waste management companies are fostering a more robust circular economy. Market expansion strategies, particularly targeting developing economies with growing middle classes and increasing disposable incomes, are also crucial growth catalysts. The continuous drive towards lightweighting, reducing the environmental footprint, and enhancing the consumer experience through improved can functionality and aesthetics are propelling the industry forward.
Key Players Shaping the Beer Cans Industry Market
- Toyo Seikan Kaisha Ltd
- ORG Technology Co Ltd
- Ball Corporation
- Orora Packaging Australia Pty Ltd*List Not Exhaustive
- Crown Holdings Inc
- Shenzhen Xin Yuheng Can Co Ltd
- Kaufman Container
- Daiwa Can Co
- Can-Pack S A
Notable Milestones in Beer Cans Industry Sector
- October 2022: Ball Corporation announced the portfolio expansion of its infinitely recyclable ball aluminum cup with the launch of two new, smaller sizes (9-ounce and 12-ounce cup sizes). The Ball Aluminum Cup available for food service customers is now composed of 90% recycled content, making it the cup with the highest recycled content rate of any beverage packaging in its category.
- September 2022: Crown Holdings, Inc announced the company Research & Development (R&D) achieved a 4% global average reduction in our standard 12 oz. (330 ml) can weight, and lightweighting efforts add to metal's superior properties in terms of recyclability. The benefits are compounded as the material circulates through the process repeatedly. Weight reductions allow us to produce more cans with the same aluminum used previously for standard cans. It includes a positive impact on GHG emissions through energy savings. as part of the Twenty by 30 sustainability strategy to enhance sustainability and reduce greenhouse gas (GHG) emissions.
In-Depth Beer Cans Industry Market Outlook
The future of the Beer Cans Industry is exceptionally bright, underpinned by a confluence of factors driving sustained growth and innovation. The relentless pursuit of sustainability will continue to position metal cans, especially aluminum, as the preferred packaging choice. Growth accelerators include the ongoing development of advanced recycling infrastructure, enabling higher rates of material recovery and reuse, and the expanding adoption of lightweighting technologies that enhance cost-efficiency and environmental performance. Furthermore, strategic market expansion into emerging economies, coupled with a deeper understanding and catering to evolving consumer preferences for convenience and eco-conscious products, will define the industry's trajectory, promising significant potential and lucrative opportunities for stakeholders.
Beer Cans Industry Segmentation
-
1. Product Type
- 1.1. Aluminum Can
- 1.2. Steel/Tin Can
Beer Cans Industry Segmentation By Geography
-
1. North America
- 1.1. United States
- 1.2. Canada
-
2. Europe
- 2.1. Germany
- 2.2. France
- 2.3. United Kingdom
- 2.4. Spain
- 2.5. Rest of Europe
-
3. Asia Pacific
- 3.1. China
- 3.2. Japan
- 3.3. India
- 3.4. Australia
- 3.5. Rest of Asia Pacific
-
4. Latin America
- 4.1. Brazil
- 4.2. Rest of Latin America
- 5. Middle East
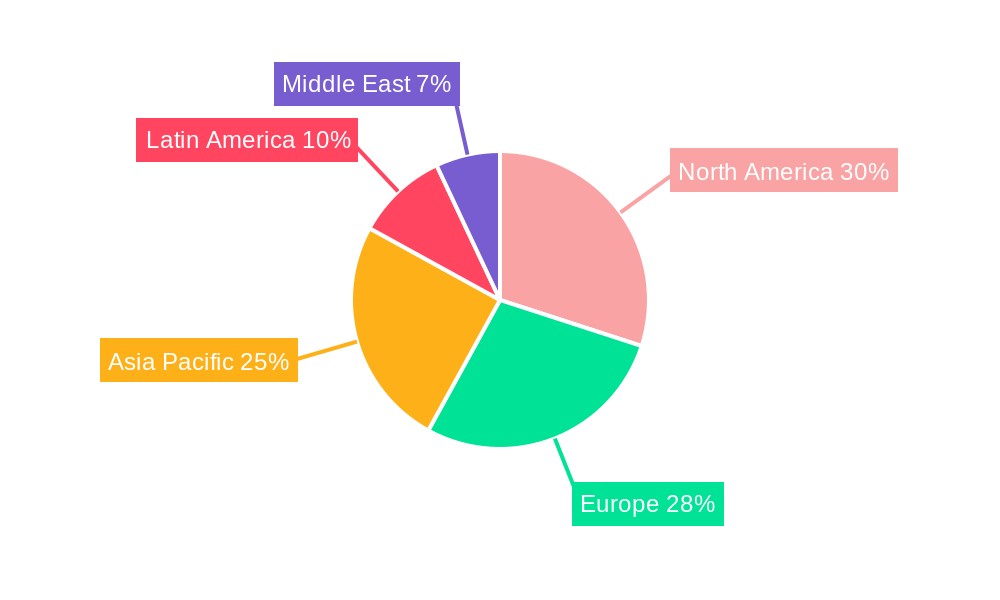
Beer Cans Industry Regional Market Share
Geographic Coverage of Beer Cans Industry
Beer Cans Industry REPORT HIGHLIGHTS
| Aspects | Details |
|---|---|
| Study Period | 2020-2034 |
| Base Year | 2025 |
| Estimated Year | 2026 |
| Forecast Period | 2026-2034 |
| Historical Period | 2020-2025 |
| Growth Rate | CAGR of 5.3% from 2020-2034 |
| Segmentation |
|
Table of Contents
- 1. Introduction
- 1.1. Research Scope
- 1.2. Market Segmentation
- 1.3. Research Objective
- 1.4. Definitions and Assumptions
- 2. Executive Summary
- 2.1. Market Snapshot
- 3. Market Dynamics
- 3.1. Market Drivers
- 3.2. Market Restrains
- 3.3. Market Trends
- 3.4. Market Opportunities
- 4. Market Factor Analysis
- 4.1. Porters Five Forces
- 4.1.1. Bargaining Power of Suppliers
- 4.1.2. Bargaining Power of Buyers
- 4.1.3. Threat of New Entrants
- 4.1.4. Threat of Substitutes
- 4.1.5. Competitive Rivalry
- 4.2. PESTEL analysis
- 4.3. BCG Analysis
- 4.3.1. Stars (High Growth, High Market Share)
- 4.3.2. Cash Cows (Low Growth, High Market Share)
- 4.3.3. Question Mark (High Growth, Low Market Share)
- 4.3.4. Dogs (Low Growth, Low Market Share)
- 4.4. Ansoff Matrix Analysis
- 4.5. Supply Chain Analysis
- 4.6. Regulatory Landscape
- 4.7. Current Market Potential and Opportunity Assessment (TAM–SAM–SOM Framework)
- 4.8. VDR Analyst Note
- 4.1. Porters Five Forces
- 5. Market Analysis, Insights and Forecast 2021-2033
- 5.1. Market Analysis, Insights and Forecast - by Product Type
- 5.1.1. Aluminum Can
- 5.1.2. Steel/Tin Can
- 5.2. Market Analysis, Insights and Forecast - by Region
- 5.2.1. North America
- 5.2.2. Europe
- 5.2.3. Asia Pacific
- 5.2.4. Latin America
- 5.2.5. Middle East
- 5.1. Market Analysis, Insights and Forecast - by Product Type
- 6. Global Beer Cans Industry Analysis, Insights and Forecast, 2021-2033
- 6.1. Market Analysis, Insights and Forecast - by Product Type
- 6.1.1. Aluminum Can
- 6.1.2. Steel/Tin Can
- 6.1. Market Analysis, Insights and Forecast - by Product Type
- 7. North America Beer Cans Industry Analysis, Insights and Forecast, 2021-2033
- 7.1. Market Analysis, Insights and Forecast - by Product Type
- 7.1.1. Aluminum Can
- 7.1.2. Steel/Tin Can
- 7.1. Market Analysis, Insights and Forecast - by Product Type
- 8. Europe Beer Cans Industry Analysis, Insights and Forecast, 2021-2033
- 8.1. Market Analysis, Insights and Forecast - by Product Type
- 8.1.1. Aluminum Can
- 8.1.2. Steel/Tin Can
- 8.1. Market Analysis, Insights and Forecast - by Product Type
- 9. Asia Pacific Beer Cans Industry Analysis, Insights and Forecast, 2021-2033
- 9.1. Market Analysis, Insights and Forecast - by Product Type
- 9.1.1. Aluminum Can
- 9.1.2. Steel/Tin Can
- 9.1. Market Analysis, Insights and Forecast - by Product Type
- 10. Latin America Beer Cans Industry Analysis, Insights and Forecast, 2021-2033
- 10.1. Market Analysis, Insights and Forecast - by Product Type
- 10.1.1. Aluminum Can
- 10.1.2. Steel/Tin Can
- 10.1. Market Analysis, Insights and Forecast - by Product Type
- 11. Middle East Beer Cans Industry Analysis, Insights and Forecast, 2021-2033
- 11.1. Market Analysis, Insights and Forecast - by Product Type
- 11.1.1. Aluminum Can
- 11.1.2. Steel/Tin Can
- 11.1. Market Analysis, Insights and Forecast - by Product Type
- 12. Competitive Analysis
- 12.1. Company Profiles
- 12.1.1 Toyo Seikan KaishaLtd
- 12.1.1.1. Company Overview
- 12.1.1.2. Products
- 12.1.1.3. Company Financials
- 12.1.1.4. SWOT Analysis
- 12.1.2 ORG Technology Co Ltd
- 12.1.2.1. Company Overview
- 12.1.2.2. Products
- 12.1.2.3. Company Financials
- 12.1.2.4. SWOT Analysis
- 12.1.3 Ball Corporation
- 12.1.3.1. Company Overview
- 12.1.3.2. Products
- 12.1.3.3. Company Financials
- 12.1.3.4. SWOT Analysis
- 12.1.4 Orora Packaging Australia Pty Ltd*List Not Exhaustive
- 12.1.4.1. Company Overview
- 12.1.4.2. Products
- 12.1.4.3. Company Financials
- 12.1.4.4. SWOT Analysis
- 12.1.5 Crown Holdings Inc
- 12.1.5.1. Company Overview
- 12.1.5.2. Products
- 12.1.5.3. Company Financials
- 12.1.5.4. SWOT Analysis
- 12.1.6 Shenzhen Xin Yuheng Can Co Ltd
- 12.1.6.1. Company Overview
- 12.1.6.2. Products
- 12.1.6.3. Company Financials
- 12.1.6.4. SWOT Analysis
- 12.1.7 Kaufman Container
- 12.1.7.1. Company Overview
- 12.1.7.2. Products
- 12.1.7.3. Company Financials
- 12.1.7.4. SWOT Analysis
- 12.1.8 Daiwa Can Co
- 12.1.8.1. Company Overview
- 12.1.8.2. Products
- 12.1.8.3. Company Financials
- 12.1.8.4. SWOT Analysis
- 12.1.9 Can-Pack S A
- 12.1.9.1. Company Overview
- 12.1.9.2. Products
- 12.1.9.3. Company Financials
- 12.1.9.4. SWOT Analysis
- 12.1.1 Toyo Seikan KaishaLtd
- 12.2. Market Entropy
- 12.2.1 Company's Key Areas Served
- 12.2.2 Recent Developments
- 12.3. Company Market Share Analysis 2025
- 12.3.1 Top 5 Companies Market Share Analysis
- 12.3.2 Top 3 Companies Market Share Analysis
- 12.4. List of Potential Customers
- 13. Research Methodology
List of Figures
- Figure 1: Global Beer Cans Industry Revenue Breakdown (billion, %) by Region 2025 & 2033
- Figure 2: North America Beer Cans Industry Revenue (billion), by Product Type 2025 & 2033
- Figure 3: North America Beer Cans Industry Revenue Share (%), by Product Type 2025 & 2033
- Figure 4: North America Beer Cans Industry Revenue (billion), by Country 2025 & 2033
- Figure 5: North America Beer Cans Industry Revenue Share (%), by Country 2025 & 2033
- Figure 6: Europe Beer Cans Industry Revenue (billion), by Product Type 2025 & 2033
- Figure 7: Europe Beer Cans Industry Revenue Share (%), by Product Type 2025 & 2033
- Figure 8: Europe Beer Cans Industry Revenue (billion), by Country 2025 & 2033
- Figure 9: Europe Beer Cans Industry Revenue Share (%), by Country 2025 & 2033
- Figure 10: Asia Pacific Beer Cans Industry Revenue (billion), by Product Type 2025 & 2033
- Figure 11: Asia Pacific Beer Cans Industry Revenue Share (%), by Product Type 2025 & 2033
- Figure 12: Asia Pacific Beer Cans Industry Revenue (billion), by Country 2025 & 2033
- Figure 13: Asia Pacific Beer Cans Industry Revenue Share (%), by Country 2025 & 2033
- Figure 14: Latin America Beer Cans Industry Revenue (billion), by Product Type 2025 & 2033
- Figure 15: Latin America Beer Cans Industry Revenue Share (%), by Product Type 2025 & 2033
- Figure 16: Latin America Beer Cans Industry Revenue (billion), by Country 2025 & 2033
- Figure 17: Latin America Beer Cans Industry Revenue Share (%), by Country 2025 & 2033
- Figure 18: Middle East Beer Cans Industry Revenue (billion), by Product Type 2025 & 2033
- Figure 19: Middle East Beer Cans Industry Revenue Share (%), by Product Type 2025 & 2033
- Figure 20: Middle East Beer Cans Industry Revenue (billion), by Country 2025 & 2033
- Figure 21: Middle East Beer Cans Industry Revenue Share (%), by Country 2025 & 2033
List of Tables
- Table 1: Global Beer Cans Industry Revenue billion Forecast, by Product Type 2020 & 2033
- Table 2: Global Beer Cans Industry Revenue billion Forecast, by Region 2020 & 2033
- Table 3: Global Beer Cans Industry Revenue billion Forecast, by Product Type 2020 & 2033
- Table 4: Global Beer Cans Industry Revenue billion Forecast, by Country 2020 & 2033
- Table 5: United States Beer Cans Industry Revenue (billion) Forecast, by Application 2020 & 2033
- Table 6: Canada Beer Cans Industry Revenue (billion) Forecast, by Application 2020 & 2033
- Table 7: Global Beer Cans Industry Revenue billion Forecast, by Product Type 2020 & 2033
- Table 8: Global Beer Cans Industry Revenue billion Forecast, by Country 2020 & 2033
- Table 9: Germany Beer Cans Industry Revenue (billion) Forecast, by Application 2020 & 2033
- Table 10: France Beer Cans Industry Revenue (billion) Forecast, by Application 2020 & 2033
- Table 11: United Kingdom Beer Cans Industry Revenue (billion) Forecast, by Application 2020 & 2033
- Table 12: Spain Beer Cans Industry Revenue (billion) Forecast, by Application 2020 & 2033
- Table 13: Rest of Europe Beer Cans Industry Revenue (billion) Forecast, by Application 2020 & 2033
- Table 14: Global Beer Cans Industry Revenue billion Forecast, by Product Type 2020 & 2033
- Table 15: Global Beer Cans Industry Revenue billion Forecast, by Country 2020 & 2033
- Table 16: China Beer Cans Industry Revenue (billion) Forecast, by Application 2020 & 2033
- Table 17: Japan Beer Cans Industry Revenue (billion) Forecast, by Application 2020 & 2033
- Table 18: India Beer Cans Industry Revenue (billion) Forecast, by Application 2020 & 2033
- Table 19: Australia Beer Cans Industry Revenue (billion) Forecast, by Application 2020 & 2033
- Table 20: Rest of Asia Pacific Beer Cans Industry Revenue (billion) Forecast, by Application 2020 & 2033
- Table 21: Global Beer Cans Industry Revenue billion Forecast, by Product Type 2020 & 2033
- Table 22: Global Beer Cans Industry Revenue billion Forecast, by Country 2020 & 2033
- Table 23: Brazil Beer Cans Industry Revenue (billion) Forecast, by Application 2020 & 2033
- Table 24: Rest of Latin America Beer Cans Industry Revenue (billion) Forecast, by Application 2020 & 2033
- Table 25: Global Beer Cans Industry Revenue billion Forecast, by Product Type 2020 & 2033
- Table 26: Global Beer Cans Industry Revenue billion Forecast, by Country 2020 & 2033
Frequently Asked Questions
1. What is the projected Compound Annual Growth Rate (CAGR) of the Beer Cans Industry?
The projected CAGR is approximately 5.3%.
2. Which companies are prominent players in the Beer Cans Industry?
Key companies in the market include Toyo Seikan KaishaLtd, ORG Technology Co Ltd, Ball Corporation, Orora Packaging Australia Pty Ltd*List Not Exhaustive, Crown Holdings Inc, Shenzhen Xin Yuheng Can Co Ltd, Kaufman Container, Daiwa Can Co, Can-Pack S A.
3. What are the main segments of the Beer Cans Industry?
The market segments include Product Type.
4. Can you provide details about the market size?
The market size is estimated to be USD 65.9 billion as of 2022.
5. What are some drivers contributing to market growth?
Growing Consumption of Craft Beer Across Various Regions; Recreational and Environmental Benefits.
6. What are the notable trends driving market growth?
Aluminium is Expected to Hold the Largest Market Share.
7. Are there any restraints impacting market growth?
Changing Consumer Preferences.
8. Can you provide examples of recent developments in the market?
October 2022 - Ball Corporation announced the portfolio expansion of its infinitely recyclable ball aluminum cup with the launch of two new, smaller sizes (9-ounce and 12-ounce cup sizes). The Ball Aluminum Cup available for food service customers is now composed of 90% recycled content, making it the cup with the highest recycled content rate of any beverage packaging in its category.
9. What pricing options are available for accessing the report?
Pricing options include single-user, multi-user, and enterprise licenses priced at USD 4750, USD 5250, and USD 8750 respectively.
10. Is the market size provided in terms of value or volume?
The market size is provided in terms of value, measured in billion.
11. Are there any specific market keywords associated with the report?
Yes, the market keyword associated with the report is "Beer Cans Industry," which aids in identifying and referencing the specific market segment covered.
12. How do I determine which pricing option suits my needs best?
The pricing options vary based on user requirements and access needs. Individual users may opt for single-user licenses, while businesses requiring broader access may choose multi-user or enterprise licenses for cost-effective access to the report.
13. Are there any additional resources or data provided in the Beer Cans Industry report?
While the report offers comprehensive insights, it's advisable to review the specific contents or supplementary materials provided to ascertain if additional resources or data are available.
14. How can I stay updated on further developments or reports in the Beer Cans Industry?
To stay informed about further developments, trends, and reports in the Beer Cans Industry, consider subscribing to industry newsletters, following relevant companies and organizations, or regularly checking reputable industry news sources and publications.
Methodology
Step 1 - Identification of Relevant Samples Size from Population Database


Step 2 - Approaches for Defining Global Market Size (Value, Volume* & Price*)

Note*: In applicable scenarios
Step 3 - Data Sources
Primary Research
- Web Analytics
- Survey Reports
- Research Institute
- Latest Research Reports
- Opinion Leaders
Secondary Research
- Annual Reports
- White Paper
- Latest Press Release
- Industry Association
- Paid Database
- Investor Presentations

Step 4 - Data Triangulation
Involves using different sources of information in order to increase the validity of a study
These sources are likely to be stakeholders in a program - participants, other researchers, program staff, other community members, and so on.
Then we put all data in single framework & apply various statistical tools to find out the dynamic on the market.
During the analysis stage, feedback from the stakeholder groups would be compared to determine areas of agreement as well as areas of divergence