
Key Insights
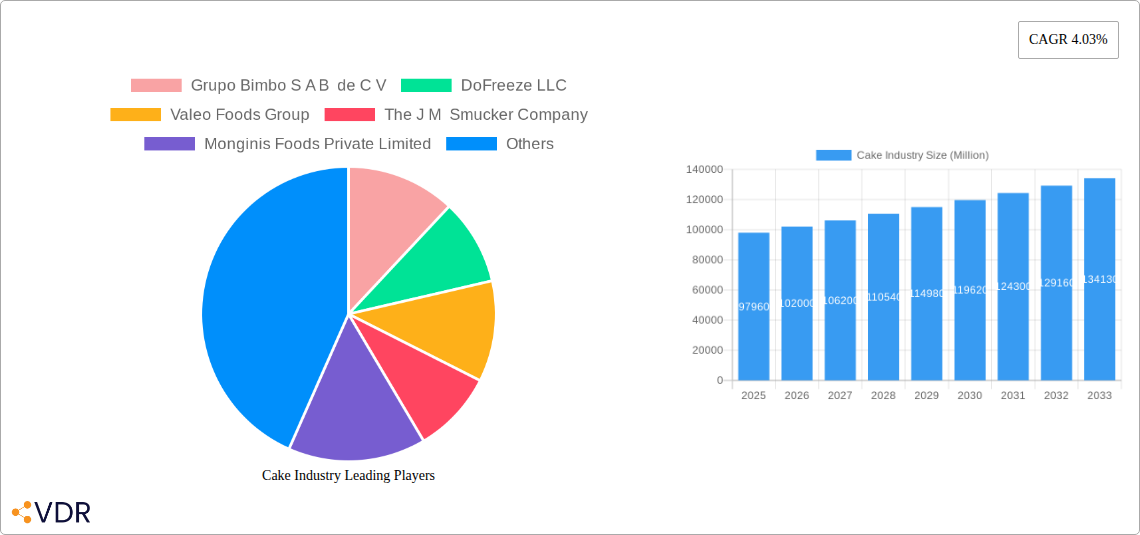
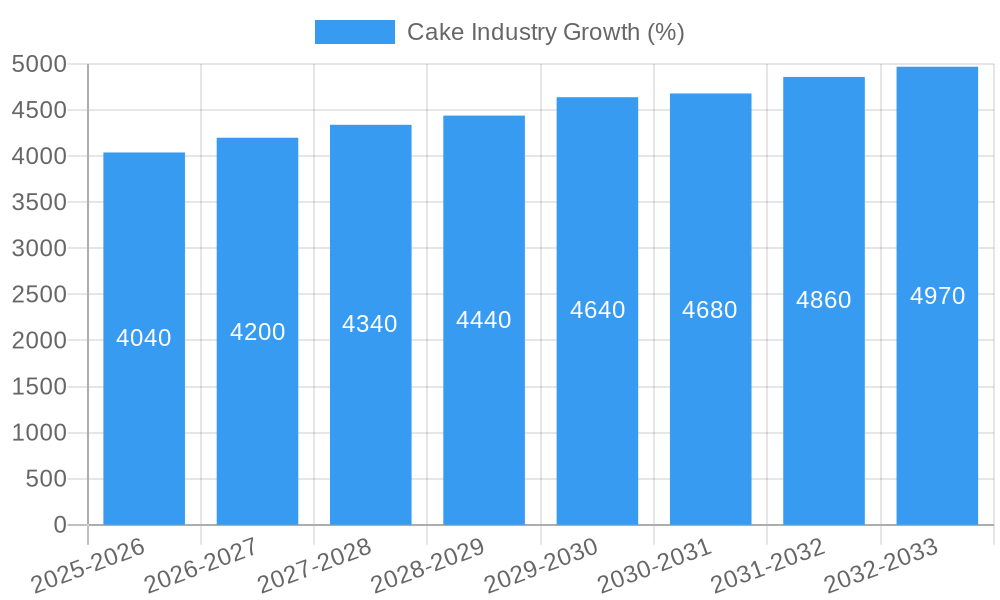
The global cake industry, valued at $97.96 billion in 2025, is projected to experience steady growth, with a Compound Annual Growth Rate (CAGR) of 4.03% from 2025 to 2033. This growth is driven by several factors. Rising disposable incomes, particularly in developing economies, are fueling increased spending on premium and indulgent food products like cakes. The burgeoning popularity of online cake delivery services and the rise of artisanal and customized cakes are also contributing significantly to market expansion. Changing consumer preferences towards convenient, ready-to-eat options, alongside the increasing demand for healthier and specialized cakes (e.g., gluten-free, vegan), are shaping product innovation and market segmentation. While the packaged cake segment holds a significant market share due to its convenience and longer shelf life, the unpackaged/artisanal segment is experiencing rapid growth fueled by consumer preference for unique flavors and high-quality ingredients. The supermarket/hypermarket channel remains dominant in distribution, but online retail is rapidly gaining traction, benefiting from enhanced convenience and wider product reach. Major players like Grupo Bimbo, McKee Foods, and Britannia Industries are leveraging brand recognition and distribution networks to maintain a strong market position, while smaller artisanal bakeries are capitalizing on the growing demand for personalized and unique cake experiences. Competition is intense, requiring companies to continuously innovate and adapt to changing consumer needs and preferences.
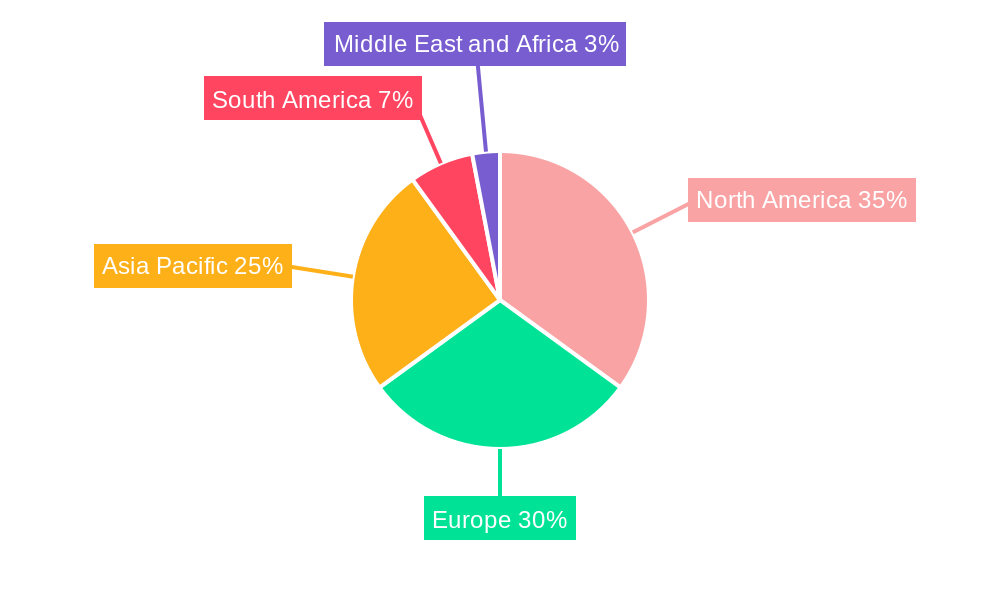
The geographic distribution of the cake market reflects varying levels of economic development and consumer preferences. North America and Europe currently hold substantial market shares, driven by established consumer bases and high per capita consumption. However, Asia-Pacific is expected to witness significant growth in the coming years, fueled by a burgeoning middle class and increasing Westernization of dietary habits. The South American and Middle Eastern/African markets also present considerable opportunities for expansion, although these regions may face challenges related to infrastructure and distribution networks. Overall, the cake industry shows resilience and adaptability, with ongoing growth anticipated across various segments and regions, reflecting the enduring appeal of cakes as celebratory and everyday treats.
Cake Industry Market Report: 2019-2033
This comprehensive report provides a detailed analysis of the global cake industry, encompassing market dynamics, growth trends, regional dominance, product landscape, key players, and future outlook. The study period covers 2019-2033, with a base year of 2025 and a forecast period of 2025-2033. This report is an essential resource for industry professionals, investors, and anyone seeking in-depth insights into this lucrative market. The report delves into both the parent market (Bakery & Confectionery) and child market (Cakes), providing granular analysis of various segments.
Cake Industry Market Dynamics & Structure
The global cake industry, a significant segment within the broader bakery and confectionery market, is characterized by a moderately concentrated market structure. While several large multinational players dominate, a substantial number of smaller, regional, and artisanal businesses contribute significantly to overall volume. Technological innovation, primarily in automation, ingredient optimization, and packaging, drives efficiency and product diversification. Stringent food safety regulations vary across geographies, influencing manufacturing practices and costs. Competitive pressures from substitute products, such as cookies, pastries, and other desserts, necessitate continuous innovation and brand differentiation. Consumer demographics, particularly changing preferences towards healthier options and convenience, heavily impact product development. Furthermore, the industry witnesses periodic mergers and acquisitions (M&A) activity, with larger companies seeking to expand their market share and product portfolios. In 2024, an estimated xx M&A deals occurred, representing a xx% increase compared to the previous year.
- Market Concentration: Moderately concentrated, with top 10 players holding an estimated xx% market share in 2024.
- Technological Innovation: Automation in production, novel ingredients (e.g., functional ingredients, organic options), and sustainable packaging technologies are key drivers.
- Regulatory Framework: Stringent food safety and labeling regulations impacting production costs and compliance.
- Competitive Substitutes: Growing competition from other dessert categories necessitates product differentiation.
- End-User Demographics: Shifting consumer preferences towards convenience, health, and premiumization influence market trends.
- M&A Activity: Ongoing consolidation through acquisitions and mergers, leading to market share shifts.
Cake Industry Growth Trends & Insights
The global cake industry experienced robust growth during the historical period (2019-2024), driven by rising disposable incomes, changing lifestyles, and increasing demand for convenient and premium dessert options. The market size reached an estimated xx million units in 2024, exhibiting a CAGR of xx% during the historical period. This growth is anticipated to continue, albeit at a slightly moderated pace, during the forecast period (2025-2033). Technological advancements, such as automated production lines and innovative packaging solutions, are enhancing efficiency and product quality. Consumer behavior is shifting towards healthier options, with a growing demand for low-sugar, gluten-free, and organic cakes. However, macroeconomic factors, including inflation and fluctuating raw material prices, pose challenges to sustained growth. The market penetration rate for packaged cakes is xx% in 2024, while the artisanal segment is witnessing a xx% CAGR. These trends are influencing product development, distribution strategies, and overall market dynamics.
Dominant Regions, Countries, or Segments in Cake Industry
The North American cake market currently holds the leading position globally, driven by high consumption rates, established distribution networks, and a robust demand for innovative products. Within North America, the United States and Canada are the dominant markets. Europe follows as a major contributor, with Western European countries exhibiting higher per capita consumption than Eastern European nations. The Asia-Pacific region presents significant growth potential, driven by rising disposable incomes, urbanization, and Westernization of food preferences. Within product segments, packaged cakes dominate the market, owing to longer shelf life, convenience, and wider availability. However, the unpackaged/artisanal segment is witnessing substantial growth, fueled by increasing consumer preference for premium, personalized, and locally sourced cakes. Supermarkets/Hypermarkets remain the dominant distribution channel due to their extensive reach and diverse product offerings.
- Key Drivers:
- North America: High consumption rates, strong retail infrastructure.
- Europe: Established market with high per capita consumption in Western Europe.
- Asia-Pacific: Rising disposable incomes, changing consumer preferences.
- Packaged Cakes: Convenience, extended shelf-life, widespread availability.
- Supermarkets/Hypermarkets: Extensive reach and diverse product offerings.
Cake Industry Product Landscape
The cake industry showcases a diverse range of products, catering to various tastes and occasions. Innovations focus on enhanced taste, texture, convenience, and health benefits. Celebration cakes, particularly for birthdays and weddings, remain a significant segment. Cupcakes and sponge cakes are popular everyday choices, while other cake varieties, including specialty flavors and customized designs, contribute to market diversity. Product differentiation is crucial, with key players focusing on unique selling propositions such as organic ingredients, gluten-free options, innovative flavors, and premium packaging. Technological advancements, like improved baking techniques and efficient freezing methods, are improving product quality and shelf life.
Key Drivers, Barriers & Challenges in Cake Industry
Key Drivers: Rising disposable incomes, increasing demand for convenience foods, expanding retail channels, and continuous product innovation are key drivers. Government initiatives promoting food processing industries in developing nations also contribute. Moreover, the growing popularity of online cake ordering and delivery platforms is expanding market reach.
Key Challenges: Fluctuating raw material prices, stringent food safety regulations, intense competition among established players and rising artisanal bakeries, and increasing health consciousness amongst consumers necessitating healthier options. These factors influence product pricing, manufacturing costs, and overall market competitiveness. Supply chain disruptions caused by geopolitical events can also negatively impact production and distribution. The estimated impact of supply chain issues on the industry in 2024 is a xx% reduction in production volume.
Emerging Opportunities in Cake Industry
Emerging opportunities lie in untapped markets, particularly in developing economies, where rising disposable incomes are driving demand for premium desserts. The growth of the online retail sector presents significant opportunities for expansion through e-commerce platforms and home delivery services. Furthermore, demand for healthy and functional cakes, with options like low-sugar, gluten-free, and organic variants, presents an avenue for product differentiation and market expansion. Innovative flavor combinations, unique designs, and personalized customization are additional growth areas.
Growth Accelerators in the Cake Industry
Technological advancements, including automation and improved ingredient sourcing, are accelerating market growth by enhancing efficiency and product quality. Strategic partnerships between established brands and emerging food technology firms are fostering innovation and market penetration. Expansion into new markets and geographical regions with significant growth potential will further enhance market expansion. Diversification of product lines, focusing on niche market segments such as gourmet cakes or specialized dietary options, will also contribute to long-term growth.
Key Players Shaping the Cake Industry Market
- Grupo Bimbo S A B de C V
- DoFreeze LLC
- Valeo Foods Group
- The J M Smucker Company
- Monginis Foods Private Limited
- Flowers Foods Inc
- Bonn Group of Industries
- Yıldız Holding
- McKee Foods Corporation
- Britannia Industries Limited
Notable Milestones in Cake Industry Sector
- March 2024: Hostess Brands launched Hostess Meltamors, a new mini-cake, expanding its product portfolio and targeting a younger demographic.
- March 2024: McKee Foods introduced Valentine's Day-themed Little Debbie products, boosting seasonal sales and brand loyalty.
- March 2024: Monginis Foods Private Limited modernized its packaging, enhancing brand image and consumer appeal.
In-Depth Cake Industry Market Outlook
The cake industry is poised for continued growth, driven by innovation, changing consumer preferences, and expanding distribution channels. Strategic investments in technology, sustainable practices, and new product development will be crucial for success. The growing demand for healthy and convenient options, coupled with the expansion of e-commerce, presents significant opportunities for market players. By leveraging these trends and focusing on consumer needs, the cake industry is set to experience sustained expansion in the coming years. The market is projected to reach xx million units by 2033, indicating strong growth potential for both established players and new entrants.
Cake Industry Segmentation
-
1. Form
- 1.1. Packaged
- 1.2. Unpackaged/Artisanal
-
2. Product Type
- 2.1. Celebration Cakes
-
2.2. Cupcakes
- 2.2.1. Center-filled
- 2.2.2. Plain
-
2.3. Sponge Cakes
- 2.3.1. Plain Cakes
- 2.3.2. Center-Filled Cakes
- 2.3.3. Others
- 2.4. Other Cakes
-
3. Distribution Channel
- 3.1. Supermarkets/Hypermarkets
- 3.2. Specialty Stores
- 3.3. Convenience Stores
- 3.4. Online Retail Stores
- 3.5. Other Distribution Channels
Cake Industry Segmentation By Geography
-
1. North America
- 1.1. United States
- 1.2. Canada
- 1.3. Mexico
- 1.4. Rest of North America
-
2. Europe
- 2.1. Germany
- 2.2. United Kingdom
- 2.3. France
- 2.4. Russia
- 2.5. Spain
- 2.6. Italy
- 2.7. Rest of Europe
-
3. Asia Pacific
- 3.1. China
- 3.2. Japan
- 3.3. India
- 3.4. Australia
- 3.5. Pakistan
- 3.6. Rest of Asia Pacific
-
4. South America
- 4.1. Brazil
- 4.2. Argentina
- 4.3. Rest of South America
-
5. Middle East and Africa
- 5.1. South Africa
- 5.2. Saudi Arabia
- 5.3. Rest of Middle East and Africa
Cake Industry REPORT HIGHLIGHTS
| Aspects | Details |
|---|---|
| Study Period | 2019-2033 |
| Base Year | 2024 |
| Estimated Year | 2025 |
| Forecast Period | 2025-2033 |
| Historical Period | 2019-2024 |
| Growth Rate | CAGR of 4.03% from 2019-2033 |
| Segmentation |
|
Table of Contents
- 1. Introduction
- 1.1. Research Scope
- 1.2. Market Segmentation
- 1.3. Research Methodology
- 1.4. Definitions and Assumptions
- 2. Executive Summary
- 2.1. Introduction
- 3. Market Dynamics
- 3.1. Introduction
- 3.2. Market Drivers
- 3.2.1. Increase in Number Of Social Event Celebration; Innovations In Designs And Flavors
- 3.3. Market Restrains
- 3.3.1. Health Concerns Related To Ingredients
- 3.4. Market Trends
- 3.4.1. Increase in Number Of Social Event Celebration
- 4. Market Factor Analysis
- 4.1. Porters Five Forces
- 4.2. Supply/Value Chain
- 4.3. PESTEL analysis
- 4.4. Market Entropy
- 4.5. Patent/Trademark Analysis
- 5. Global Cake Industry Analysis, Insights and Forecast, 2019-2031
- 5.1. Market Analysis, Insights and Forecast - by Form
- 5.1.1. Packaged
- 5.1.2. Unpackaged/Artisanal
- 5.2. Market Analysis, Insights and Forecast - by Product Type
- 5.2.1. Celebration Cakes
- 5.2.2. Cupcakes
- 5.2.2.1. Center-filled
- 5.2.2.2. Plain
- 5.2.3. Sponge Cakes
- 5.2.3.1. Plain Cakes
- 5.2.3.2. Center-Filled Cakes
- 5.2.3.3. Others
- 5.2.4. Other Cakes
- 5.3. Market Analysis, Insights and Forecast - by Distribution Channel
- 5.3.1. Supermarkets/Hypermarkets
- 5.3.2. Specialty Stores
- 5.3.3. Convenience Stores
- 5.3.4. Online Retail Stores
- 5.3.5. Other Distribution Channels
- 5.4. Market Analysis, Insights and Forecast - by Region
- 5.4.1. North America
- 5.4.2. Europe
- 5.4.3. Asia Pacific
- 5.4.4. South America
- 5.4.5. Middle East and Africa
- 5.1. Market Analysis, Insights and Forecast - by Form
- 6. North America Cake Industry Analysis, Insights and Forecast, 2019-2031
- 6.1. Market Analysis, Insights and Forecast - by Form
- 6.1.1. Packaged
- 6.1.2. Unpackaged/Artisanal
- 6.2. Market Analysis, Insights and Forecast - by Product Type
- 6.2.1. Celebration Cakes
- 6.2.2. Cupcakes
- 6.2.2.1. Center-filled
- 6.2.2.2. Plain
- 6.2.3. Sponge Cakes
- 6.2.3.1. Plain Cakes
- 6.2.3.2. Center-Filled Cakes
- 6.2.3.3. Others
- 6.2.4. Other Cakes
- 6.3. Market Analysis, Insights and Forecast - by Distribution Channel
- 6.3.1. Supermarkets/Hypermarkets
- 6.3.2. Specialty Stores
- 6.3.3. Convenience Stores
- 6.3.4. Online Retail Stores
- 6.3.5. Other Distribution Channels
- 6.1. Market Analysis, Insights and Forecast - by Form
- 7. Europe Cake Industry Analysis, Insights and Forecast, 2019-2031
- 7.1. Market Analysis, Insights and Forecast - by Form
- 7.1.1. Packaged
- 7.1.2. Unpackaged/Artisanal
- 7.2. Market Analysis, Insights and Forecast - by Product Type
- 7.2.1. Celebration Cakes
- 7.2.2. Cupcakes
- 7.2.2.1. Center-filled
- 7.2.2.2. Plain
- 7.2.3. Sponge Cakes
- 7.2.3.1. Plain Cakes
- 7.2.3.2. Center-Filled Cakes
- 7.2.3.3. Others
- 7.2.4. Other Cakes
- 7.3. Market Analysis, Insights and Forecast - by Distribution Channel
- 7.3.1. Supermarkets/Hypermarkets
- 7.3.2. Specialty Stores
- 7.3.3. Convenience Stores
- 7.3.4. Online Retail Stores
- 7.3.5. Other Distribution Channels
- 7.1. Market Analysis, Insights and Forecast - by Form
- 8. Asia Pacific Cake Industry Analysis, Insights and Forecast, 2019-2031
- 8.1. Market Analysis, Insights and Forecast - by Form
- 8.1.1. Packaged
- 8.1.2. Unpackaged/Artisanal
- 8.2. Market Analysis, Insights and Forecast - by Product Type
- 8.2.1. Celebration Cakes
- 8.2.2. Cupcakes
- 8.2.2.1. Center-filled
- 8.2.2.2. Plain
- 8.2.3. Sponge Cakes
- 8.2.3.1. Plain Cakes
- 8.2.3.2. Center-Filled Cakes
- 8.2.3.3. Others
- 8.2.4. Other Cakes
- 8.3. Market Analysis, Insights and Forecast - by Distribution Channel
- 8.3.1. Supermarkets/Hypermarkets
- 8.3.2. Specialty Stores
- 8.3.3. Convenience Stores
- 8.3.4. Online Retail Stores
- 8.3.5. Other Distribution Channels
- 8.1. Market Analysis, Insights and Forecast - by Form
- 9. South America Cake Industry Analysis, Insights and Forecast, 2019-2031
- 9.1. Market Analysis, Insights and Forecast - by Form
- 9.1.1. Packaged
- 9.1.2. Unpackaged/Artisanal
- 9.2. Market Analysis, Insights and Forecast - by Product Type
- 9.2.1. Celebration Cakes
- 9.2.2. Cupcakes
- 9.2.2.1. Center-filled
- 9.2.2.2. Plain
- 9.2.3. Sponge Cakes
- 9.2.3.1. Plain Cakes
- 9.2.3.2. Center-Filled Cakes
- 9.2.3.3. Others
- 9.2.4. Other Cakes
- 9.3. Market Analysis, Insights and Forecast - by Distribution Channel
- 9.3.1. Supermarkets/Hypermarkets
- 9.3.2. Specialty Stores
- 9.3.3. Convenience Stores
- 9.3.4. Online Retail Stores
- 9.3.5. Other Distribution Channels
- 9.1. Market Analysis, Insights and Forecast - by Form
- 10. Middle East and Africa Cake Industry Analysis, Insights and Forecast, 2019-2031
- 10.1. Market Analysis, Insights and Forecast - by Form
- 10.1.1. Packaged
- 10.1.2. Unpackaged/Artisanal
- 10.2. Market Analysis, Insights and Forecast - by Product Type
- 10.2.1. Celebration Cakes
- 10.2.2. Cupcakes
- 10.2.2.1. Center-filled
- 10.2.2.2. Plain
- 10.2.3. Sponge Cakes
- 10.2.3.1. Plain Cakes
- 10.2.3.2. Center-Filled Cakes
- 10.2.3.3. Others
- 10.2.4. Other Cakes
- 10.3. Market Analysis, Insights and Forecast - by Distribution Channel
- 10.3.1. Supermarkets/Hypermarkets
- 10.3.2. Specialty Stores
- 10.3.3. Convenience Stores
- 10.3.4. Online Retail Stores
- 10.3.5. Other Distribution Channels
- 10.1. Market Analysis, Insights and Forecast - by Form
- 11. North America Cake Industry Analysis, Insights and Forecast, 2019-2031
- 11.1. Market Analysis, Insights and Forecast - By Country/Sub-region
- 11.1.1 United States
- 11.1.2 Canada
- 11.1.3 Mexico
- 11.1.4 Rest of North America
- 12. Europe Cake Industry Analysis, Insights and Forecast, 2019-2031
- 12.1. Market Analysis, Insights and Forecast - By Country/Sub-region
- 12.1.1 Germany
- 12.1.2 United Kingdom
- 12.1.3 France
- 12.1.4 Russia
- 12.1.5 Spain
- 12.1.6 Italy
- 12.1.7 Rest of Europe
- 13. Asia Pacific Cake Industry Analysis, Insights and Forecast, 2019-2031
- 13.1. Market Analysis, Insights and Forecast - By Country/Sub-region
- 13.1.1 China
- 13.1.2 Japan
- 13.1.3 India
- 13.1.4 Australia
- 13.1.5 Pakistan
- 13.1.6 Rest of Asia Pacific
- 14. South America Cake Industry Analysis, Insights and Forecast, 2019-2031
- 14.1. Market Analysis, Insights and Forecast - By Country/Sub-region
- 14.1.1 Brazil
- 14.1.2 Argentina
- 14.1.3 Rest of South America
- 15. Middle East and Africa Cake Industry Analysis, Insights and Forecast, 2019-2031
- 15.1. Market Analysis, Insights and Forecast - By Country/Sub-region
- 15.1.1 South Africa
- 15.1.2 Saudi Arabia
- 15.1.3 Rest of Middle East and Africa
- 16. Competitive Analysis
- 16.1. Global Market Share Analysis 2024
- 16.2. Company Profiles
- 16.2.1 Grupo Bimbo S A B de C V
- 16.2.1.1. Overview
- 16.2.1.2. Products
- 16.2.1.3. SWOT Analysis
- 16.2.1.4. Recent Developments
- 16.2.1.5. Financials (Based on Availability)
- 16.2.2 DoFreeze LLC
- 16.2.2.1. Overview
- 16.2.2.2. Products
- 16.2.2.3. SWOT Analysis
- 16.2.2.4. Recent Developments
- 16.2.2.5. Financials (Based on Availability)
- 16.2.3 Valeo Foods Group
- 16.2.3.1. Overview
- 16.2.3.2. Products
- 16.2.3.3. SWOT Analysis
- 16.2.3.4. Recent Developments
- 16.2.3.5. Financials (Based on Availability)
- 16.2.4 The J M Smucker Company
- 16.2.4.1. Overview
- 16.2.4.2. Products
- 16.2.4.3. SWOT Analysis
- 16.2.4.4. Recent Developments
- 16.2.4.5. Financials (Based on Availability)
- 16.2.5 Monginis Foods Private Limited
- 16.2.5.1. Overview
- 16.2.5.2. Products
- 16.2.5.3. SWOT Analysis
- 16.2.5.4. Recent Developments
- 16.2.5.5. Financials (Based on Availability)
- 16.2.6 Flowers Foods Inc
- 16.2.6.1. Overview
- 16.2.6.2. Products
- 16.2.6.3. SWOT Analysis
- 16.2.6.4. Recent Developments
- 16.2.6.5. Financials (Based on Availability)
- 16.2.7 Bonn Group of Industries
- 16.2.7.1. Overview
- 16.2.7.2. Products
- 16.2.7.3. SWOT Analysis
- 16.2.7.4. Recent Developments
- 16.2.7.5. Financials (Based on Availability)
- 16.2.8 Yıldız Holding *List Not Exhaustive
- 16.2.8.1. Overview
- 16.2.8.2. Products
- 16.2.8.3. SWOT Analysis
- 16.2.8.4. Recent Developments
- 16.2.8.5. Financials (Based on Availability)
- 16.2.9 McKee Foods Corporation
- 16.2.9.1. Overview
- 16.2.9.2. Products
- 16.2.9.3. SWOT Analysis
- 16.2.9.4. Recent Developments
- 16.2.9.5. Financials (Based on Availability)
- 16.2.10 Britannia Industries Limited
- 16.2.10.1. Overview
- 16.2.10.2. Products
- 16.2.10.3. SWOT Analysis
- 16.2.10.4. Recent Developments
- 16.2.10.5. Financials (Based on Availability)
- 16.2.1 Grupo Bimbo S A B de C V
List of Figures
- Figure 1: Global Cake Industry Revenue Breakdown (Million, %) by Region 2024 & 2032
- Figure 2: Global Cake Industry Volume Breakdown (k unit, %) by Region 2024 & 2032
- Figure 3: North America Cake Industry Revenue (Million), by Country 2024 & 2032
- Figure 4: North America Cake Industry Volume (k unit), by Country 2024 & 2032
- Figure 5: North America Cake Industry Revenue Share (%), by Country 2024 & 2032
- Figure 6: North America Cake Industry Volume Share (%), by Country 2024 & 2032
- Figure 7: Europe Cake Industry Revenue (Million), by Country 2024 & 2032
- Figure 8: Europe Cake Industry Volume (k unit), by Country 2024 & 2032
- Figure 9: Europe Cake Industry Revenue Share (%), by Country 2024 & 2032
- Figure 10: Europe Cake Industry Volume Share (%), by Country 2024 & 2032
- Figure 11: Asia Pacific Cake Industry Revenue (Million), by Country 2024 & 2032
- Figure 12: Asia Pacific Cake Industry Volume (k unit), by Country 2024 & 2032
- Figure 13: Asia Pacific Cake Industry Revenue Share (%), by Country 2024 & 2032
- Figure 14: Asia Pacific Cake Industry Volume Share (%), by Country 2024 & 2032
- Figure 15: South America Cake Industry Revenue (Million), by Country 2024 & 2032
- Figure 16: South America Cake Industry Volume (k unit), by Country 2024 & 2032
- Figure 17: South America Cake Industry Revenue Share (%), by Country 2024 & 2032
- Figure 18: South America Cake Industry Volume Share (%), by Country 2024 & 2032
- Figure 19: Middle East and Africa Cake Industry Revenue (Million), by Country 2024 & 2032
- Figure 20: Middle East and Africa Cake Industry Volume (k unit), by Country 2024 & 2032
- Figure 21: Middle East and Africa Cake Industry Revenue Share (%), by Country 2024 & 2032
- Figure 22: Middle East and Africa Cake Industry Volume Share (%), by Country 2024 & 2032
- Figure 23: North America Cake Industry Revenue (Million), by Form 2024 & 2032
- Figure 24: North America Cake Industry Volume (k unit), by Form 2024 & 2032
- Figure 25: North America Cake Industry Revenue Share (%), by Form 2024 & 2032
- Figure 26: North America Cake Industry Volume Share (%), by Form 2024 & 2032
- Figure 27: North America Cake Industry Revenue (Million), by Product Type 2024 & 2032
- Figure 28: North America Cake Industry Volume (k unit), by Product Type 2024 & 2032
- Figure 29: North America Cake Industry Revenue Share (%), by Product Type 2024 & 2032
- Figure 30: North America Cake Industry Volume Share (%), by Product Type 2024 & 2032
- Figure 31: North America Cake Industry Revenue (Million), by Distribution Channel 2024 & 2032
- Figure 32: North America Cake Industry Volume (k unit), by Distribution Channel 2024 & 2032
- Figure 33: North America Cake Industry Revenue Share (%), by Distribution Channel 2024 & 2032
- Figure 34: North America Cake Industry Volume Share (%), by Distribution Channel 2024 & 2032
- Figure 35: North America Cake Industry Revenue (Million), by Country 2024 & 2032
- Figure 36: North America Cake Industry Volume (k unit), by Country 2024 & 2032
- Figure 37: North America Cake Industry Revenue Share (%), by Country 2024 & 2032
- Figure 38: North America Cake Industry Volume Share (%), by Country 2024 & 2032
- Figure 39: Europe Cake Industry Revenue (Million), by Form 2024 & 2032
- Figure 40: Europe Cake Industry Volume (k unit), by Form 2024 & 2032
- Figure 41: Europe Cake Industry Revenue Share (%), by Form 2024 & 2032
- Figure 42: Europe Cake Industry Volume Share (%), by Form 2024 & 2032
- Figure 43: Europe Cake Industry Revenue (Million), by Product Type 2024 & 2032
- Figure 44: Europe Cake Industry Volume (k unit), by Product Type 2024 & 2032
- Figure 45: Europe Cake Industry Revenue Share (%), by Product Type 2024 & 2032
- Figure 46: Europe Cake Industry Volume Share (%), by Product Type 2024 & 2032
- Figure 47: Europe Cake Industry Revenue (Million), by Distribution Channel 2024 & 2032
- Figure 48: Europe Cake Industry Volume (k unit), by Distribution Channel 2024 & 2032
- Figure 49: Europe Cake Industry Revenue Share (%), by Distribution Channel 2024 & 2032
- Figure 50: Europe Cake Industry Volume Share (%), by Distribution Channel 2024 & 2032
- Figure 51: Europe Cake Industry Revenue (Million), by Country 2024 & 2032
- Figure 52: Europe Cake Industry Volume (k unit), by Country 2024 & 2032
- Figure 53: Europe Cake Industry Revenue Share (%), by Country 2024 & 2032
- Figure 54: Europe Cake Industry Volume Share (%), by Country 2024 & 2032
- Figure 55: Asia Pacific Cake Industry Revenue (Million), by Form 2024 & 2032
- Figure 56: Asia Pacific Cake Industry Volume (k unit), by Form 2024 & 2032
- Figure 57: Asia Pacific Cake Industry Revenue Share (%), by Form 2024 & 2032
- Figure 58: Asia Pacific Cake Industry Volume Share (%), by Form 2024 & 2032
- Figure 59: Asia Pacific Cake Industry Revenue (Million), by Product Type 2024 & 2032
- Figure 60: Asia Pacific Cake Industry Volume (k unit), by Product Type 2024 & 2032
- Figure 61: Asia Pacific Cake Industry Revenue Share (%), by Product Type 2024 & 2032
- Figure 62: Asia Pacific Cake Industry Volume Share (%), by Product Type 2024 & 2032
- Figure 63: Asia Pacific Cake Industry Revenue (Million), by Distribution Channel 2024 & 2032
- Figure 64: Asia Pacific Cake Industry Volume (k unit), by Distribution Channel 2024 & 2032
- Figure 65: Asia Pacific Cake Industry Revenue Share (%), by Distribution Channel 2024 & 2032
- Figure 66: Asia Pacific Cake Industry Volume Share (%), by Distribution Channel 2024 & 2032
- Figure 67: Asia Pacific Cake Industry Revenue (Million), by Country 2024 & 2032
- Figure 68: Asia Pacific Cake Industry Volume (k unit), by Country 2024 & 2032
- Figure 69: Asia Pacific Cake Industry Revenue Share (%), by Country 2024 & 2032
- Figure 70: Asia Pacific Cake Industry Volume Share (%), by Country 2024 & 2032
- Figure 71: South America Cake Industry Revenue (Million), by Form 2024 & 2032
- Figure 72: South America Cake Industry Volume (k unit), by Form 2024 & 2032
- Figure 73: South America Cake Industry Revenue Share (%), by Form 2024 & 2032
- Figure 74: South America Cake Industry Volume Share (%), by Form 2024 & 2032
- Figure 75: South America Cake Industry Revenue (Million), by Product Type 2024 & 2032
- Figure 76: South America Cake Industry Volume (k unit), by Product Type 2024 & 2032
- Figure 77: South America Cake Industry Revenue Share (%), by Product Type 2024 & 2032
- Figure 78: South America Cake Industry Volume Share (%), by Product Type 2024 & 2032
- Figure 79: South America Cake Industry Revenue (Million), by Distribution Channel 2024 & 2032
- Figure 80: South America Cake Industry Volume (k unit), by Distribution Channel 2024 & 2032
- Figure 81: South America Cake Industry Revenue Share (%), by Distribution Channel 2024 & 2032
- Figure 82: South America Cake Industry Volume Share (%), by Distribution Channel 2024 & 2032
- Figure 83: South America Cake Industry Revenue (Million), by Country 2024 & 2032
- Figure 84: South America Cake Industry Volume (k unit), by Country 2024 & 2032
- Figure 85: South America Cake Industry Revenue Share (%), by Country 2024 & 2032
- Figure 86: South America Cake Industry Volume Share (%), by Country 2024 & 2032
- Figure 87: Middle East and Africa Cake Industry Revenue (Million), by Form 2024 & 2032
- Figure 88: Middle East and Africa Cake Industry Volume (k unit), by Form 2024 & 2032
- Figure 89: Middle East and Africa Cake Industry Revenue Share (%), by Form 2024 & 2032
- Figure 90: Middle East and Africa Cake Industry Volume Share (%), by Form 2024 & 2032
- Figure 91: Middle East and Africa Cake Industry Revenue (Million), by Product Type 2024 & 2032
- Figure 92: Middle East and Africa Cake Industry Volume (k unit), by Product Type 2024 & 2032
- Figure 93: Middle East and Africa Cake Industry Revenue Share (%), by Product Type 2024 & 2032
- Figure 94: Middle East and Africa Cake Industry Volume Share (%), by Product Type 2024 & 2032
- Figure 95: Middle East and Africa Cake Industry Revenue (Million), by Distribution Channel 2024 & 2032
- Figure 96: Middle East and Africa Cake Industry Volume (k unit), by Distribution Channel 2024 & 2032
- Figure 97: Middle East and Africa Cake Industry Revenue Share (%), by Distribution Channel 2024 & 2032
- Figure 98: Middle East and Africa Cake Industry Volume Share (%), by Distribution Channel 2024 & 2032
- Figure 99: Middle East and Africa Cake Industry Revenue (Million), by Country 2024 & 2032
- Figure 100: Middle East and Africa Cake Industry Volume (k unit), by Country 2024 & 2032
- Figure 101: Middle East and Africa Cake Industry Revenue Share (%), by Country 2024 & 2032
- Figure 102: Middle East and Africa Cake Industry Volume Share (%), by Country 2024 & 2032
List of Tables
- Table 1: Global Cake Industry Revenue Million Forecast, by Region 2019 & 2032
- Table 2: Global Cake Industry Volume k unit Forecast, by Region 2019 & 2032
- Table 3: Global Cake Industry Revenue Million Forecast, by Form 2019 & 2032
- Table 4: Global Cake Industry Volume k unit Forecast, by Form 2019 & 2032
- Table 5: Global Cake Industry Revenue Million Forecast, by Product Type 2019 & 2032
- Table 6: Global Cake Industry Volume k unit Forecast, by Product Type 2019 & 2032
- Table 7: Global Cake Industry Revenue Million Forecast, by Distribution Channel 2019 & 2032
- Table 8: Global Cake Industry Volume k unit Forecast, by Distribution Channel 2019 & 2032
- Table 9: Global Cake Industry Revenue Million Forecast, by Region 2019 & 2032
- Table 10: Global Cake Industry Volume k unit Forecast, by Region 2019 & 2032
- Table 11: Global Cake Industry Revenue Million Forecast, by Country 2019 & 2032
- Table 12: Global Cake Industry Volume k unit Forecast, by Country 2019 & 2032
- Table 13: United States Cake Industry Revenue (Million) Forecast, by Application 2019 & 2032
- Table 14: United States Cake Industry Volume (k unit) Forecast, by Application 2019 & 2032
- Table 15: Canada Cake Industry Revenue (Million) Forecast, by Application 2019 & 2032
- Table 16: Canada Cake Industry Volume (k unit) Forecast, by Application 2019 & 2032
- Table 17: Mexico Cake Industry Revenue (Million) Forecast, by Application 2019 & 2032
- Table 18: Mexico Cake Industry Volume (k unit) Forecast, by Application 2019 & 2032
- Table 19: Rest of North America Cake Industry Revenue (Million) Forecast, by Application 2019 & 2032
- Table 20: Rest of North America Cake Industry Volume (k unit) Forecast, by Application 2019 & 2032
- Table 21: Global Cake Industry Revenue Million Forecast, by Country 2019 & 2032
- Table 22: Global Cake Industry Volume k unit Forecast, by Country 2019 & 2032
- Table 23: Germany Cake Industry Revenue (Million) Forecast, by Application 2019 & 2032
- Table 24: Germany Cake Industry Volume (k unit) Forecast, by Application 2019 & 2032
- Table 25: United Kingdom Cake Industry Revenue (Million) Forecast, by Application 2019 & 2032
- Table 26: United Kingdom Cake Industry Volume (k unit) Forecast, by Application 2019 & 2032
- Table 27: France Cake Industry Revenue (Million) Forecast, by Application 2019 & 2032
- Table 28: France Cake Industry Volume (k unit) Forecast, by Application 2019 & 2032
- Table 29: Russia Cake Industry Revenue (Million) Forecast, by Application 2019 & 2032
- Table 30: Russia Cake Industry Volume (k unit) Forecast, by Application 2019 & 2032
- Table 31: Spain Cake Industry Revenue (Million) Forecast, by Application 2019 & 2032
- Table 32: Spain Cake Industry Volume (k unit) Forecast, by Application 2019 & 2032
- Table 33: Italy Cake Industry Revenue (Million) Forecast, by Application 2019 & 2032
- Table 34: Italy Cake Industry Volume (k unit) Forecast, by Application 2019 & 2032
- Table 35: Rest of Europe Cake Industry Revenue (Million) Forecast, by Application 2019 & 2032
- Table 36: Rest of Europe Cake Industry Volume (k unit) Forecast, by Application 2019 & 2032
- Table 37: Global Cake Industry Revenue Million Forecast, by Country 2019 & 2032
- Table 38: Global Cake Industry Volume k unit Forecast, by Country 2019 & 2032
- Table 39: China Cake Industry Revenue (Million) Forecast, by Application 2019 & 2032
- Table 40: China Cake Industry Volume (k unit) Forecast, by Application 2019 & 2032
- Table 41: Japan Cake Industry Revenue (Million) Forecast, by Application 2019 & 2032
- Table 42: Japan Cake Industry Volume (k unit) Forecast, by Application 2019 & 2032
- Table 43: India Cake Industry Revenue (Million) Forecast, by Application 2019 & 2032
- Table 44: India Cake Industry Volume (k unit) Forecast, by Application 2019 & 2032
- Table 45: Australia Cake Industry Revenue (Million) Forecast, by Application 2019 & 2032
- Table 46: Australia Cake Industry Volume (k unit) Forecast, by Application 2019 & 2032
- Table 47: Pakistan Cake Industry Revenue (Million) Forecast, by Application 2019 & 2032
- Table 48: Pakistan Cake Industry Volume (k unit) Forecast, by Application 2019 & 2032
- Table 49: Rest of Asia Pacific Cake Industry Revenue (Million) Forecast, by Application 2019 & 2032
- Table 50: Rest of Asia Pacific Cake Industry Volume (k unit) Forecast, by Application 2019 & 2032
- Table 51: Global Cake Industry Revenue Million Forecast, by Country 2019 & 2032
- Table 52: Global Cake Industry Volume k unit Forecast, by Country 2019 & 2032
- Table 53: Brazil Cake Industry Revenue (Million) Forecast, by Application 2019 & 2032
- Table 54: Brazil Cake Industry Volume (k unit) Forecast, by Application 2019 & 2032
- Table 55: Argentina Cake Industry Revenue (Million) Forecast, by Application 2019 & 2032
- Table 56: Argentina Cake Industry Volume (k unit) Forecast, by Application 2019 & 2032
- Table 57: Rest of South America Cake Industry Revenue (Million) Forecast, by Application 2019 & 2032
- Table 58: Rest of South America Cake Industry Volume (k unit) Forecast, by Application 2019 & 2032
- Table 59: Global Cake Industry Revenue Million Forecast, by Country 2019 & 2032
- Table 60: Global Cake Industry Volume k unit Forecast, by Country 2019 & 2032
- Table 61: South Africa Cake Industry Revenue (Million) Forecast, by Application 2019 & 2032
- Table 62: South Africa Cake Industry Volume (k unit) Forecast, by Application 2019 & 2032
- Table 63: Saudi Arabia Cake Industry Revenue (Million) Forecast, by Application 2019 & 2032
- Table 64: Saudi Arabia Cake Industry Volume (k unit) Forecast, by Application 2019 & 2032
- Table 65: Rest of Middle East and Africa Cake Industry Revenue (Million) Forecast, by Application 2019 & 2032
- Table 66: Rest of Middle East and Africa Cake Industry Volume (k unit) Forecast, by Application 2019 & 2032
- Table 67: Global Cake Industry Revenue Million Forecast, by Form 2019 & 2032
- Table 68: Global Cake Industry Volume k unit Forecast, by Form 2019 & 2032
- Table 69: Global Cake Industry Revenue Million Forecast, by Product Type 2019 & 2032
- Table 70: Global Cake Industry Volume k unit Forecast, by Product Type 2019 & 2032
- Table 71: Global Cake Industry Revenue Million Forecast, by Distribution Channel 2019 & 2032
- Table 72: Global Cake Industry Volume k unit Forecast, by Distribution Channel 2019 & 2032
- Table 73: Global Cake Industry Revenue Million Forecast, by Country 2019 & 2032
- Table 74: Global Cake Industry Volume k unit Forecast, by Country 2019 & 2032
- Table 75: United States Cake Industry Revenue (Million) Forecast, by Application 2019 & 2032
- Table 76: United States Cake Industry Volume (k unit) Forecast, by Application 2019 & 2032
- Table 77: Canada Cake Industry Revenue (Million) Forecast, by Application 2019 & 2032
- Table 78: Canada Cake Industry Volume (k unit) Forecast, by Application 2019 & 2032
- Table 79: Mexico Cake Industry Revenue (Million) Forecast, by Application 2019 & 2032
- Table 80: Mexico Cake Industry Volume (k unit) Forecast, by Application 2019 & 2032
- Table 81: Rest of North America Cake Industry Revenue (Million) Forecast, by Application 2019 & 2032
- Table 82: Rest of North America Cake Industry Volume (k unit) Forecast, by Application 2019 & 2032
- Table 83: Global Cake Industry Revenue Million Forecast, by Form 2019 & 2032
- Table 84: Global Cake Industry Volume k unit Forecast, by Form 2019 & 2032
- Table 85: Global Cake Industry Revenue Million Forecast, by Product Type 2019 & 2032
- Table 86: Global Cake Industry Volume k unit Forecast, by Product Type 2019 & 2032
- Table 87: Global Cake Industry Revenue Million Forecast, by Distribution Channel 2019 & 2032
- Table 88: Global Cake Industry Volume k unit Forecast, by Distribution Channel 2019 & 2032
- Table 89: Global Cake Industry Revenue Million Forecast, by Country 2019 & 2032
- Table 90: Global Cake Industry Volume k unit Forecast, by Country 2019 & 2032
- Table 91: Germany Cake Industry Revenue (Million) Forecast, by Application 2019 & 2032
- Table 92: Germany Cake Industry Volume (k unit) Forecast, by Application 2019 & 2032
- Table 93: United Kingdom Cake Industry Revenue (Million) Forecast, by Application 2019 & 2032
- Table 94: United Kingdom Cake Industry Volume (k unit) Forecast, by Application 2019 & 2032
- Table 95: France Cake Industry Revenue (Million) Forecast, by Application 2019 & 2032
- Table 96: France Cake Industry Volume (k unit) Forecast, by Application 2019 & 2032
- Table 97: Russia Cake Industry Revenue (Million) Forecast, by Application 2019 & 2032
- Table 98: Russia Cake Industry Volume (k unit) Forecast, by Application 2019 & 2032
- Table 99: Spain Cake Industry Revenue (Million) Forecast, by Application 2019 & 2032
- Table 100: Spain Cake Industry Volume (k unit) Forecast, by Application 2019 & 2032
- Table 101: Italy Cake Industry Revenue (Million) Forecast, by Application 2019 & 2032
- Table 102: Italy Cake Industry Volume (k unit) Forecast, by Application 2019 & 2032
- Table 103: Rest of Europe Cake Industry Revenue (Million) Forecast, by Application 2019 & 2032
- Table 104: Rest of Europe Cake Industry Volume (k unit) Forecast, by Application 2019 & 2032
- Table 105: Global Cake Industry Revenue Million Forecast, by Form 2019 & 2032
- Table 106: Global Cake Industry Volume k unit Forecast, by Form 2019 & 2032
- Table 107: Global Cake Industry Revenue Million Forecast, by Product Type 2019 & 2032
- Table 108: Global Cake Industry Volume k unit Forecast, by Product Type 2019 & 2032
- Table 109: Global Cake Industry Revenue Million Forecast, by Distribution Channel 2019 & 2032
- Table 110: Global Cake Industry Volume k unit Forecast, by Distribution Channel 2019 & 2032
- Table 111: Global Cake Industry Revenue Million Forecast, by Country 2019 & 2032
- Table 112: Global Cake Industry Volume k unit Forecast, by Country 2019 & 2032
- Table 113: China Cake Industry Revenue (Million) Forecast, by Application 2019 & 2032
- Table 114: China Cake Industry Volume (k unit) Forecast, by Application 2019 & 2032
- Table 115: Japan Cake Industry Revenue (Million) Forecast, by Application 2019 & 2032
- Table 116: Japan Cake Industry Volume (k unit) Forecast, by Application 2019 & 2032
- Table 117: India Cake Industry Revenue (Million) Forecast, by Application 2019 & 2032
- Table 118: India Cake Industry Volume (k unit) Forecast, by Application 2019 & 2032
- Table 119: Australia Cake Industry Revenue (Million) Forecast, by Application 2019 & 2032
- Table 120: Australia Cake Industry Volume (k unit) Forecast, by Application 2019 & 2032
- Table 121: Pakistan Cake Industry Revenue (Million) Forecast, by Application 2019 & 2032
- Table 122: Pakistan Cake Industry Volume (k unit) Forecast, by Application 2019 & 2032
- Table 123: Rest of Asia Pacific Cake Industry Revenue (Million) Forecast, by Application 2019 & 2032
- Table 124: Rest of Asia Pacific Cake Industry Volume (k unit) Forecast, by Application 2019 & 2032
- Table 125: Global Cake Industry Revenue Million Forecast, by Form 2019 & 2032
- Table 126: Global Cake Industry Volume k unit Forecast, by Form 2019 & 2032
- Table 127: Global Cake Industry Revenue Million Forecast, by Product Type 2019 & 2032
- Table 128: Global Cake Industry Volume k unit Forecast, by Product Type 2019 & 2032
- Table 129: Global Cake Industry Revenue Million Forecast, by Distribution Channel 2019 & 2032
- Table 130: Global Cake Industry Volume k unit Forecast, by Distribution Channel 2019 & 2032
- Table 131: Global Cake Industry Revenue Million Forecast, by Country 2019 & 2032
- Table 132: Global Cake Industry Volume k unit Forecast, by Country 2019 & 2032
- Table 133: Brazil Cake Industry Revenue (Million) Forecast, by Application 2019 & 2032
- Table 134: Brazil Cake Industry Volume (k unit) Forecast, by Application 2019 & 2032
- Table 135: Argentina Cake Industry Revenue (Million) Forecast, by Application 2019 & 2032
- Table 136: Argentina Cake Industry Volume (k unit) Forecast, by Application 2019 & 2032
- Table 137: Rest of South America Cake Industry Revenue (Million) Forecast, by Application 2019 & 2032
- Table 138: Rest of South America Cake Industry Volume (k unit) Forecast, by Application 2019 & 2032
- Table 139: Global Cake Industry Revenue Million Forecast, by Form 2019 & 2032
- Table 140: Global Cake Industry Volume k unit Forecast, by Form 2019 & 2032
- Table 141: Global Cake Industry Revenue Million Forecast, by Product Type 2019 & 2032
- Table 142: Global Cake Industry Volume k unit Forecast, by Product Type 2019 & 2032
- Table 143: Global Cake Industry Revenue Million Forecast, by Distribution Channel 2019 & 2032
- Table 144: Global Cake Industry Volume k unit Forecast, by Distribution Channel 2019 & 2032
- Table 145: Global Cake Industry Revenue Million Forecast, by Country 2019 & 2032
- Table 146: Global Cake Industry Volume k unit Forecast, by Country 2019 & 2032
- Table 147: South Africa Cake Industry Revenue (Million) Forecast, by Application 2019 & 2032
- Table 148: South Africa Cake Industry Volume (k unit) Forecast, by Application 2019 & 2032
- Table 149: Saudi Arabia Cake Industry Revenue (Million) Forecast, by Application 2019 & 2032
- Table 150: Saudi Arabia Cake Industry Volume (k unit) Forecast, by Application 2019 & 2032
- Table 151: Rest of Middle East and Africa Cake Industry Revenue (Million) Forecast, by Application 2019 & 2032
- Table 152: Rest of Middle East and Africa Cake Industry Volume (k unit) Forecast, by Application 2019 & 2032
Frequently Asked Questions
1. What is the projected Compound Annual Growth Rate (CAGR) of the Cake Industry?
The projected CAGR is approximately 4.03%.
2. Which companies are prominent players in the Cake Industry?
Key companies in the market include Grupo Bimbo S A B de C V, DoFreeze LLC, Valeo Foods Group, The J M Smucker Company, Monginis Foods Private Limited, Flowers Foods Inc, Bonn Group of Industries, Yıldız Holding *List Not Exhaustive, McKee Foods Corporation, Britannia Industries Limited.
3. What are the main segments of the Cake Industry?
The market segments include Form, Product Type, Distribution Channel.
4. Can you provide details about the market size?
The market size is estimated to be USD 97.96 Million as of 2022.
5. What are some drivers contributing to market growth?
Increase in Number Of Social Event Celebration; Innovations In Designs And Flavors.
6. What are the notable trends driving market growth?
Increase in Number Of Social Event Celebration.
7. Are there any restraints impacting market growth?
Health Concerns Related To Ingredients.
8. Can you provide examples of recent developments in the market?
March 2024: The Hostess brand expanded its product portfolio by launching Hostess Meltamors, a soft, fluffy mini-cake with a delightful chocolate-flavored drizzle and a chocolatey- or caramel-flavored melting center that flows like "lava" when warmed in the microwave.
9. What pricing options are available for accessing the report?
Pricing options include single-user, multi-user, and enterprise licenses priced at USD 4750, USD 5250, and USD 8750 respectively.
10. Is the market size provided in terms of value or volume?
The market size is provided in terms of value, measured in Million and volume, measured in k unit.
11. Are there any specific market keywords associated with the report?
Yes, the market keyword associated with the report is "Cake Industry," which aids in identifying and referencing the specific market segment covered.
12. How do I determine which pricing option suits my needs best?
The pricing options vary based on user requirements and access needs. Individual users may opt for single-user licenses, while businesses requiring broader access may choose multi-user or enterprise licenses for cost-effective access to the report.
13. Are there any additional resources or data provided in the Cake Industry report?
While the report offers comprehensive insights, it's advisable to review the specific contents or supplementary materials provided to ascertain if additional resources or data are available.
14. How can I stay updated on further developments or reports in the Cake Industry?
To stay informed about further developments, trends, and reports in the Cake Industry, consider subscribing to industry newsletters, following relevant companies and organizations, or regularly checking reputable industry news sources and publications.
Methodology
Step 1 - Identification of Relevant Samples Size from Population Database


Step 2 - Approaches for Defining Global Market Size (Value, Volume* & Price*)

Note*: In applicable scenarios
Step 3 - Data Sources
Primary Research
- Web Analytics
- Survey Reports
- Research Institute
- Latest Research Reports
- Opinion Leaders
Secondary Research
- Annual Reports
- White Paper
- Latest Press Release
- Industry Association
- Paid Database
- Investor Presentations

Step 4 - Data Triangulation
Involves using different sources of information in order to increase the validity of a study
These sources are likely to be stakeholders in a program - participants, other researchers, program staff, other community members, and so on.
Then we put all data in single framework & apply various statistical tools to find out the dynamic on the market.
During the analysis stage, feedback from the stakeholder groups would be compared to determine areas of agreement as well as areas of divergence


