

Key Insights
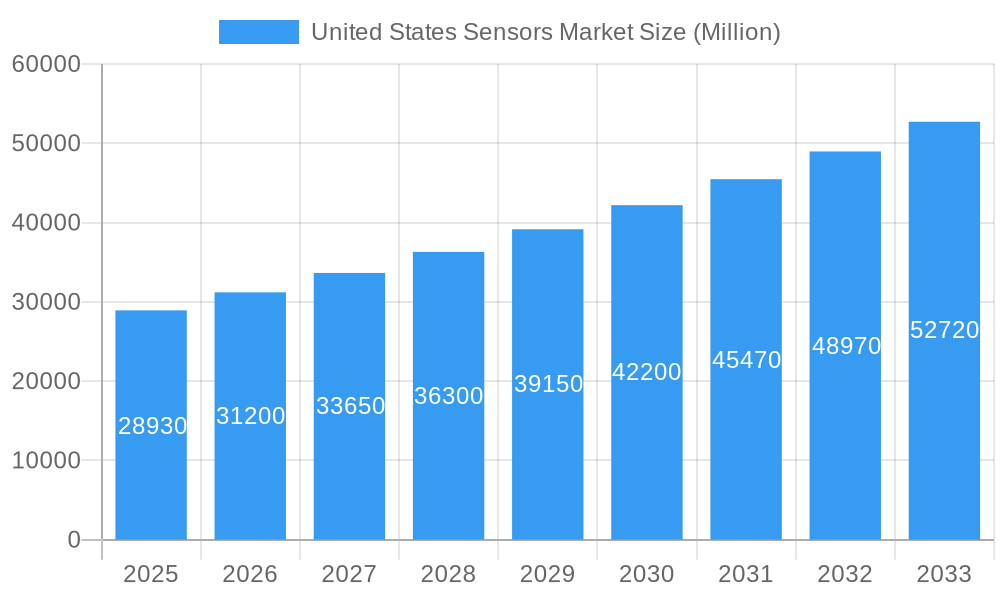
The United States sensors market, valued at $28.93 billion in 2025, is projected to experience robust growth, driven by increasing automation across various industries, the expanding Internet of Things (IoT) ecosystem, and the rising demand for advanced sensor technologies in automotive, healthcare, and industrial applications. The market's Compound Annual Growth Rate (CAGR) of 7.79% from 2019 to 2024 suggests a strong upward trajectory, indicating a significant increase in sensor adoption across diverse sectors. This growth is fueled by technological advancements leading to smaller, more energy-efficient, and cost-effective sensors with enhanced capabilities. The demand for accurate and reliable data collection is driving the integration of sensors in smart homes, wearables, industrial automation systems, and precision agriculture, further boosting market expansion.
United States Sensors Market Market Size (In Billion)
Looking ahead to 2033, the continued integration of sensors within the broader technological landscape, particularly within smart city initiatives, advanced manufacturing processes, and autonomous vehicle development, points to continued market expansion. While challenges like data security concerns and the need for robust sensor calibration and maintenance exist, the overall market outlook remains positive. Key players like Texas Instruments, STMicroelectronics, and Honeywell are strategically investing in R&D and expanding their product portfolios to capitalize on emerging opportunities, further consolidating market dominance and fostering competition. The diverse segments within the US sensors market, encompassing various sensor types and applications, contribute to its overall resilience and diverse growth potential.
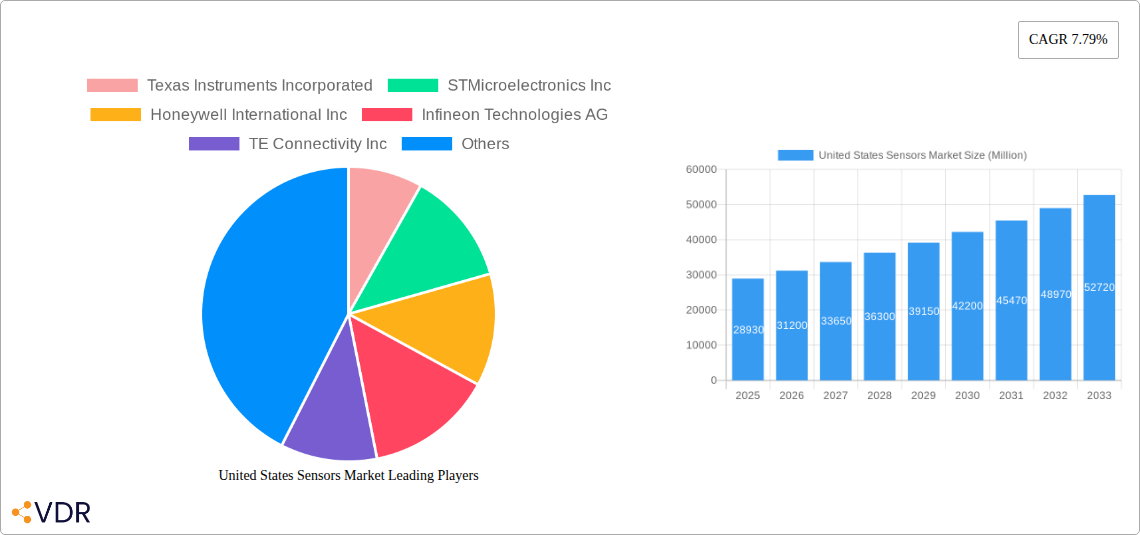
United States Sensors Market Company Market Share
United States Sensors Market: A Comprehensive Report (2019-2033)
This in-depth report provides a comprehensive analysis of the United States sensors market, encompassing market dynamics, growth trends, key players, and future outlook. The study period covers 2019-2033, with 2025 serving as the base and estimated year. The report delves into various segments within the broader sensors market, offering granular insights to industry professionals. The market size is projected to reach xx Million units by 2033.
United States Sensors Market Market Dynamics & Structure
The US sensors market exhibits a moderately concentrated structure, with key players like Texas Instruments Incorporated, STMicroelectronics Inc, and Honeywell International Inc holding significant market share. Technological innovation, particularly in areas like IoT, AI, and autonomous systems, is a primary growth driver. Stringent regulatory frameworks, especially concerning data privacy and safety standards, influence market development. Competitive pressures from substitute technologies and the rise of new entrants are also noteworthy. Mergers and acquisitions (M&A) activity is expected to remain robust, further shaping the market landscape.
- Market Concentration: Moderately concentrated, with top 5 players holding approximately xx% market share (2024).
- Technological Innovation: Strong focus on miniaturization, improved accuracy, enhanced power efficiency, and integration with smart technologies.
- Regulatory Landscape: Compliance with safety and data privacy regulations is crucial, impacting product development and deployment.
- Competitive Substitutes: Emerging technologies like optical sensors and MEMS devices pose competitive threats.
- End-User Demographics: Significant demand from automotive, healthcare, industrial automation, and consumer electronics sectors.
- M&A Trends: Moderate level of M&A activity driven by strategic expansion and technology acquisition.
United States Sensors Market Growth Trends & Insights
The US sensors market has demonstrated consistent growth throughout the historical period (2019-2024), exhibiting a Compound Annual Growth Rate (CAGR) of xx%. This growth is fueled by increasing adoption across diverse industries, driven by factors such as automation, digitization, and the expansion of the Internet of Things (IoT). Technological disruptions, including the emergence of advanced sensor technologies (e.g., LiDAR, MEMS), are reshaping the market landscape. Consumer behavior shifts toward smart devices and connected homes further contribute to market expansion. Market penetration is expected to increase significantly over the forecast period (2025-2033), reaching xx% by 2033.
Dominant Regions, Countries, or Segments in United States Sensors Market
California, Texas, and Massachusetts are leading regions within the US sensors market, exhibiting robust growth driven by strong technological innovation clusters, presence of major sensor manufacturers, and high demand from key end-use industries such as aerospace, automotive, and healthcare. The automotive sector currently represents the largest segment of the US sensors market, driven by the increasing adoption of advanced driver-assistance systems (ADAS) and autonomous vehicles.
- Key Drivers:
- Strong technological innovation ecosystems: Presence of leading research institutions and technology companies.
- High concentration of key players: Significant manufacturing capacity and R&D investment.
- Robust end-user demand: High growth in automotive, healthcare, and industrial automation.
- Favorable government policies: Incentives for technological advancement and infrastructure development.
United States Sensors Market Product Landscape
The US sensors market offers a diverse range of products, including pressure sensors, temperature sensors, proximity sensors, accelerometers, gyroscopes, and image sensors, each catering to various applications and requirements. Recent product innovations focus on enhanced accuracy, miniaturization, wireless connectivity, and improved power efficiency. Technological advancements such as MEMS technology and the integration of AI capabilities are driving the development of sophisticated and intelligent sensors. Unique selling propositions frequently include improved accuracy, extended lifespan, and reduced power consumption, creating a competitive landscape with significant diversity in both design and application.
Key Drivers, Barriers & Challenges in United States Sensors Market
Key Drivers:
- Increasing automation across industries.
- Growth of the IoT and connected devices.
- Advancements in sensor technology (e.g., LiDAR, MEMS).
- Government initiatives promoting technological advancement.
Challenges & Restraints:
- High initial investment costs for advanced sensor technologies.
- Supply chain disruptions impacting the availability of raw materials.
- Stringent regulatory requirements and safety standards.
- Intense competition among established and emerging players. This competition can lead to price pressures and reduced profit margins.
Emerging Opportunities in United States Sensors Market
Emerging opportunities include the integration of sensors with AI and machine learning for enhanced data analytics and decision-making; expansion into untapped markets like precision agriculture and smart cities; and growth in demand for high-performance sensors in applications like autonomous vehicles and robotics.
Growth Accelerators in the United States Sensors Market Industry
Long-term growth will be driven by technological breakthroughs leading to more efficient, accurate, and affordable sensors; strategic partnerships between sensor manufacturers and system integrators; and market expansion into new applications, particularly in sectors experiencing rapid digitization.
Key Players Shaping the United States Sensors Market Market
- Texas Instruments Incorporated (Texas Instruments)
- STMicroelectronics Inc (STMicroelectronics)
- Honeywell International Inc (Honeywell)
- Infineon Technologies AG (Infineon)
- TE Connectivity Inc (TE Connectivity)
- Rockwell Automation Inc (Rockwell Automation)
- Bosch Sensortec GmbH (Bosch Sensortec)
- Omega Engineering Inc (Omega Engineering)
- Siemens AG (Siemens)
- ams OSRAM AG (ams OSRAM)
- Sick AG (Sick)
- ABB Limited (ABB)
- Omron Corporation (Omron)
- Allegro MicroSystems Inc (Allegro MicroSystems)
Notable Milestones in United States Sensors Market Sector
- April 2024: TE Connectivity launches two advanced wireless pressure sensors (65xxN and 69xxN) for periodic condition monitoring, leveraging BLE 5.3 technology. This expansion significantly broadens TE Connectivity's reach in the condition monitoring market and underscores the trend towards wireless sensing solutions.
- February 2024: STMicroelectronics unveils a market-leading 2.3k resolution dToF 3D LiDAR module and secures a design win for a 500k-pixel iToF sensor, showcasing advancements in 3D sensing technology and demonstrating strong market demand for high-resolution LiDAR solutions.
In-Depth United States Sensors Market Market Outlook
The future of the US sensors market is bright, driven by continued technological advancements, increasing adoption across diverse sectors, and expansion into new applications. Strategic opportunities lie in developing innovative sensor solutions tailored to specific industry needs, leveraging AI and machine learning for data analytics, and forging strategic partnerships to expand market reach and penetration. The market's long-term growth potential remains substantial, promising significant returns for investors and driving innovation across various industries.
United States Sensors Market Segmentation
-
1. Product Type
- 1.1. Temperature
- 1.2. Pressure
- 1.3. Level
- 1.4. Flow
- 1.5. Proximity
- 1.6. Environmental (Humidity, Gas and Combos)
- 1.7. Chemical
- 1.8. Inertial
-
1.9. Magnetic
- 1.9.1. Hall effect sensors
- 1.9.2. Other Magnetic Sensors
- 1.10. Position Sensors
- 1.11. Current Sensors
- 1.12. Other Types
-
2. Mode of Operation
- 2.1. Optical
- 2.2. Electrical Resistance
- 2.3. Biosensor
- 2.4. Piezoresistive
- 2.5. Image
- 2.6. Capacitive
- 2.7. Piezoelectric
- 2.8. LiDAR
- 2.9. Radar
- 2.10. Other Modes of Operations
-
3. End-user Industry
- 3.1. Automotive
- 3.2. Consumer Electronics
- 3.3. Energy
- 3.4. Industrial and Other
- 3.5. Medical and Wellness
- 3.6. Construction, Agriculture and Mining
- 3.7. Aerospace
- 3.8. Robotics
- 3.9. Other End-user Industries
United States Sensors Market Segmentation By Geography
- 1. United States
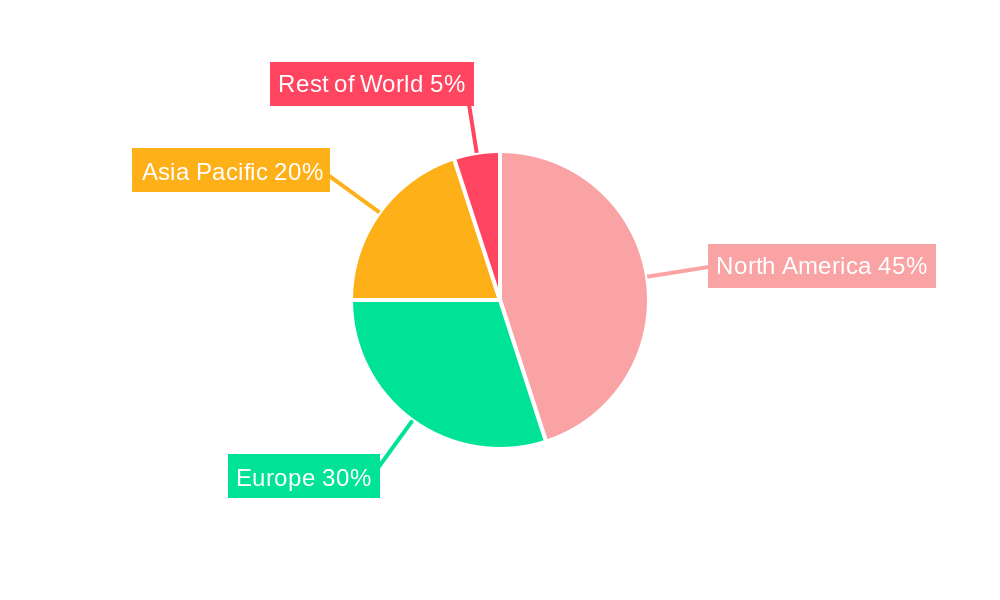
United States Sensors Market Regional Market Share
Geographic Coverage of United States Sensors Market
United States Sensors Market REPORT HIGHLIGHTS
| Aspects | Details |
|---|---|
| Study Period | 2020-2034 |
| Base Year | 2025 |
| Estimated Year | 2026 |
| Forecast Period | 2026-2034 |
| Historical Period | 2020-2025 |
| Growth Rate | CAGR of 7.79% from 2020-2034 |
| Segmentation |
|
Table of Contents
- 1. Introduction
- 1.1. Research Scope
- 1.2. Market Segmentation
- 1.3. Research Objective
- 1.4. Definitions and Assumptions
- 2. Executive Summary
- 2.1. Market Snapshot
- 3. Market Dynamics
- 3.1. Market Drivers
- 3.2. Market Restrains
- 3.3. Market Trends
- 3.4. Market Opportunities
- 4. Market Factor Analysis
- 4.1. Porters Five Forces
- 4.1.1. Bargaining Power of Suppliers
- 4.1.2. Bargaining Power of Buyers
- 4.1.3. Threat of New Entrants
- 4.1.4. Threat of Substitutes
- 4.1.5. Competitive Rivalry
- 4.2. PESTEL analysis
- 4.3. BCG Analysis
- 4.3.1. Stars (High Growth, High Market Share)
- 4.3.2. Cash Cows (Low Growth, High Market Share)
- 4.3.3. Question Mark (High Growth, Low Market Share)
- 4.3.4. Dogs (Low Growth, Low Market Share)
- 4.4. Ansoff Matrix Analysis
- 4.5. Supply Chain Analysis
- 4.6. Regulatory Landscape
- 4.7. Current Market Potential and Opportunity Assessment (TAM–SAM–SOM Framework)
- 4.8. VDR Analyst Note
- 4.1. Porters Five Forces
- 5. Market Analysis, Insights and Forecast 2021-2033
- 5.1. Market Analysis, Insights and Forecast - by Product Type
- 5.1.1. Temperature
- 5.1.2. Pressure
- 5.1.3. Level
- 5.1.4. Flow
- 5.1.5. Proximity
- 5.1.6. Environmental (Humidity, Gas and Combos)
- 5.1.7. Chemical
- 5.1.8. Inertial
- 5.1.9. Magnetic
- 5.1.9.1. Hall effect sensors
- 5.1.9.2. Other Magnetic Sensors
- 5.1.10. Position Sensors
- 5.1.11. Current Sensors
- 5.1.12. Other Types
- 5.2. Market Analysis, Insights and Forecast - by Mode of Operation
- 5.2.1. Optical
- 5.2.2. Electrical Resistance
- 5.2.3. Biosensor
- 5.2.4. Piezoresistive
- 5.2.5. Image
- 5.2.6. Capacitive
- 5.2.7. Piezoelectric
- 5.2.8. LiDAR
- 5.2.9. Radar
- 5.2.10. Other Modes of Operations
- 5.3. Market Analysis, Insights and Forecast - by End-user Industry
- 5.3.1. Automotive
- 5.3.2. Consumer Electronics
- 5.3.3. Energy
- 5.3.4. Industrial and Other
- 5.3.5. Medical and Wellness
- 5.3.6. Construction, Agriculture and Mining
- 5.3.7. Aerospace
- 5.3.8. Robotics
- 5.3.9. Other End-user Industries
- 5.4. Market Analysis, Insights and Forecast - by Region
- 5.4.1. United States
- 5.1. Market Analysis, Insights and Forecast - by Product Type
- 6. United States Sensors Market Analysis, Insights and Forecast, 2021-2033
- 6.1. Market Analysis, Insights and Forecast - by Product Type
- 6.1.1. Temperature
- 6.1.2. Pressure
- 6.1.3. Level
- 6.1.4. Flow
- 6.1.5. Proximity
- 6.1.6. Environmental (Humidity, Gas and Combos)
- 6.1.7. Chemical
- 6.1.8. Inertial
- 6.1.9. Magnetic
- 6.1.9.1. Hall effect sensors
- 6.1.9.2. Other Magnetic Sensors
- 6.1.10. Position Sensors
- 6.1.11. Current Sensors
- 6.1.12. Other Types
- 6.2. Market Analysis, Insights and Forecast - by Mode of Operation
- 6.2.1. Optical
- 6.2.2. Electrical Resistance
- 6.2.3. Biosensor
- 6.2.4. Piezoresistive
- 6.2.5. Image
- 6.2.6. Capacitive
- 6.2.7. Piezoelectric
- 6.2.8. LiDAR
- 6.2.9. Radar
- 6.2.10. Other Modes of Operations
- 6.3. Market Analysis, Insights and Forecast - by End-user Industry
- 6.3.1. Automotive
- 6.3.2. Consumer Electronics
- 6.3.3. Energy
- 6.3.4. Industrial and Other
- 6.3.5. Medical and Wellness
- 6.3.6. Construction, Agriculture and Mining
- 6.3.7. Aerospace
- 6.3.8. Robotics
- 6.3.9. Other End-user Industries
- 6.1. Market Analysis, Insights and Forecast - by Product Type
- 7. Competitive Analysis
- 7.1. Company Profiles
- 7.1.1 Texas Instruments Incorporated
- 7.1.1.1. Company Overview
- 7.1.1.2. Products
- 7.1.1.3. Company Financials
- 7.1.1.4. SWOT Analysis
- 7.1.2 STMicroelectronics Inc
- 7.1.2.1. Company Overview
- 7.1.2.2. Products
- 7.1.2.3. Company Financials
- 7.1.2.4. SWOT Analysis
- 7.1.3 Honeywell International Inc
- 7.1.3.1. Company Overview
- 7.1.3.2. Products
- 7.1.3.3. Company Financials
- 7.1.3.4. SWOT Analysis
- 7.1.4 Infineon Technologies AG
- 7.1.4.1. Company Overview
- 7.1.4.2. Products
- 7.1.4.3. Company Financials
- 7.1.4.4. SWOT Analysis
- 7.1.5 TE Connectivity Inc
- 7.1.5.1. Company Overview
- 7.1.5.2. Products
- 7.1.5.3. Company Financials
- 7.1.5.4. SWOT Analysis
- 7.1.6 Rockwell Automation Inc
- 7.1.6.1. Company Overview
- 7.1.6.2. Products
- 7.1.6.3. Company Financials
- 7.1.6.4. SWOT Analysis
- 7.1.7 Bosch Sensortec GmbH
- 7.1.7.1. Company Overview
- 7.1.7.2. Products
- 7.1.7.3. Company Financials
- 7.1.7.4. SWOT Analysis
- 7.1.8 Omega Engineering Inc
- 7.1.8.1. Company Overview
- 7.1.8.2. Products
- 7.1.8.3. Company Financials
- 7.1.8.4. SWOT Analysis
- 7.1.9 Siemens AG
- 7.1.9.1. Company Overview
- 7.1.9.2. Products
- 7.1.9.3. Company Financials
- 7.1.9.4. SWOT Analysis
- 7.1.10 ams OSRAM AG
- 7.1.10.1. Company Overview
- 7.1.10.2. Products
- 7.1.10.3. Company Financials
- 7.1.10.4. SWOT Analysis
- 7.1.11 Sick AG
- 7.1.11.1. Company Overview
- 7.1.11.2. Products
- 7.1.11.3. Company Financials
- 7.1.11.4. SWOT Analysis
- 7.1.12 ABB Limited
- 7.1.12.1. Company Overview
- 7.1.12.2. Products
- 7.1.12.3. Company Financials
- 7.1.12.4. SWOT Analysis
- 7.1.13 Omron Corporation
- 7.1.13.1. Company Overview
- 7.1.13.2. Products
- 7.1.13.3. Company Financials
- 7.1.13.4. SWOT Analysis
- 7.1.14 Allegro MicroSystems Inc
- 7.1.14.1. Company Overview
- 7.1.14.2. Products
- 7.1.14.3. Company Financials
- 7.1.14.4. SWOT Analysis
- 7.1.1 Texas Instruments Incorporated
- 7.2. Market Entropy
- 7.2.1 Company's Key Areas Served
- 7.2.2 Recent Developments
- 7.3. Company Market Share Analysis 2025
- 7.3.1 Top 5 Companies Market Share Analysis
- 7.3.2 Top 3 Companies Market Share Analysis
- 7.4. List of Potential Customers
- 8. Research Methodology
List of Figures
- Figure 1: United States Sensors Market Revenue Breakdown (Million, %) by Product 2025 & 2033
- Figure 2: United States Sensors Market Share (%) by Company 2025
List of Tables
- Table 1: United States Sensors Market Revenue Million Forecast, by Product Type 2020 & 2033
- Table 2: United States Sensors Market Volume Billion Forecast, by Product Type 2020 & 2033
- Table 3: United States Sensors Market Revenue Million Forecast, by Mode of Operation 2020 & 2033
- Table 4: United States Sensors Market Volume Billion Forecast, by Mode of Operation 2020 & 2033
- Table 5: United States Sensors Market Revenue Million Forecast, by End-user Industry 2020 & 2033
- Table 6: United States Sensors Market Volume Billion Forecast, by End-user Industry 2020 & 2033
- Table 7: United States Sensors Market Revenue Million Forecast, by Region 2020 & 2033
- Table 8: United States Sensors Market Volume Billion Forecast, by Region 2020 & 2033
- Table 9: United States Sensors Market Revenue Million Forecast, by Product Type 2020 & 2033
- Table 10: United States Sensors Market Volume Billion Forecast, by Product Type 2020 & 2033
- Table 11: United States Sensors Market Revenue Million Forecast, by Mode of Operation 2020 & 2033
- Table 12: United States Sensors Market Volume Billion Forecast, by Mode of Operation 2020 & 2033
- Table 13: United States Sensors Market Revenue Million Forecast, by End-user Industry 2020 & 2033
- Table 14: United States Sensors Market Volume Billion Forecast, by End-user Industry 2020 & 2033
- Table 15: United States Sensors Market Revenue Million Forecast, by Country 2020 & 2033
- Table 16: United States Sensors Market Volume Billion Forecast, by Country 2020 & 2033
Frequently Asked Questions
1. What is the projected Compound Annual Growth Rate (CAGR) of the United States Sensors Market?
The projected CAGR is approximately 7.79%.
2. Which companies are prominent players in the United States Sensors Market?
Key companies in the market include Texas Instruments Incorporated, STMicroelectronics Inc, Honeywell International Inc, Infineon Technologies AG, TE Connectivity Inc, Rockwell Automation Inc, Bosch Sensortec GmbH, Omega Engineering Inc, Siemens AG, ams OSRAM AG, Sick AG, ABB Limited, Omron Corporation, Allegro MicroSystems Inc.
3. What are the main segments of the United States Sensors Market?
The market segments include Product Type, Mode of Operation, End-user Industry.
4. Can you provide details about the market size?
The market size is estimated to be USD 28.93 Million as of 2022.
5. What are some drivers contributing to market growth?
Rising Demand for IoT and Connected Devices; Increasing Adoption of Advanced Sensor Technologies in Automotive Industry.
6. What are the notable trends driving market growth?
Environmental Sensors is Expected to Witness a Significant Growth.
7. Are there any restraints impacting market growth?
Rising Demand for IoT and Connected Devices; Increasing Adoption of Advanced Sensor Technologies in Automotive Industry.
8. Can you provide examples of recent developments in the market?
April 2024: TE Connectivity (TE) has expanded its product line by introducing two advanced wireless pressure sensors. The first, the 65xxN sensor, is tailored for short-range applications, while the second, the 69xxN sensor, is optimized for long-range coverage. Both sensors are crafted explicitly for periodic condition monitoring. Notably, the 65xxN sensor utilizes BLE (Bluetooth Low Energy) 5.3 technology, enabling seamless localized data collection and transmission. The 65xxN wireless pressure sensor leverages BLE technology for efficient battery performance and adaptability across diverse pressure conditions.
9. What pricing options are available for accessing the report?
Pricing options include single-user, multi-user, and enterprise licenses priced at USD 3800, USD 4500, and USD 5800 respectively.
10. Is the market size provided in terms of value or volume?
The market size is provided in terms of value, measured in Million and volume, measured in Billion.
11. Are there any specific market keywords associated with the report?
Yes, the market keyword associated with the report is "United States Sensors Market," which aids in identifying and referencing the specific market segment covered.
12. How do I determine which pricing option suits my needs best?
The pricing options vary based on user requirements and access needs. Individual users may opt for single-user licenses, while businesses requiring broader access may choose multi-user or enterprise licenses for cost-effective access to the report.
13. Are there any additional resources or data provided in the United States Sensors Market report?
While the report offers comprehensive insights, it's advisable to review the specific contents or supplementary materials provided to ascertain if additional resources or data are available.
14. How can I stay updated on further developments or reports in the United States Sensors Market?
To stay informed about further developments, trends, and reports in the United States Sensors Market, consider subscribing to industry newsletters, following relevant companies and organizations, or regularly checking reputable industry news sources and publications.
Methodology
Step 1 - Identification of Relevant Samples Size from Population Database


Step 2 - Approaches for Defining Global Market Size (Value, Volume* & Price*)

Note*: In applicable scenarios
Step 3 - Data Sources
Primary Research
- Web Analytics
- Survey Reports
- Research Institute
- Latest Research Reports
- Opinion Leaders
Secondary Research
- Annual Reports
- White Paper
- Latest Press Release
- Industry Association
- Paid Database
- Investor Presentations

Step 4 - Data Triangulation
Involves using different sources of information in order to increase the validity of a study
These sources are likely to be stakeholders in a program - participants, other researchers, program staff, other community members, and so on.
Then we put all data in single framework & apply various statistical tools to find out the dynamic on the market.
During the analysis stage, feedback from the stakeholder groups would be compared to determine areas of agreement as well as areas of divergence