

Key Insights
The System in Package (SiP) technology market is experiencing significant expansion, propelled by the escalating demand for compact, high-performance electronic devices across numerous industries. The market is projected to reach $11.88 billion by 2025, with a Compound Annual Growth Rate (CAGR) of 6.8% from 2025-2033. Key growth drivers include the increasing integration of SiP in consumer electronics, advanced telecommunications (including 5G), and automotive applications. Innovations in advanced packaging, such as 3D/5D ICs and fan-out wafer-level packaging, are further accelerating market development. Despite design complexities and high initial investment, continuous semiconductor innovation and the demand for sophisticated electronic systems ensure a positive market outlook. Power Management Integrated Circuits (PMICs) and application processors lead in device segmentation, while consumer electronics and telecommunications dominate application areas. The Asia-Pacific region, driven by its robust manufacturing capabilities, is a significant growth hub, with North America and Europe also showing strong demand.
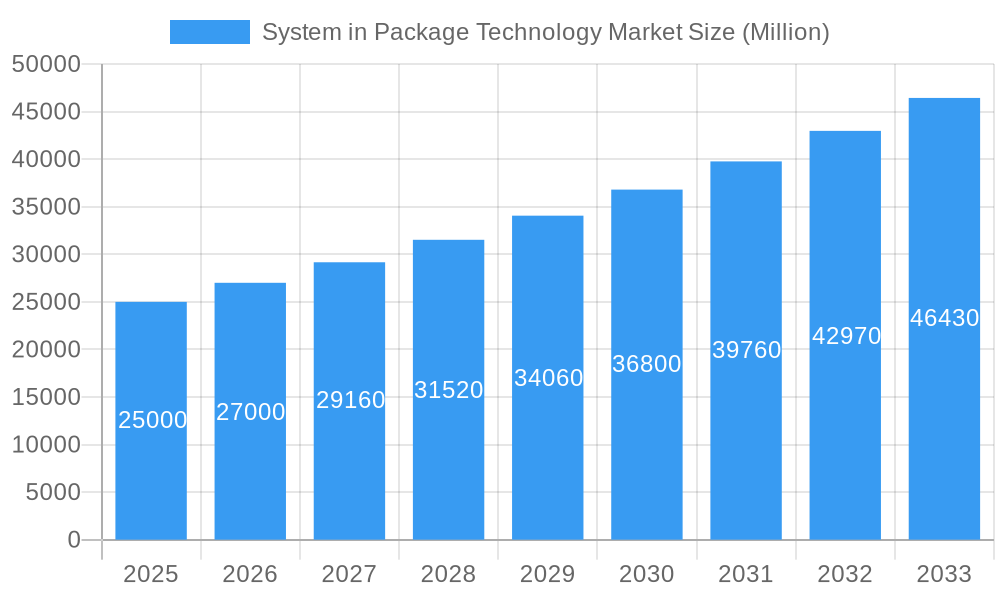
System in Package Technology Market Market Size (In Billion)
The forecast period (2025-2033) anticipates sustained growth, potentially surpassing previous CAGR projections due to the maturation of 5G and the expanding adoption of SiP in emerging IoT and AI applications. The competitive arena features established semiconductor giants and specialized packaging firms collaborating and innovating to enhance packaging density, thermal management, and cost-effectiveness. Market consolidation is expected as companies seek economies of scale and comprehensive SiP solutions. Ongoing R&D in advanced materials and processes will be crucial for achieving further miniaturization and performance gains.
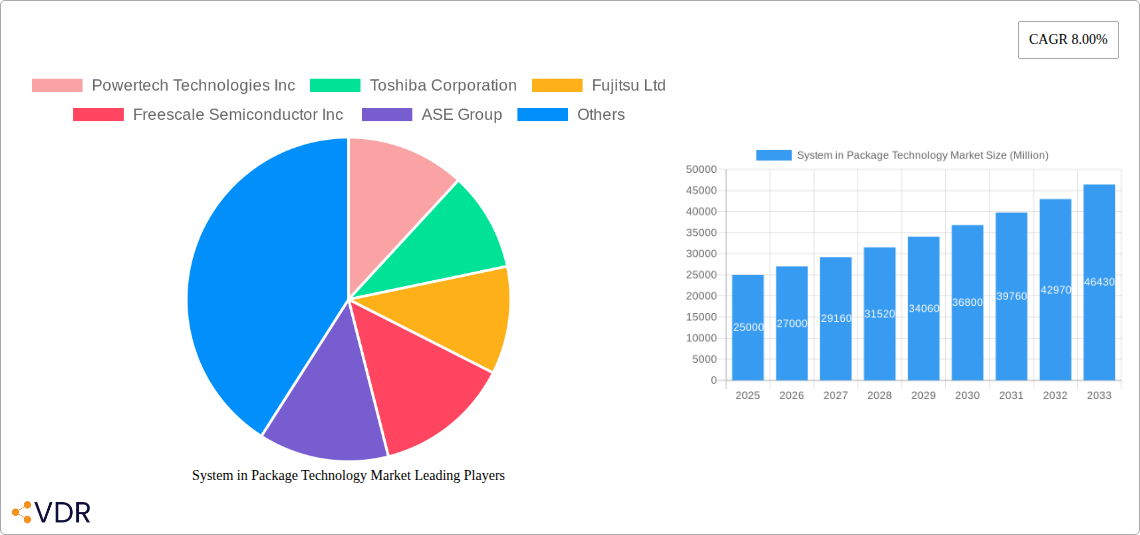
System in Package Technology Market Company Market Share
This report offers a comprehensive analysis of the System in Package (SiP) technology market, examining its dynamics, growth trajectories, key segments, and prominent players. Covering the period from 2019-2033, with 2025 as the base year, this study provides critical insights for industry stakeholders navigating this dynamic sector. The market is segmented by Device, Application, Package, Package Technology, and Packaging Method, enabling a detailed understanding of sub-market trends.
System in Package Technology Market Dynamics & Structure
The System in Package (SiP) technology market is characterized by moderate concentration, with a few dominant players alongside numerous niche players. Technological innovation, particularly in miniaturization and integration, is a key driver, fueling demand across diverse applications. Regulatory frameworks concerning environmental compliance and safety standards influence manufacturing processes and product design. Competitive substitutes, such as printed circuit boards (PCBs) in certain applications, exert pressure on pricing and market share. The end-user demographic is expanding rapidly, driven by increasing adoption of consumer electronics, automotive electronics, and other applications requiring high-performance, miniaturized devices. M&A activity has been moderate, with strategic acquisitions aimed at expanding product portfolios and geographical reach. The market size in 2025 is estimated at xx Million units.
- Market Concentration: Moderately concentrated, with top 5 players holding approximately xx% market share in 2025.
- Technological Innovation: Miniaturization, power efficiency improvements, and advanced packaging techniques (e.g., 3D IC, 5D IC) are primary drivers.
- Regulatory Landscape: Compliance with RoHS, REACH, and other environmental regulations is crucial.
- Competitive Substitutes: PCBs remain a competitive alternative in some lower-performance applications.
- M&A Activity: Moderate activity, focused on strengthening product lines and geographic expansion. Approximately xx M&A deals were recorded between 2019 and 2024.
- Innovation Barriers: High initial R&D investment, complex manufacturing processes, and stringent quality control requirements pose challenges.
System in Package Technology Market Growth Trends & Insights
The SiP technology market has witnessed consistent growth over the past few years, driven by increasing demand for smaller, more powerful, and energy-efficient electronic devices. The market size has expanded significantly, reflecting the broad adoption across various sectors. Technological disruptions, such as the advent of 5G and the Internet of Things (IoT), have further accelerated market growth. Consumer behavior shifts towards smart devices and connected systems have fuelled this expansion. The CAGR for the period 2019-2024 was approximately xx%, and the forecast CAGR for 2025-2033 is projected at xx%. Market penetration is highest in consumer electronics and is expected to grow significantly in automotive and industrial applications. By 2033, the market is projected to reach xx Million units.
Dominant Regions, Countries, or Segments in System in Package Technology Market
The Asia-Pacific region, particularly China, South Korea, and Japan, dominates the SiP technology market, driven by robust manufacturing capabilities, substantial consumer electronics production, and a thriving electronics industry. North America and Europe follow as significant markets, driven by strong demand in automotive, aerospace, and healthcare sectors. Within the device segment, Power Management Integrated Circuits (PMICs) and Application Processors hold the largest market share due to their widespread use in various electronic products. The consumer electronics application segment accounts for the largest share, followed by telecommunications and automotive. Flat packages and surface mount packaging methods dominate the packaging segment. 2D IC technology currently holds the largest market share in package technology, although 3D and 5D IC technologies are showing rapid growth.
- Key Drivers (Asia-Pacific): Strong manufacturing base, high consumer electronics demand, government support for technological advancements.
- Key Drivers (North America & Europe): High demand in automotive, aerospace, and healthcare, focus on advanced technologies.
- Dominant Segments: PMICs & Application Processors (Device); Consumer Electronics (Application); Flat Packages & Surface Mount (Package); 2D IC (Package Technology).
- Growth Potential: Automotive and industrial applications offer significant growth opportunities.
System in Package Technology Market Product Landscape
The SiP technology landscape is characterized by continuous product innovation, focusing on miniaturization, improved power efficiency, and enhanced performance. New products incorporate advanced packaging techniques like 3D and 5D ICs, enabling higher integration density and improved functionality. Key selling propositions include reduced size and weight, enhanced performance, and lower power consumption. Recent advancements include the integration of multiple functionalities on a single chip, leading to more compact and cost-effective designs.
Key Drivers, Barriers & Challenges in System in Package Technology Market
Key Drivers:
- Growing demand for miniaturized and high-performance electronic devices across various sectors.
- Increasing adoption of 5G, IoT, and other advanced technologies.
- Advancements in packaging technologies enabling higher integration density.
Challenges:
- High initial R&D investment and manufacturing costs.
- Complex design and manufacturing processes requiring specialized expertise.
- Supply chain disruptions and material shortages impacting production.
- Stringent regulatory compliance requirements.
- Intense competition among established players and emerging entrants. The impact of these challenges is estimated to reduce the market growth by approximately xx% by 2033.
Emerging Opportunities in System in Package Technology Market
- Growing demand for SiP solutions in emerging applications such as wearables, medical devices, and smart homes.
- Expansion into new geographic markets with significant growth potential.
- Development of innovative packaging technologies enabling further miniaturization and performance enhancement.
- Rise of customized SiP solutions catering to specific application requirements.
Growth Accelerators in the System in Package Technology Market Industry
Technological breakthroughs in miniaturization and integration are pivotal in driving long-term growth. Strategic partnerships between SiP manufacturers and semiconductor companies are fostering innovation and expanding market reach. Market expansion strategies focusing on emerging applications and geographic regions are further accelerating growth. The development of advanced packaging techniques, such as 5D IC, promises to significantly enhance the capabilities of SiP technology, opening new opportunities across various sectors.
Key Players Shaping the System in Package Technology Market Market
- Powertech Technologies Inc
- Toshiba Corporation
- Fujitsu Ltd
- Freescale Semiconductor Inc (Note: Freescale is now part of NXP)
- ASE Group
- Jiangsu Changjiang Electronics Technology Co Ltd
- Samsung Electronics Co Ltd
- Renesas Electronics Corporation
- Siliconware Precision Industries Co
- Amkor Technology Inc
- Qualcomm
- ChipMOS Technologies Inc
Notable Milestones in System in Package Technology Market Sector
- 2020: Introduction of a new 3D SiP technology by Samsung Electronics.
- 2021: Partnership between ASE Group and Qualcomm to develop advanced packaging solutions for 5G applications.
- 2022: Acquisition of a smaller SiP manufacturer by Amkor Technology, expanding its market share.
- 2023: Launch of a new line of highly miniaturized SiP modules by Toshiba.
- 2024: Increased investment in R&D by several major players focusing on advanced packaging technologies.
In-Depth System in Package Technology Market Market Outlook
The SiP technology market is poised for continued robust growth, driven by ongoing technological advancements and expanding applications. The integration of artificial intelligence (AI) and machine learning (ML) into SiP solutions will open new opportunities, particularly in automotive and healthcare. Strategic partnerships and mergers & acquisitions will continue to shape the market landscape. The long-term outlook is positive, with significant potential for market expansion across diverse sectors and geographies. By focusing on innovation, strategic partnerships, and effective market expansion strategies, SiP manufacturers can capitalize on this significant growth opportunity.
System in Package Technology Market Segmentation
-
1. Package
- 1.1. Flat Packages
- 1.2. Pin Grid Arrays
- 1.3. Surface Mount
- 1.4. Small Outline
-
2. Package Technology
- 2.1. 2D IC
- 2.2. 3D IC
- 2.3. 5D IC
-
3. Packaging Method
- 3.1. Wire Bond
- 3.2. Flip Chip
- 3.3. Fan-Out Wafer Leve
-
4. Device
- 4.1. Power Management Integrated Circuit (PMIC)
- 4.2. Microelectromechanical Systems (MEMS)
- 4.3. RF Front-End
- 4.4. RF Power Amplifier
- 4.5. Application Processor
- 4.6. Baseband Processor
- 4.7. Others
-
5. Application
- 5.1. Consumer Electronics
- 5.2. Telecommunications
- 5.3. Industrial Systems
- 5.4. Automotive and Transportation
- 5.5. Aerospace and Defense
- 5.6. Healthcare
- 5.7. Other Applications
System in Package Technology Market Segmentation By Geography
- 1. North America
- 2. Europe
- 3. Asia Pacific
- 4. Latin America
- 5. Middle East and Africa
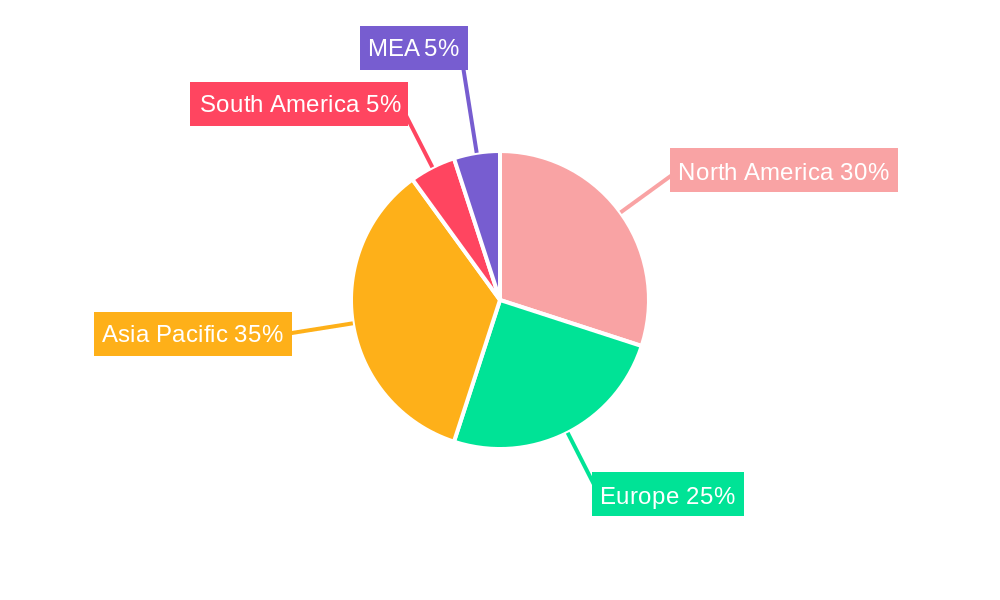
System in Package Technology Market Regional Market Share
Geographic Coverage of System in Package Technology Market
System in Package Technology Market REPORT HIGHLIGHTS
| Aspects | Details |
|---|---|
| Study Period | 2020-2034 |
| Base Year | 2025 |
| Estimated Year | 2026 |
| Forecast Period | 2026-2034 |
| Historical Period | 2020-2025 |
| Growth Rate | CAGR of 6.8% from 2020-2034 |
| Segmentation |
|
Table of Contents
- 1. Introduction
- 1.1. Research Scope
- 1.2. Market Segmentation
- 1.3. Research Objective
- 1.4. Definitions and Assumptions
- 2. Executive Summary
- 2.1. Market Snapshot
- 3. Market Dynamics
- 3.1. Market Drivers
- 3.2. Market Restrains
- 3.3. Market Trends
- 3.4. Market Opportunities
- 4. Market Factor Analysis
- 4.1. Porters Five Forces
- 4.1.1. Bargaining Power of Suppliers
- 4.1.2. Bargaining Power of Buyers
- 4.1.3. Threat of New Entrants
- 4.1.4. Threat of Substitutes
- 4.1.5. Competitive Rivalry
- 4.2. PESTEL analysis
- 4.3. BCG Analysis
- 4.3.1. Stars (High Growth, High Market Share)
- 4.3.2. Cash Cows (Low Growth, High Market Share)
- 4.3.3. Question Mark (High Growth, Low Market Share)
- 4.3.4. Dogs (Low Growth, Low Market Share)
- 4.4. Ansoff Matrix Analysis
- 4.5. Supply Chain Analysis
- 4.6. Regulatory Landscape
- 4.7. Current Market Potential and Opportunity Assessment (TAM–SAM–SOM Framework)
- 4.8. VDR Analyst Note
- 4.1. Porters Five Forces
- 5. Market Analysis, Insights and Forecast 2021-2033
- 5.1. Market Analysis, Insights and Forecast - by Package
- 5.1.1. Flat Packages
- 5.1.2. Pin Grid Arrays
- 5.1.3. Surface Mount
- 5.1.4. Small Outline
- 5.2. Market Analysis, Insights and Forecast - by Package Technology
- 5.2.1. 2D IC
- 5.2.2. 3D IC
- 5.2.3. 5D IC
- 5.3. Market Analysis, Insights and Forecast - by Packaging Method
- 5.3.1. Wire Bond
- 5.3.2. Flip Chip
- 5.3.3. Fan-Out Wafer Leve
- 5.4. Market Analysis, Insights and Forecast - by Device
- 5.4.1. Power Management Integrated Circuit (PMIC)
- 5.4.2. Microelectromechanical Systems (MEMS)
- 5.4.3. RF Front-End
- 5.4.4. RF Power Amplifier
- 5.4.5. Application Processor
- 5.4.6. Baseband Processor
- 5.4.7. Others
- 5.5. Market Analysis, Insights and Forecast - by Application
- 5.5.1. Consumer Electronics
- 5.5.2. Telecommunications
- 5.5.3. Industrial Systems
- 5.5.4. Automotive and Transportation
- 5.5.5. Aerospace and Defense
- 5.5.6. Healthcare
- 5.5.7. Other Applications
- 5.6. Market Analysis, Insights and Forecast - by Region
- 5.6.1. North America
- 5.6.2. Europe
- 5.6.3. Asia Pacific
- 5.6.4. Latin America
- 5.6.5. Middle East and Africa
- 5.1. Market Analysis, Insights and Forecast - by Package
- 6. Global System in Package Technology Market Analysis, Insights and Forecast, 2021-2033
- 6.1. Market Analysis, Insights and Forecast - by Package
- 6.1.1. Flat Packages
- 6.1.2. Pin Grid Arrays
- 6.1.3. Surface Mount
- 6.1.4. Small Outline
- 6.2. Market Analysis, Insights and Forecast - by Package Technology
- 6.2.1. 2D IC
- 6.2.2. 3D IC
- 6.2.3. 5D IC
- 6.3. Market Analysis, Insights and Forecast - by Packaging Method
- 6.3.1. Wire Bond
- 6.3.2. Flip Chip
- 6.3.3. Fan-Out Wafer Leve
- 6.4. Market Analysis, Insights and Forecast - by Device
- 6.4.1. Power Management Integrated Circuit (PMIC)
- 6.4.2. Microelectromechanical Systems (MEMS)
- 6.4.3. RF Front-End
- 6.4.4. RF Power Amplifier
- 6.4.5. Application Processor
- 6.4.6. Baseband Processor
- 6.4.7. Others
- 6.5. Market Analysis, Insights and Forecast - by Application
- 6.5.1. Consumer Electronics
- 6.5.2. Telecommunications
- 6.5.3. Industrial Systems
- 6.5.4. Automotive and Transportation
- 6.5.5. Aerospace and Defense
- 6.5.6. Healthcare
- 6.5.7. Other Applications
- 6.1. Market Analysis, Insights and Forecast - by Package
- 7. North America System in Package Technology Market Analysis, Insights and Forecast, 2021-2033
- 7.1. Market Analysis, Insights and Forecast - by Package
- 7.1.1. Flat Packages
- 7.1.2. Pin Grid Arrays
- 7.1.3. Surface Mount
- 7.1.4. Small Outline
- 7.2. Market Analysis, Insights and Forecast - by Package Technology
- 7.2.1. 2D IC
- 7.2.2. 3D IC
- 7.2.3. 5D IC
- 7.3. Market Analysis, Insights and Forecast - by Packaging Method
- 7.3.1. Wire Bond
- 7.3.2. Flip Chip
- 7.3.3. Fan-Out Wafer Leve
- 7.4. Market Analysis, Insights and Forecast - by Device
- 7.4.1. Power Management Integrated Circuit (PMIC)
- 7.4.2. Microelectromechanical Systems (MEMS)
- 7.4.3. RF Front-End
- 7.4.4. RF Power Amplifier
- 7.4.5. Application Processor
- 7.4.6. Baseband Processor
- 7.4.7. Others
- 7.5. Market Analysis, Insights and Forecast - by Application
- 7.5.1. Consumer Electronics
- 7.5.2. Telecommunications
- 7.5.3. Industrial Systems
- 7.5.4. Automotive and Transportation
- 7.5.5. Aerospace and Defense
- 7.5.6. Healthcare
- 7.5.7. Other Applications
- 7.1. Market Analysis, Insights and Forecast - by Package
- 8. Europe System in Package Technology Market Analysis, Insights and Forecast, 2021-2033
- 8.1. Market Analysis, Insights and Forecast - by Package
- 8.1.1. Flat Packages
- 8.1.2. Pin Grid Arrays
- 8.1.3. Surface Mount
- 8.1.4. Small Outline
- 8.2. Market Analysis, Insights and Forecast - by Package Technology
- 8.2.1. 2D IC
- 8.2.2. 3D IC
- 8.2.3. 5D IC
- 8.3. Market Analysis, Insights and Forecast - by Packaging Method
- 8.3.1. Wire Bond
- 8.3.2. Flip Chip
- 8.3.3. Fan-Out Wafer Leve
- 8.4. Market Analysis, Insights and Forecast - by Device
- 8.4.1. Power Management Integrated Circuit (PMIC)
- 8.4.2. Microelectromechanical Systems (MEMS)
- 8.4.3. RF Front-End
- 8.4.4. RF Power Amplifier
- 8.4.5. Application Processor
- 8.4.6. Baseband Processor
- 8.4.7. Others
- 8.5. Market Analysis, Insights and Forecast - by Application
- 8.5.1. Consumer Electronics
- 8.5.2. Telecommunications
- 8.5.3. Industrial Systems
- 8.5.4. Automotive and Transportation
- 8.5.5. Aerospace and Defense
- 8.5.6. Healthcare
- 8.5.7. Other Applications
- 8.1. Market Analysis, Insights and Forecast - by Package
- 9. Asia Pacific System in Package Technology Market Analysis, Insights and Forecast, 2021-2033
- 9.1. Market Analysis, Insights and Forecast - by Package
- 9.1.1. Flat Packages
- 9.1.2. Pin Grid Arrays
- 9.1.3. Surface Mount
- 9.1.4. Small Outline
- 9.2. Market Analysis, Insights and Forecast - by Package Technology
- 9.2.1. 2D IC
- 9.2.2. 3D IC
- 9.2.3. 5D IC
- 9.3. Market Analysis, Insights and Forecast - by Packaging Method
- 9.3.1. Wire Bond
- 9.3.2. Flip Chip
- 9.3.3. Fan-Out Wafer Leve
- 9.4. Market Analysis, Insights and Forecast - by Device
- 9.4.1. Power Management Integrated Circuit (PMIC)
- 9.4.2. Microelectromechanical Systems (MEMS)
- 9.4.3. RF Front-End
- 9.4.4. RF Power Amplifier
- 9.4.5. Application Processor
- 9.4.6. Baseband Processor
- 9.4.7. Others
- 9.5. Market Analysis, Insights and Forecast - by Application
- 9.5.1. Consumer Electronics
- 9.5.2. Telecommunications
- 9.5.3. Industrial Systems
- 9.5.4. Automotive and Transportation
- 9.5.5. Aerospace and Defense
- 9.5.6. Healthcare
- 9.5.7. Other Applications
- 9.1. Market Analysis, Insights and Forecast - by Package
- 10. Latin America System in Package Technology Market Analysis, Insights and Forecast, 2021-2033
- 10.1. Market Analysis, Insights and Forecast - by Package
- 10.1.1. Flat Packages
- 10.1.2. Pin Grid Arrays
- 10.1.3. Surface Mount
- 10.1.4. Small Outline
- 10.2. Market Analysis, Insights and Forecast - by Package Technology
- 10.2.1. 2D IC
- 10.2.2. 3D IC
- 10.2.3. 5D IC
- 10.3. Market Analysis, Insights and Forecast - by Packaging Method
- 10.3.1. Wire Bond
- 10.3.2. Flip Chip
- 10.3.3. Fan-Out Wafer Leve
- 10.4. Market Analysis, Insights and Forecast - by Device
- 10.4.1. Power Management Integrated Circuit (PMIC)
- 10.4.2. Microelectromechanical Systems (MEMS)
- 10.4.3. RF Front-End
- 10.4.4. RF Power Amplifier
- 10.4.5. Application Processor
- 10.4.6. Baseband Processor
- 10.4.7. Others
- 10.5. Market Analysis, Insights and Forecast - by Application
- 10.5.1. Consumer Electronics
- 10.5.2. Telecommunications
- 10.5.3. Industrial Systems
- 10.5.4. Automotive and Transportation
- 10.5.5. Aerospace and Defense
- 10.5.6. Healthcare
- 10.5.7. Other Applications
- 10.1. Market Analysis, Insights and Forecast - by Package
- 11. Middle East and Africa System in Package Technology Market Analysis, Insights and Forecast, 2021-2033
- 11.1. Market Analysis, Insights and Forecast - by Package
- 11.1.1. Flat Packages
- 11.1.2. Pin Grid Arrays
- 11.1.3. Surface Mount
- 11.1.4. Small Outline
- 11.2. Market Analysis, Insights and Forecast - by Package Technology
- 11.2.1. 2D IC
- 11.2.2. 3D IC
- 11.2.3. 5D IC
- 11.3. Market Analysis, Insights and Forecast - by Packaging Method
- 11.3.1. Wire Bond
- 11.3.2. Flip Chip
- 11.3.3. Fan-Out Wafer Leve
- 11.4. Market Analysis, Insights and Forecast - by Device
- 11.4.1. Power Management Integrated Circuit (PMIC)
- 11.4.2. Microelectromechanical Systems (MEMS)
- 11.4.3. RF Front-End
- 11.4.4. RF Power Amplifier
- 11.4.5. Application Processor
- 11.4.6. Baseband Processor
- 11.4.7. Others
- 11.5. Market Analysis, Insights and Forecast - by Application
- 11.5.1. Consumer Electronics
- 11.5.2. Telecommunications
- 11.5.3. Industrial Systems
- 11.5.4. Automotive and Transportation
- 11.5.5. Aerospace and Defense
- 11.5.6. Healthcare
- 11.5.7. Other Applications
- 11.1. Market Analysis, Insights and Forecast - by Package
- 12. Competitive Analysis
- 12.1. Company Profiles
- 12.1.1 Powertech Technologies Inc
- 12.1.1.1. Company Overview
- 12.1.1.2. Products
- 12.1.1.3. Company Financials
- 12.1.1.4. SWOT Analysis
- 12.1.2 Toshiba Corporation
- 12.1.2.1. Company Overview
- 12.1.2.2. Products
- 12.1.2.3. Company Financials
- 12.1.2.4. SWOT Analysis
- 12.1.3 Fujitsu Ltd
- 12.1.3.1. Company Overview
- 12.1.3.2. Products
- 12.1.3.3. Company Financials
- 12.1.3.4. SWOT Analysis
- 12.1.4 Freescale Semiconductor Inc
- 12.1.4.1. Company Overview
- 12.1.4.2. Products
- 12.1.4.3. Company Financials
- 12.1.4.4. SWOT Analysis
- 12.1.5 ASE Group
- 12.1.5.1. Company Overview
- 12.1.5.2. Products
- 12.1.5.3. Company Financials
- 12.1.5.4. SWOT Analysis
- 12.1.6 Jiangsu Changjiang Electronics Technology Co Ltd
- 12.1.6.1. Company Overview
- 12.1.6.2. Products
- 12.1.6.3. Company Financials
- 12.1.6.4. SWOT Analysis
- 12.1.7 Samsung Electronics Co Ltd
- 12.1.7.1. Company Overview
- 12.1.7.2. Products
- 12.1.7.3. Company Financials
- 12.1.7.4. SWOT Analysis
- 12.1.8 Renesas Electronics Corporation
- 12.1.8.1. Company Overview
- 12.1.8.2. Products
- 12.1.8.3. Company Financials
- 12.1.8.4. SWOT Analysis
- 12.1.9 Siliconware Precision Industries Co
- 12.1.9.1. Company Overview
- 12.1.9.2. Products
- 12.1.9.3. Company Financials
- 12.1.9.4. SWOT Analysis
- 12.1.10 Amkor Technology Inc
- 12.1.10.1. Company Overview
- 12.1.10.2. Products
- 12.1.10.3. Company Financials
- 12.1.10.4. SWOT Analysis
- 12.1.11 Qualcomm
- 12.1.11.1. Company Overview
- 12.1.11.2. Products
- 12.1.11.3. Company Financials
- 12.1.11.4. SWOT Analysis
- 12.1.12 ChipMOS Technologies Inc
- 12.1.12.1. Company Overview
- 12.1.12.2. Products
- 12.1.12.3. Company Financials
- 12.1.12.4. SWOT Analysis
- 12.1.1 Powertech Technologies Inc
- 12.2. Market Entropy
- 12.2.1 Company's Key Areas Served
- 12.2.2 Recent Developments
- 12.3. Company Market Share Analysis 2025
- 12.3.1 Top 5 Companies Market Share Analysis
- 12.3.2 Top 3 Companies Market Share Analysis
- 12.4. List of Potential Customers
- 13. Research Methodology
List of Figures
- Figure 1: Global System in Package Technology Market Revenue Breakdown (billion, %) by Region 2025 & 2033
- Figure 2: Global System in Package Technology Market Volume Breakdown (K Unit, %) by Region 2025 & 2033
- Figure 3: North America System in Package Technology Market Revenue (billion), by Package 2025 & 2033
- Figure 4: North America System in Package Technology Market Volume (K Unit), by Package 2025 & 2033
- Figure 5: North America System in Package Technology Market Revenue Share (%), by Package 2025 & 2033
- Figure 6: North America System in Package Technology Market Volume Share (%), by Package 2025 & 2033
- Figure 7: North America System in Package Technology Market Revenue (billion), by Package Technology 2025 & 2033
- Figure 8: North America System in Package Technology Market Volume (K Unit), by Package Technology 2025 & 2033
- Figure 9: North America System in Package Technology Market Revenue Share (%), by Package Technology 2025 & 2033
- Figure 10: North America System in Package Technology Market Volume Share (%), by Package Technology 2025 & 2033
- Figure 11: North America System in Package Technology Market Revenue (billion), by Packaging Method 2025 & 2033
- Figure 12: North America System in Package Technology Market Volume (K Unit), by Packaging Method 2025 & 2033
- Figure 13: North America System in Package Technology Market Revenue Share (%), by Packaging Method 2025 & 2033
- Figure 14: North America System in Package Technology Market Volume Share (%), by Packaging Method 2025 & 2033
- Figure 15: North America System in Package Technology Market Revenue (billion), by Device 2025 & 2033
- Figure 16: North America System in Package Technology Market Volume (K Unit), by Device 2025 & 2033
- Figure 17: North America System in Package Technology Market Revenue Share (%), by Device 2025 & 2033
- Figure 18: North America System in Package Technology Market Volume Share (%), by Device 2025 & 2033
- Figure 19: North America System in Package Technology Market Revenue (billion), by Application 2025 & 2033
- Figure 20: North America System in Package Technology Market Volume (K Unit), by Application 2025 & 2033
- Figure 21: North America System in Package Technology Market Revenue Share (%), by Application 2025 & 2033
- Figure 22: North America System in Package Technology Market Volume Share (%), by Application 2025 & 2033
- Figure 23: North America System in Package Technology Market Revenue (billion), by Country 2025 & 2033
- Figure 24: North America System in Package Technology Market Volume (K Unit), by Country 2025 & 2033
- Figure 25: North America System in Package Technology Market Revenue Share (%), by Country 2025 & 2033
- Figure 26: North America System in Package Technology Market Volume Share (%), by Country 2025 & 2033
- Figure 27: Europe System in Package Technology Market Revenue (billion), by Package 2025 & 2033
- Figure 28: Europe System in Package Technology Market Volume (K Unit), by Package 2025 & 2033
- Figure 29: Europe System in Package Technology Market Revenue Share (%), by Package 2025 & 2033
- Figure 30: Europe System in Package Technology Market Volume Share (%), by Package 2025 & 2033
- Figure 31: Europe System in Package Technology Market Revenue (billion), by Package Technology 2025 & 2033
- Figure 32: Europe System in Package Technology Market Volume (K Unit), by Package Technology 2025 & 2033
- Figure 33: Europe System in Package Technology Market Revenue Share (%), by Package Technology 2025 & 2033
- Figure 34: Europe System in Package Technology Market Volume Share (%), by Package Technology 2025 & 2033
- Figure 35: Europe System in Package Technology Market Revenue (billion), by Packaging Method 2025 & 2033
- Figure 36: Europe System in Package Technology Market Volume (K Unit), by Packaging Method 2025 & 2033
- Figure 37: Europe System in Package Technology Market Revenue Share (%), by Packaging Method 2025 & 2033
- Figure 38: Europe System in Package Technology Market Volume Share (%), by Packaging Method 2025 & 2033
- Figure 39: Europe System in Package Technology Market Revenue (billion), by Device 2025 & 2033
- Figure 40: Europe System in Package Technology Market Volume (K Unit), by Device 2025 & 2033
- Figure 41: Europe System in Package Technology Market Revenue Share (%), by Device 2025 & 2033
- Figure 42: Europe System in Package Technology Market Volume Share (%), by Device 2025 & 2033
- Figure 43: Europe System in Package Technology Market Revenue (billion), by Application 2025 & 2033
- Figure 44: Europe System in Package Technology Market Volume (K Unit), by Application 2025 & 2033
- Figure 45: Europe System in Package Technology Market Revenue Share (%), by Application 2025 & 2033
- Figure 46: Europe System in Package Technology Market Volume Share (%), by Application 2025 & 2033
- Figure 47: Europe System in Package Technology Market Revenue (billion), by Country 2025 & 2033
- Figure 48: Europe System in Package Technology Market Volume (K Unit), by Country 2025 & 2033
- Figure 49: Europe System in Package Technology Market Revenue Share (%), by Country 2025 & 2033
- Figure 50: Europe System in Package Technology Market Volume Share (%), by Country 2025 & 2033
- Figure 51: Asia Pacific System in Package Technology Market Revenue (billion), by Package 2025 & 2033
- Figure 52: Asia Pacific System in Package Technology Market Volume (K Unit), by Package 2025 & 2033
- Figure 53: Asia Pacific System in Package Technology Market Revenue Share (%), by Package 2025 & 2033
- Figure 54: Asia Pacific System in Package Technology Market Volume Share (%), by Package 2025 & 2033
- Figure 55: Asia Pacific System in Package Technology Market Revenue (billion), by Package Technology 2025 & 2033
- Figure 56: Asia Pacific System in Package Technology Market Volume (K Unit), by Package Technology 2025 & 2033
- Figure 57: Asia Pacific System in Package Technology Market Revenue Share (%), by Package Technology 2025 & 2033
- Figure 58: Asia Pacific System in Package Technology Market Volume Share (%), by Package Technology 2025 & 2033
- Figure 59: Asia Pacific System in Package Technology Market Revenue (billion), by Packaging Method 2025 & 2033
- Figure 60: Asia Pacific System in Package Technology Market Volume (K Unit), by Packaging Method 2025 & 2033
- Figure 61: Asia Pacific System in Package Technology Market Revenue Share (%), by Packaging Method 2025 & 2033
- Figure 62: Asia Pacific System in Package Technology Market Volume Share (%), by Packaging Method 2025 & 2033
- Figure 63: Asia Pacific System in Package Technology Market Revenue (billion), by Device 2025 & 2033
- Figure 64: Asia Pacific System in Package Technology Market Volume (K Unit), by Device 2025 & 2033
- Figure 65: Asia Pacific System in Package Technology Market Revenue Share (%), by Device 2025 & 2033
- Figure 66: Asia Pacific System in Package Technology Market Volume Share (%), by Device 2025 & 2033
- Figure 67: Asia Pacific System in Package Technology Market Revenue (billion), by Application 2025 & 2033
- Figure 68: Asia Pacific System in Package Technology Market Volume (K Unit), by Application 2025 & 2033
- Figure 69: Asia Pacific System in Package Technology Market Revenue Share (%), by Application 2025 & 2033
- Figure 70: Asia Pacific System in Package Technology Market Volume Share (%), by Application 2025 & 2033
- Figure 71: Asia Pacific System in Package Technology Market Revenue (billion), by Country 2025 & 2033
- Figure 72: Asia Pacific System in Package Technology Market Volume (K Unit), by Country 2025 & 2033
- Figure 73: Asia Pacific System in Package Technology Market Revenue Share (%), by Country 2025 & 2033
- Figure 74: Asia Pacific System in Package Technology Market Volume Share (%), by Country 2025 & 2033
- Figure 75: Latin America System in Package Technology Market Revenue (billion), by Package 2025 & 2033
- Figure 76: Latin America System in Package Technology Market Volume (K Unit), by Package 2025 & 2033
- Figure 77: Latin America System in Package Technology Market Revenue Share (%), by Package 2025 & 2033
- Figure 78: Latin America System in Package Technology Market Volume Share (%), by Package 2025 & 2033
- Figure 79: Latin America System in Package Technology Market Revenue (billion), by Package Technology 2025 & 2033
- Figure 80: Latin America System in Package Technology Market Volume (K Unit), by Package Technology 2025 & 2033
- Figure 81: Latin America System in Package Technology Market Revenue Share (%), by Package Technology 2025 & 2033
- Figure 82: Latin America System in Package Technology Market Volume Share (%), by Package Technology 2025 & 2033
- Figure 83: Latin America System in Package Technology Market Revenue (billion), by Packaging Method 2025 & 2033
- Figure 84: Latin America System in Package Technology Market Volume (K Unit), by Packaging Method 2025 & 2033
- Figure 85: Latin America System in Package Technology Market Revenue Share (%), by Packaging Method 2025 & 2033
- Figure 86: Latin America System in Package Technology Market Volume Share (%), by Packaging Method 2025 & 2033
- Figure 87: Latin America System in Package Technology Market Revenue (billion), by Device 2025 & 2033
- Figure 88: Latin America System in Package Technology Market Volume (K Unit), by Device 2025 & 2033
- Figure 89: Latin America System in Package Technology Market Revenue Share (%), by Device 2025 & 2033
- Figure 90: Latin America System in Package Technology Market Volume Share (%), by Device 2025 & 2033
- Figure 91: Latin America System in Package Technology Market Revenue (billion), by Application 2025 & 2033
- Figure 92: Latin America System in Package Technology Market Volume (K Unit), by Application 2025 & 2033
- Figure 93: Latin America System in Package Technology Market Revenue Share (%), by Application 2025 & 2033
- Figure 94: Latin America System in Package Technology Market Volume Share (%), by Application 2025 & 2033
- Figure 95: Latin America System in Package Technology Market Revenue (billion), by Country 2025 & 2033
- Figure 96: Latin America System in Package Technology Market Volume (K Unit), by Country 2025 & 2033
- Figure 97: Latin America System in Package Technology Market Revenue Share (%), by Country 2025 & 2033
- Figure 98: Latin America System in Package Technology Market Volume Share (%), by Country 2025 & 2033
- Figure 99: Middle East and Africa System in Package Technology Market Revenue (billion), by Package 2025 & 2033
- Figure 100: Middle East and Africa System in Package Technology Market Volume (K Unit), by Package 2025 & 2033
- Figure 101: Middle East and Africa System in Package Technology Market Revenue Share (%), by Package 2025 & 2033
- Figure 102: Middle East and Africa System in Package Technology Market Volume Share (%), by Package 2025 & 2033
- Figure 103: Middle East and Africa System in Package Technology Market Revenue (billion), by Package Technology 2025 & 2033
- Figure 104: Middle East and Africa System in Package Technology Market Volume (K Unit), by Package Technology 2025 & 2033
- Figure 105: Middle East and Africa System in Package Technology Market Revenue Share (%), by Package Technology 2025 & 2033
- Figure 106: Middle East and Africa System in Package Technology Market Volume Share (%), by Package Technology 2025 & 2033
- Figure 107: Middle East and Africa System in Package Technology Market Revenue (billion), by Packaging Method 2025 & 2033
- Figure 108: Middle East and Africa System in Package Technology Market Volume (K Unit), by Packaging Method 2025 & 2033
- Figure 109: Middle East and Africa System in Package Technology Market Revenue Share (%), by Packaging Method 2025 & 2033
- Figure 110: Middle East and Africa System in Package Technology Market Volume Share (%), by Packaging Method 2025 & 2033
- Figure 111: Middle East and Africa System in Package Technology Market Revenue (billion), by Device 2025 & 2033
- Figure 112: Middle East and Africa System in Package Technology Market Volume (K Unit), by Device 2025 & 2033
- Figure 113: Middle East and Africa System in Package Technology Market Revenue Share (%), by Device 2025 & 2033
- Figure 114: Middle East and Africa System in Package Technology Market Volume Share (%), by Device 2025 & 2033
- Figure 115: Middle East and Africa System in Package Technology Market Revenue (billion), by Application 2025 & 2033
- Figure 116: Middle East and Africa System in Package Technology Market Volume (K Unit), by Application 2025 & 2033
- Figure 117: Middle East and Africa System in Package Technology Market Revenue Share (%), by Application 2025 & 2033
- Figure 118: Middle East and Africa System in Package Technology Market Volume Share (%), by Application 2025 & 2033
- Figure 119: Middle East and Africa System in Package Technology Market Revenue (billion), by Country 2025 & 2033
- Figure 120: Middle East and Africa System in Package Technology Market Volume (K Unit), by Country 2025 & 2033
- Figure 121: Middle East and Africa System in Package Technology Market Revenue Share (%), by Country 2025 & 2033
- Figure 122: Middle East and Africa System in Package Technology Market Volume Share (%), by Country 2025 & 2033
List of Tables
- Table 1: Global System in Package Technology Market Revenue billion Forecast, by Package 2020 & 2033
- Table 2: Global System in Package Technology Market Volume K Unit Forecast, by Package 2020 & 2033
- Table 3: Global System in Package Technology Market Revenue billion Forecast, by Package Technology 2020 & 2033
- Table 4: Global System in Package Technology Market Volume K Unit Forecast, by Package Technology 2020 & 2033
- Table 5: Global System in Package Technology Market Revenue billion Forecast, by Packaging Method 2020 & 2033
- Table 6: Global System in Package Technology Market Volume K Unit Forecast, by Packaging Method 2020 & 2033
- Table 7: Global System in Package Technology Market Revenue billion Forecast, by Device 2020 & 2033
- Table 8: Global System in Package Technology Market Volume K Unit Forecast, by Device 2020 & 2033
- Table 9: Global System in Package Technology Market Revenue billion Forecast, by Application 2020 & 2033
- Table 10: Global System in Package Technology Market Volume K Unit Forecast, by Application 2020 & 2033
- Table 11: Global System in Package Technology Market Revenue billion Forecast, by Region 2020 & 2033
- Table 12: Global System in Package Technology Market Volume K Unit Forecast, by Region 2020 & 2033
- Table 13: Global System in Package Technology Market Revenue billion Forecast, by Package 2020 & 2033
- Table 14: Global System in Package Technology Market Volume K Unit Forecast, by Package 2020 & 2033
- Table 15: Global System in Package Technology Market Revenue billion Forecast, by Package Technology 2020 & 2033
- Table 16: Global System in Package Technology Market Volume K Unit Forecast, by Package Technology 2020 & 2033
- Table 17: Global System in Package Technology Market Revenue billion Forecast, by Packaging Method 2020 & 2033
- Table 18: Global System in Package Technology Market Volume K Unit Forecast, by Packaging Method 2020 & 2033
- Table 19: Global System in Package Technology Market Revenue billion Forecast, by Device 2020 & 2033
- Table 20: Global System in Package Technology Market Volume K Unit Forecast, by Device 2020 & 2033
- Table 21: Global System in Package Technology Market Revenue billion Forecast, by Application 2020 & 2033
- Table 22: Global System in Package Technology Market Volume K Unit Forecast, by Application 2020 & 2033
- Table 23: Global System in Package Technology Market Revenue billion Forecast, by Country 2020 & 2033
- Table 24: Global System in Package Technology Market Volume K Unit Forecast, by Country 2020 & 2033
- Table 25: Global System in Package Technology Market Revenue billion Forecast, by Package 2020 & 2033
- Table 26: Global System in Package Technology Market Volume K Unit Forecast, by Package 2020 & 2033
- Table 27: Global System in Package Technology Market Revenue billion Forecast, by Package Technology 2020 & 2033
- Table 28: Global System in Package Technology Market Volume K Unit Forecast, by Package Technology 2020 & 2033
- Table 29: Global System in Package Technology Market Revenue billion Forecast, by Packaging Method 2020 & 2033
- Table 30: Global System in Package Technology Market Volume K Unit Forecast, by Packaging Method 2020 & 2033
- Table 31: Global System in Package Technology Market Revenue billion Forecast, by Device 2020 & 2033
- Table 32: Global System in Package Technology Market Volume K Unit Forecast, by Device 2020 & 2033
- Table 33: Global System in Package Technology Market Revenue billion Forecast, by Application 2020 & 2033
- Table 34: Global System in Package Technology Market Volume K Unit Forecast, by Application 2020 & 2033
- Table 35: Global System in Package Technology Market Revenue billion Forecast, by Country 2020 & 2033
- Table 36: Global System in Package Technology Market Volume K Unit Forecast, by Country 2020 & 2033
- Table 37: Global System in Package Technology Market Revenue billion Forecast, by Package 2020 & 2033
- Table 38: Global System in Package Technology Market Volume K Unit Forecast, by Package 2020 & 2033
- Table 39: Global System in Package Technology Market Revenue billion Forecast, by Package Technology 2020 & 2033
- Table 40: Global System in Package Technology Market Volume K Unit Forecast, by Package Technology 2020 & 2033
- Table 41: Global System in Package Technology Market Revenue billion Forecast, by Packaging Method 2020 & 2033
- Table 42: Global System in Package Technology Market Volume K Unit Forecast, by Packaging Method 2020 & 2033
- Table 43: Global System in Package Technology Market Revenue billion Forecast, by Device 2020 & 2033
- Table 44: Global System in Package Technology Market Volume K Unit Forecast, by Device 2020 & 2033
- Table 45: Global System in Package Technology Market Revenue billion Forecast, by Application 2020 & 2033
- Table 46: Global System in Package Technology Market Volume K Unit Forecast, by Application 2020 & 2033
- Table 47: Global System in Package Technology Market Revenue billion Forecast, by Country 2020 & 2033
- Table 48: Global System in Package Technology Market Volume K Unit Forecast, by Country 2020 & 2033
- Table 49: Global System in Package Technology Market Revenue billion Forecast, by Package 2020 & 2033
- Table 50: Global System in Package Technology Market Volume K Unit Forecast, by Package 2020 & 2033
- Table 51: Global System in Package Technology Market Revenue billion Forecast, by Package Technology 2020 & 2033
- Table 52: Global System in Package Technology Market Volume K Unit Forecast, by Package Technology 2020 & 2033
- Table 53: Global System in Package Technology Market Revenue billion Forecast, by Packaging Method 2020 & 2033
- Table 54: Global System in Package Technology Market Volume K Unit Forecast, by Packaging Method 2020 & 2033
- Table 55: Global System in Package Technology Market Revenue billion Forecast, by Device 2020 & 2033
- Table 56: Global System in Package Technology Market Volume K Unit Forecast, by Device 2020 & 2033
- Table 57: Global System in Package Technology Market Revenue billion Forecast, by Application 2020 & 2033
- Table 58: Global System in Package Technology Market Volume K Unit Forecast, by Application 2020 & 2033
- Table 59: Global System in Package Technology Market Revenue billion Forecast, by Country 2020 & 2033
- Table 60: Global System in Package Technology Market Volume K Unit Forecast, by Country 2020 & 2033
- Table 61: Global System in Package Technology Market Revenue billion Forecast, by Package 2020 & 2033
- Table 62: Global System in Package Technology Market Volume K Unit Forecast, by Package 2020 & 2033
- Table 63: Global System in Package Technology Market Revenue billion Forecast, by Package Technology 2020 & 2033
- Table 64: Global System in Package Technology Market Volume K Unit Forecast, by Package Technology 2020 & 2033
- Table 65: Global System in Package Technology Market Revenue billion Forecast, by Packaging Method 2020 & 2033
- Table 66: Global System in Package Technology Market Volume K Unit Forecast, by Packaging Method 2020 & 2033
- Table 67: Global System in Package Technology Market Revenue billion Forecast, by Device 2020 & 2033
- Table 68: Global System in Package Technology Market Volume K Unit Forecast, by Device 2020 & 2033
- Table 69: Global System in Package Technology Market Revenue billion Forecast, by Application 2020 & 2033
- Table 70: Global System in Package Technology Market Volume K Unit Forecast, by Application 2020 & 2033
- Table 71: Global System in Package Technology Market Revenue billion Forecast, by Country 2020 & 2033
- Table 72: Global System in Package Technology Market Volume K Unit Forecast, by Country 2020 & 2033
Frequently Asked Questions
1. What is the projected Compound Annual Growth Rate (CAGR) of the System in Package Technology Market?
The projected CAGR is approximately 6.8%.
2. Which companies are prominent players in the System in Package Technology Market?
Key companies in the market include Powertech Technologies Inc, Toshiba Corporation, Fujitsu Ltd, Freescale Semiconductor Inc , ASE Group, Jiangsu Changjiang Electronics Technology Co Ltd, Samsung Electronics Co Ltd, Renesas Electronics Corporation, Siliconware Precision Industries Co, Amkor Technology Inc, Qualcomm, ChipMOS Technologies Inc.
3. What are the main segments of the System in Package Technology Market?
The market segments include Package, Package Technology, Packaging Method, Device, Application.
4. Can you provide details about the market size?
The market size is estimated to be USD 11.88 billion as of 2022.
5. What are some drivers contributing to market growth?
; Growing demand for miniaturization of electronic devices; Rapid Technological Advances Led to Cost Reduction.
6. What are the notable trends driving market growth?
Automotive Industry Will Witness Significant Growth.
7. Are there any restraints impacting market growth?
; Thermal Issues Due to Higher level of Integration.
8. Can you provide examples of recent developments in the market?
N/A
9. What pricing options are available for accessing the report?
Pricing options include single-user, multi-user, and enterprise licenses priced at USD 4750, USD 5250, and USD 8750 respectively.
10. Is the market size provided in terms of value or volume?
The market size is provided in terms of value, measured in billion and volume, measured in K Unit.
11. Are there any specific market keywords associated with the report?
Yes, the market keyword associated with the report is "System in Package Technology Market," which aids in identifying and referencing the specific market segment covered.
12. How do I determine which pricing option suits my needs best?
The pricing options vary based on user requirements and access needs. Individual users may opt for single-user licenses, while businesses requiring broader access may choose multi-user or enterprise licenses for cost-effective access to the report.
13. Are there any additional resources or data provided in the System in Package Technology Market report?
While the report offers comprehensive insights, it's advisable to review the specific contents or supplementary materials provided to ascertain if additional resources or data are available.
14. How can I stay updated on further developments or reports in the System in Package Technology Market?
To stay informed about further developments, trends, and reports in the System in Package Technology Market, consider subscribing to industry newsletters, following relevant companies and organizations, or regularly checking reputable industry news sources and publications.
Methodology
Step 1 - Identification of Relevant Samples Size from Population Database


Step 2 - Approaches for Defining Global Market Size (Value, Volume* & Price*)

Note*: In applicable scenarios
Step 3 - Data Sources
Primary Research
- Web Analytics
- Survey Reports
- Research Institute
- Latest Research Reports
- Opinion Leaders
Secondary Research
- Annual Reports
- White Paper
- Latest Press Release
- Industry Association
- Paid Database
- Investor Presentations

Step 4 - Data Triangulation
Involves using different sources of information in order to increase the validity of a study
These sources are likely to be stakeholders in a program - participants, other researchers, program staff, other community members, and so on.
Then we put all data in single framework & apply various statistical tools to find out the dynamic on the market.
During the analysis stage, feedback from the stakeholder groups would be compared to determine areas of agreement as well as areas of divergence