

Key Insights
The Physical Vapor Deposition (PVD) equipment market is poised for significant expansion, driven by escalating demand across microelectronics, medical devices, and solar energy sectors. Projections indicate a Compound Annual Growth Rate (CAGR) of 8.98%, with the market size expected to reach 27.65 billion by the base year 2025. This growth trajectory is underpinned by the relentless miniaturization in electronics, advancements in medical device coatings, and the renewable energy sector's need for efficient solar panel technology. Innovations in PVD techniques, enhancing coating quality and deposition rates, further propel market development. While initial investment costs and environmental considerations pose challenges, the market outlook remains strongly positive. The microelectronics sector leads in end-user adoption, followed by medical devices and solar products. North America and Asia-Pacific are anticipated to maintain their dominance due to robust manufacturing and technological innovation.
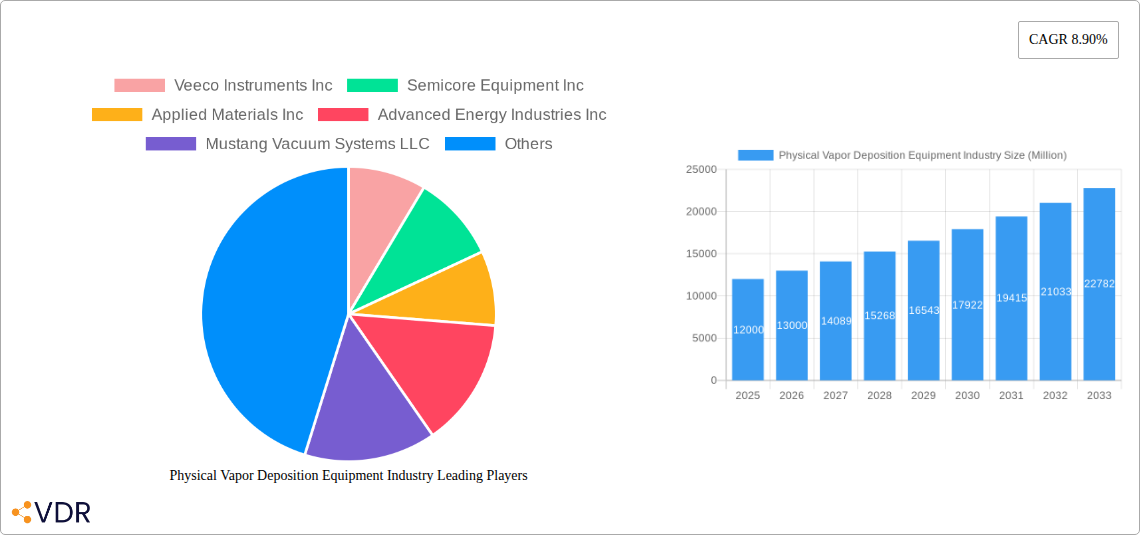
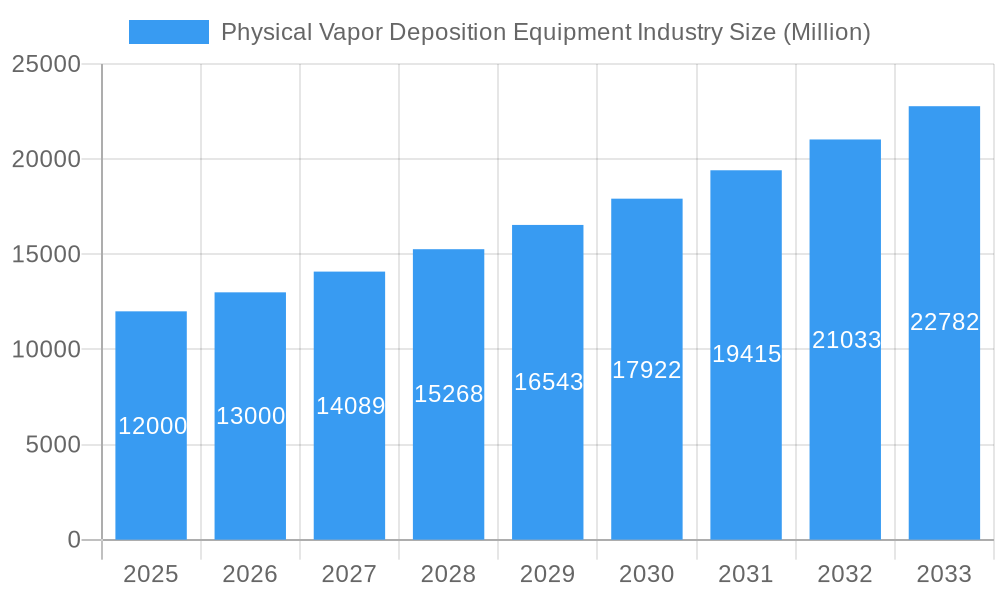
Physical Vapor Deposition Equipment Industry Market Size (In Billion)
Continued market growth will be supported by the adoption of advanced materials requiring PVD coatings and increasing demand for high-performance coatings in diverse applications. The development of eco-friendly PVD processes and materials will address existing restraints and foster sustainable expansion. Increased R&D investments will drive the emergence of more efficient and versatile PVD equipment. Emerging economies in Asia-Pacific and South America are expected to witness substantial market growth due to industrialization and infrastructure development. Technological advancements, cost optimization, and strategic partnerships will define competitive strategies moving forward.
Physical Vapor Deposition Equipment Industry Company Market Share
Physical Vapor Deposition (PVD) Equipment Market Report: 2019-2033
This comprehensive report provides an in-depth analysis of the Physical Vapor Deposition (PVD) equipment market, encompassing market dynamics, growth trends, regional analysis, competitive landscape, and future outlook. The study period covers 2019-2033, with 2025 as the base and estimated year. The forecast period extends from 2025 to 2033, and the historical period encompasses 2019-2024. The market is segmented by end-user: Microelectronics, Medical Devices and Equipment, Solar Products, and Other End Users. Key players include Veeco Instruments Inc, Semicore Equipment Inc, Applied Materials Inc, Advanced Energy Industries Inc, Mustang Vacuum Systems LLC, IHI Corporation, ULVAC Inc, Platit AG, Angstrom Engineering Inc, AJA International Inc, and Oerlikon Balzers Coating AG. The total market size in 2025 is estimated at xx Million.
Physical Vapor Deposition Equipment Industry Market Dynamics & Structure
The PVD equipment market is characterized by moderate concentration, with a few major players holding significant market share. Technological innovation, driven by the need for improved thin-film deposition techniques, is a key driver. Stringent regulatory frameworks concerning environmental impact and material safety influence manufacturing processes. Competitive substitutes, such as Chemical Vapor Deposition (CVD) systems, exist but PVD holds advantages in specific applications. The end-user demographics are diverse, with significant demand from microelectronics, medical, and solar industries. M&A activity has been moderate, with consolidation primarily occurring among smaller players.
- Market Concentration: Moderately concentrated, with the top 5 players holding approximately xx% of the market share in 2025.
- Technological Innovation: Focus on improving deposition rate, film uniformity, and scalability.
- Regulatory Framework: Emphasis on reducing waste and emissions, impacting equipment design and operational costs.
- Competitive Substitutes: CVD systems pose competition, but PVD retains its edge in specific applications due to superior film quality in certain instances.
- End-User Demographics: High growth in microelectronics and medical device sectors driving demand.
- M&A Trends: Consolidation among smaller players to improve market share and R&D capabilities. xx M&A deals occurred between 2019 and 2024.
Physical Vapor Deposition Equipment Industry Growth Trends & Insights
The PVD equipment market exhibited a CAGR of xx% during the historical period (2019-2024) and is projected to grow at a CAGR of xx% during the forecast period (2025-2033). This growth is fueled by increasing demand from the microelectronics industry, driven by the rising adoption of advanced semiconductor devices and the ongoing miniaturization of electronics. The medical device sector also contributes significantly, with increasing use of PVD coatings for improved biocompatibility and durability of implants. Technological advancements, such as the development of high-throughput systems and advanced materials, further drive market growth. Consumer behavior shifts towards more sophisticated and durable products have boosted the demand for advanced thin-film coatings. Market penetration in emerging economies is expected to increase substantially over the forecast period.
Dominant Regions, Countries, or Segments in Physical Vapor Deposition Equipment Industry
The North American region dominated the PVD equipment market in 2025, accounting for approximately xx% of the global market share. This dominance is attributed to the strong presence of major players, high R&D spending, and robust microelectronics and medical device industries. Asia Pacific is expected to witness the fastest growth during the forecast period, driven by increasing semiconductor manufacturing capacity in countries like China, South Korea, and Taiwan. Within end-user segments, microelectronics is the largest segment, accounting for xx% of the market in 2025, followed by medical devices and equipment.
- North America: Strong presence of major players, advanced technology adoption, robust end-user industries.
- Asia Pacific: Rapid growth driven by expanding semiconductor manufacturing and government support.
- Europe: Steady growth, driven by medical devices and specialized applications.
- Microelectronics Segment: Largest segment driven by high demand for advanced semiconductor devices.
- Medical Devices and Equipment Segment: Growing steadily driven by increased demand for improved biocompatible implants and tools.
Physical Vapor Deposition Equipment Industry Product Landscape
The PVD equipment market offers a wide range of products, from sputtering systems and evaporation systems to ion plating and pulsed laser deposition systems. Innovations focus on enhancing deposition rate, film quality, and process control. Unique selling propositions include improved process efficiency, reduced material waste, and enhanced film properties such as hardness, wear resistance, and corrosion resistance. Advancements in process automation and integration with other manufacturing equipment are also significant.
Key Drivers, Barriers & Challenges in Physical Vapor Deposition Equipment Industry
Key Drivers:
- Increasing demand for advanced thin-film coatings in various applications.
- Technological advancements leading to higher deposition rates and improved film quality.
- Growing investment in R&D and innovation within the semiconductor and medical device industries.
Key Challenges:
- High initial investment costs associated with PVD equipment.
- Stringent regulatory compliance requirements regarding environmental and safety standards.
- Intense competition from existing players and the emergence of new technologies. This competition is estimated to reduce market growth by approximately xx% by 2033.
Emerging Opportunities in Physical Vapor Deposition Equipment Industry
- Expansion into emerging markets, particularly in Asia Pacific and Latin America.
- Development of specialized PVD systems for niche applications, such as flexible electronics and energy storage.
- Growing demand for sustainable and environmentally friendly PVD technologies.
Growth Accelerators in the Physical Vapor Deposition Equipment Industry
Technological breakthroughs in deposition techniques, particularly those focusing on energy efficiency and material utilization, will be major growth catalysts. Strategic partnerships between equipment manufacturers and end-users will accelerate adoption and customization of PVD systems. Expansion into new and emerging applications, such as renewable energy and advanced materials, will unlock significant market potential.
Key Players Shaping the Physical Vapor Deposition Equipment Industry Market
- Veeco Instruments Inc
- Semicore Equipment Inc
- Applied Materials Inc
- Advanced Energy Industries Inc
- Mustang Vacuum Systems LLC
- IHI Corporation
- ULVAC Inc
- Platit AG
- Angstrom Engineering Inc
- AJA International Inc
- Oerlikon Balzers Coating AG
Notable Milestones in Physical Vapor Deposition Equipment Industry Sector
- 2020, Q3: Applied Materials Inc. launched a new high-throughput sputtering system.
- 2021, Q1: Veeco Instruments Inc. acquired a smaller PVD equipment manufacturer, expanding its product portfolio.
- 2022, Q4: A significant industry-wide collaboration launched a new initiative focusing on sustainability in PVD technology.
- 2023, Q2: New regulations regarding waste management impacted the manufacturing process of several key players.
In-Depth Physical Vapor Deposition Equipment Industry Market Outlook
The PVD equipment market is poised for sustained growth, driven by ongoing technological advancements, increasing demand from key end-user segments, and expansion into new markets. Strategic partnerships and investments in R&D will further enhance market dynamics. The focus on sustainability and efficient manufacturing processes will continue to shape the industry landscape, leading to significant opportunities for innovative players. The market is predicted to reach xx Million by 2033.
Physical Vapor Deposition Equipment Industry Segmentation
-
1. End User
- 1.1. Microelectronics
- 1.2. Medical Devices and Equipment
- 1.3. Solar Products
- 1.4. Other End Users
Physical Vapor Deposition Equipment Industry Segmentation By Geography
- 1. North America
- 2. Europe
- 3. Asia Pacific
- 4. Rest of the World
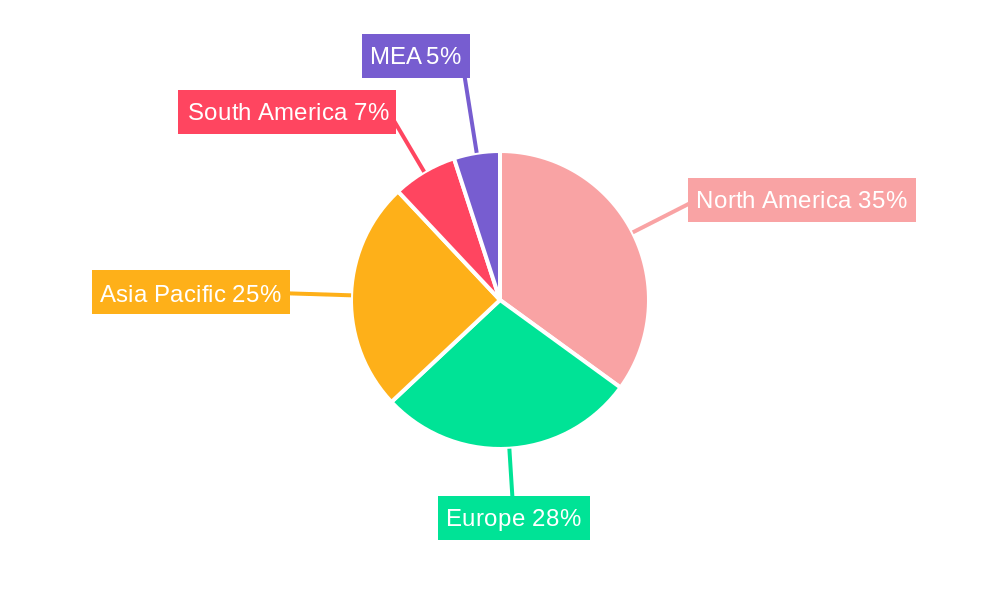
Physical Vapor Deposition Equipment Industry Regional Market Share
Geographic Coverage of Physical Vapor Deposition Equipment Industry
Physical Vapor Deposition Equipment Industry REPORT HIGHLIGHTS
| Aspects | Details |
|---|---|
| Study Period | 2020-2034 |
| Base Year | 2025 |
| Estimated Year | 2026 |
| Forecast Period | 2026-2034 |
| Historical Period | 2020-2025 |
| Growth Rate | CAGR of 8.98% from 2020-2034 |
| Segmentation |
|
Table of Contents
- 1. Introduction
- 1.1. Research Scope
- 1.2. Market Segmentation
- 1.3. Research Objective
- 1.4. Definitions and Assumptions
- 2. Executive Summary
- 2.1. Market Snapshot
- 3. Market Dynamics
- 3.1. Market Drivers
- 3.2. Market Restrains
- 3.3. Market Trends
- 3.4. Market Opportunities
- 4. Market Factor Analysis
- 4.1. Porters Five Forces
- 4.1.1. Bargaining Power of Suppliers
- 4.1.2. Bargaining Power of Buyers
- 4.1.3. Threat of New Entrants
- 4.1.4. Threat of Substitutes
- 4.1.5. Competitive Rivalry
- 4.2. PESTEL analysis
- 4.3. BCG Analysis
- 4.3.1. Stars (High Growth, High Market Share)
- 4.3.2. Cash Cows (Low Growth, High Market Share)
- 4.3.3. Question Mark (High Growth, Low Market Share)
- 4.3.4. Dogs (Low Growth, Low Market Share)
- 4.4. Ansoff Matrix Analysis
- 4.5. Supply Chain Analysis
- 4.6. Regulatory Landscape
- 4.7. Current Market Potential and Opportunity Assessment (TAM–SAM–SOM Framework)
- 4.8. VDR Analyst Note
- 4.1. Porters Five Forces
- 5. Market Analysis, Insights and Forecast 2021-2033
- 5.1. Market Analysis, Insights and Forecast - by End User
- 5.1.1. Microelectronics
- 5.1.2. Medical Devices and Equipment
- 5.1.3. Solar Products
- 5.1.4. Other End Users
- 5.2. Market Analysis, Insights and Forecast - by Region
- 5.2.1. North America
- 5.2.2. Europe
- 5.2.3. Asia Pacific
- 5.2.4. Rest of the World
- 5.1. Market Analysis, Insights and Forecast - by End User
- 6. Global Physical Vapor Deposition Equipment Industry Analysis, Insights and Forecast, 2021-2033
- 6.1. Market Analysis, Insights and Forecast - by End User
- 6.1.1. Microelectronics
- 6.1.2. Medical Devices and Equipment
- 6.1.3. Solar Products
- 6.1.4. Other End Users
- 6.1. Market Analysis, Insights and Forecast - by End User
- 7. North America Physical Vapor Deposition Equipment Industry Analysis, Insights and Forecast, 2021-2033
- 7.1. Market Analysis, Insights and Forecast - by End User
- 7.1.1. Microelectronics
- 7.1.2. Medical Devices and Equipment
- 7.1.3. Solar Products
- 7.1.4. Other End Users
- 7.1. Market Analysis, Insights and Forecast - by End User
- 8. Europe Physical Vapor Deposition Equipment Industry Analysis, Insights and Forecast, 2021-2033
- 8.1. Market Analysis, Insights and Forecast - by End User
- 8.1.1. Microelectronics
- 8.1.2. Medical Devices and Equipment
- 8.1.3. Solar Products
- 8.1.4. Other End Users
- 8.1. Market Analysis, Insights and Forecast - by End User
- 9. Asia Pacific Physical Vapor Deposition Equipment Industry Analysis, Insights and Forecast, 2021-2033
- 9.1. Market Analysis, Insights and Forecast - by End User
- 9.1.1. Microelectronics
- 9.1.2. Medical Devices and Equipment
- 9.1.3. Solar Products
- 9.1.4. Other End Users
- 9.1. Market Analysis, Insights and Forecast - by End User
- 10. Rest of the World Physical Vapor Deposition Equipment Industry Analysis, Insights and Forecast, 2021-2033
- 10.1. Market Analysis, Insights and Forecast - by End User
- 10.1.1. Microelectronics
- 10.1.2. Medical Devices and Equipment
- 10.1.3. Solar Products
- 10.1.4. Other End Users
- 10.1. Market Analysis, Insights and Forecast - by End User
- 11. Competitive Analysis
- 11.1. Company Profiles
- 11.1.1 Veeco Instruments Inc
- 11.1.1.1. Company Overview
- 11.1.1.2. Products
- 11.1.1.3. Company Financials
- 11.1.1.4. SWOT Analysis
- 11.1.2 Semicore Equipment Inc
- 11.1.2.1. Company Overview
- 11.1.2.2. Products
- 11.1.2.3. Company Financials
- 11.1.2.4. SWOT Analysis
- 11.1.3 Applied Materials Inc
- 11.1.3.1. Company Overview
- 11.1.3.2. Products
- 11.1.3.3. Company Financials
- 11.1.3.4. SWOT Analysis
- 11.1.4 Advanced Energy Industries Inc
- 11.1.4.1. Company Overview
- 11.1.4.2. Products
- 11.1.4.3. Company Financials
- 11.1.4.4. SWOT Analysis
- 11.1.5 Mustang Vacuum Systems LLC
- 11.1.5.1. Company Overview
- 11.1.5.2. Products
- 11.1.5.3. Company Financials
- 11.1.5.4. SWOT Analysis
- 11.1.6 IHI Corporatio
- 11.1.6.1. Company Overview
- 11.1.6.2. Products
- 11.1.6.3. Company Financials
- 11.1.6.4. SWOT Analysis
- 11.1.7 ULVAC Inc
- 11.1.7.1. Company Overview
- 11.1.7.2. Products
- 11.1.7.3. Company Financials
- 11.1.7.4. SWOT Analysis
- 11.1.8 Platit AG
- 11.1.8.1. Company Overview
- 11.1.8.2. Products
- 11.1.8.3. Company Financials
- 11.1.8.4. SWOT Analysis
- 11.1.9 Angstrom Engineering Inc
- 11.1.9.1. Company Overview
- 11.1.9.2. Products
- 11.1.9.3. Company Financials
- 11.1.9.4. SWOT Analysis
- 11.1.10 AJA International Inc
- 11.1.10.1. Company Overview
- 11.1.10.2. Products
- 11.1.10.3. Company Financials
- 11.1.10.4. SWOT Analysis
- 11.1.11 Oerlikon Balzers Coating AG
- 11.1.11.1. Company Overview
- 11.1.11.2. Products
- 11.1.11.3. Company Financials
- 11.1.11.4. SWOT Analysis
- 11.1.1 Veeco Instruments Inc
- 11.2. Market Entropy
- 11.2.1 Company's Key Areas Served
- 11.2.2 Recent Developments
- 11.3. Company Market Share Analysis 2025
- 11.3.1 Top 5 Companies Market Share Analysis
- 11.3.2 Top 3 Companies Market Share Analysis
- 11.4. List of Potential Customers
- 12. Research Methodology
List of Figures
- Figure 1: Global Physical Vapor Deposition Equipment Industry Revenue Breakdown (billion, %) by Region 2025 & 2033
- Figure 2: Global Physical Vapor Deposition Equipment Industry Volume Breakdown (K Unit, %) by Region 2025 & 2033
- Figure 3: North America Physical Vapor Deposition Equipment Industry Revenue (billion), by End User 2025 & 2033
- Figure 4: North America Physical Vapor Deposition Equipment Industry Volume (K Unit), by End User 2025 & 2033
- Figure 5: North America Physical Vapor Deposition Equipment Industry Revenue Share (%), by End User 2025 & 2033
- Figure 6: North America Physical Vapor Deposition Equipment Industry Volume Share (%), by End User 2025 & 2033
- Figure 7: North America Physical Vapor Deposition Equipment Industry Revenue (billion), by Country 2025 & 2033
- Figure 8: North America Physical Vapor Deposition Equipment Industry Volume (K Unit), by Country 2025 & 2033
- Figure 9: North America Physical Vapor Deposition Equipment Industry Revenue Share (%), by Country 2025 & 2033
- Figure 10: North America Physical Vapor Deposition Equipment Industry Volume Share (%), by Country 2025 & 2033
- Figure 11: Europe Physical Vapor Deposition Equipment Industry Revenue (billion), by End User 2025 & 2033
- Figure 12: Europe Physical Vapor Deposition Equipment Industry Volume (K Unit), by End User 2025 & 2033
- Figure 13: Europe Physical Vapor Deposition Equipment Industry Revenue Share (%), by End User 2025 & 2033
- Figure 14: Europe Physical Vapor Deposition Equipment Industry Volume Share (%), by End User 2025 & 2033
- Figure 15: Europe Physical Vapor Deposition Equipment Industry Revenue (billion), by Country 2025 & 2033
- Figure 16: Europe Physical Vapor Deposition Equipment Industry Volume (K Unit), by Country 2025 & 2033
- Figure 17: Europe Physical Vapor Deposition Equipment Industry Revenue Share (%), by Country 2025 & 2033
- Figure 18: Europe Physical Vapor Deposition Equipment Industry Volume Share (%), by Country 2025 & 2033
- Figure 19: Asia Pacific Physical Vapor Deposition Equipment Industry Revenue (billion), by End User 2025 & 2033
- Figure 20: Asia Pacific Physical Vapor Deposition Equipment Industry Volume (K Unit), by End User 2025 & 2033
- Figure 21: Asia Pacific Physical Vapor Deposition Equipment Industry Revenue Share (%), by End User 2025 & 2033
- Figure 22: Asia Pacific Physical Vapor Deposition Equipment Industry Volume Share (%), by End User 2025 & 2033
- Figure 23: Asia Pacific Physical Vapor Deposition Equipment Industry Revenue (billion), by Country 2025 & 2033
- Figure 24: Asia Pacific Physical Vapor Deposition Equipment Industry Volume (K Unit), by Country 2025 & 2033
- Figure 25: Asia Pacific Physical Vapor Deposition Equipment Industry Revenue Share (%), by Country 2025 & 2033
- Figure 26: Asia Pacific Physical Vapor Deposition Equipment Industry Volume Share (%), by Country 2025 & 2033
- Figure 27: Rest of the World Physical Vapor Deposition Equipment Industry Revenue (billion), by End User 2025 & 2033
- Figure 28: Rest of the World Physical Vapor Deposition Equipment Industry Volume (K Unit), by End User 2025 & 2033
- Figure 29: Rest of the World Physical Vapor Deposition Equipment Industry Revenue Share (%), by End User 2025 & 2033
- Figure 30: Rest of the World Physical Vapor Deposition Equipment Industry Volume Share (%), by End User 2025 & 2033
- Figure 31: Rest of the World Physical Vapor Deposition Equipment Industry Revenue (billion), by Country 2025 & 2033
- Figure 32: Rest of the World Physical Vapor Deposition Equipment Industry Volume (K Unit), by Country 2025 & 2033
- Figure 33: Rest of the World Physical Vapor Deposition Equipment Industry Revenue Share (%), by Country 2025 & 2033
- Figure 34: Rest of the World Physical Vapor Deposition Equipment Industry Volume Share (%), by Country 2025 & 2033
List of Tables
- Table 1: Global Physical Vapor Deposition Equipment Industry Revenue billion Forecast, by End User 2020 & 2033
- Table 2: Global Physical Vapor Deposition Equipment Industry Volume K Unit Forecast, by End User 2020 & 2033
- Table 3: Global Physical Vapor Deposition Equipment Industry Revenue billion Forecast, by Region 2020 & 2033
- Table 4: Global Physical Vapor Deposition Equipment Industry Volume K Unit Forecast, by Region 2020 & 2033
- Table 5: Global Physical Vapor Deposition Equipment Industry Revenue billion Forecast, by End User 2020 & 2033
- Table 6: Global Physical Vapor Deposition Equipment Industry Volume K Unit Forecast, by End User 2020 & 2033
- Table 7: Global Physical Vapor Deposition Equipment Industry Revenue billion Forecast, by Country 2020 & 2033
- Table 8: Global Physical Vapor Deposition Equipment Industry Volume K Unit Forecast, by Country 2020 & 2033
- Table 9: Global Physical Vapor Deposition Equipment Industry Revenue billion Forecast, by End User 2020 & 2033
- Table 10: Global Physical Vapor Deposition Equipment Industry Volume K Unit Forecast, by End User 2020 & 2033
- Table 11: Global Physical Vapor Deposition Equipment Industry Revenue billion Forecast, by Country 2020 & 2033
- Table 12: Global Physical Vapor Deposition Equipment Industry Volume K Unit Forecast, by Country 2020 & 2033
- Table 13: Global Physical Vapor Deposition Equipment Industry Revenue billion Forecast, by End User 2020 & 2033
- Table 14: Global Physical Vapor Deposition Equipment Industry Volume K Unit Forecast, by End User 2020 & 2033
- Table 15: Global Physical Vapor Deposition Equipment Industry Revenue billion Forecast, by Country 2020 & 2033
- Table 16: Global Physical Vapor Deposition Equipment Industry Volume K Unit Forecast, by Country 2020 & 2033
- Table 17: Global Physical Vapor Deposition Equipment Industry Revenue billion Forecast, by End User 2020 & 2033
- Table 18: Global Physical Vapor Deposition Equipment Industry Volume K Unit Forecast, by End User 2020 & 2033
- Table 19: Global Physical Vapor Deposition Equipment Industry Revenue billion Forecast, by Country 2020 & 2033
- Table 20: Global Physical Vapor Deposition Equipment Industry Volume K Unit Forecast, by Country 2020 & 2033
Frequently Asked Questions
1. What is the projected Compound Annual Growth Rate (CAGR) of the Physical Vapor Deposition Equipment Industry?
The projected CAGR is approximately 8.98%.
2. Which companies are prominent players in the Physical Vapor Deposition Equipment Industry?
Key companies in the market include Veeco Instruments Inc, Semicore Equipment Inc, Applied Materials Inc, Advanced Energy Industries Inc, Mustang Vacuum Systems LLC, IHI Corporatio, ULVAC Inc, Platit AG, Angstrom Engineering Inc, AJA International Inc, Oerlikon Balzers Coating AG.
3. What are the main segments of the Physical Vapor Deposition Equipment Industry?
The market segments include End User.
4. Can you provide details about the market size?
The market size is estimated to be USD 27.65 billion as of 2022.
5. What are some drivers contributing to market growth?
; Rise in the Demand for Medical Devices and Equipment; Growing Demand for Microelectronics in Several Applications.
6. What are the notable trends driving market growth?
Medical Devices and Equipment is Expected to Boost the Market Growth.
7. Are there any restraints impacting market growth?
; High Capital Investment.
8. Can you provide examples of recent developments in the market?
N/A
9. What pricing options are available for accessing the report?
Pricing options include single-user, multi-user, and enterprise licenses priced at USD 4750, USD 5250, and USD 8750 respectively.
10. Is the market size provided in terms of value or volume?
The market size is provided in terms of value, measured in billion and volume, measured in K Unit.
11. Are there any specific market keywords associated with the report?
Yes, the market keyword associated with the report is "Physical Vapor Deposition Equipment Industry," which aids in identifying and referencing the specific market segment covered.
12. How do I determine which pricing option suits my needs best?
The pricing options vary based on user requirements and access needs. Individual users may opt for single-user licenses, while businesses requiring broader access may choose multi-user or enterprise licenses for cost-effective access to the report.
13. Are there any additional resources or data provided in the Physical Vapor Deposition Equipment Industry report?
While the report offers comprehensive insights, it's advisable to review the specific contents or supplementary materials provided to ascertain if additional resources or data are available.
14. How can I stay updated on further developments or reports in the Physical Vapor Deposition Equipment Industry?
To stay informed about further developments, trends, and reports in the Physical Vapor Deposition Equipment Industry, consider subscribing to industry newsletters, following relevant companies and organizations, or regularly checking reputable industry news sources and publications.
Methodology
Step 1 - Identification of Relevant Samples Size from Population Database


Step 2 - Approaches for Defining Global Market Size (Value, Volume* & Price*)

Note*: In applicable scenarios
Step 3 - Data Sources
Primary Research
- Web Analytics
- Survey Reports
- Research Institute
- Latest Research Reports
- Opinion Leaders
Secondary Research
- Annual Reports
- White Paper
- Latest Press Release
- Industry Association
- Paid Database
- Investor Presentations

Step 4 - Data Triangulation
Involves using different sources of information in order to increase the validity of a study
These sources are likely to be stakeholders in a program - participants, other researchers, program staff, other community members, and so on.
Then we put all data in single framework & apply various statistical tools to find out the dynamic on the market.
During the analysis stage, feedback from the stakeholder groups would be compared to determine areas of agreement as well as areas of divergence