

Key Insights
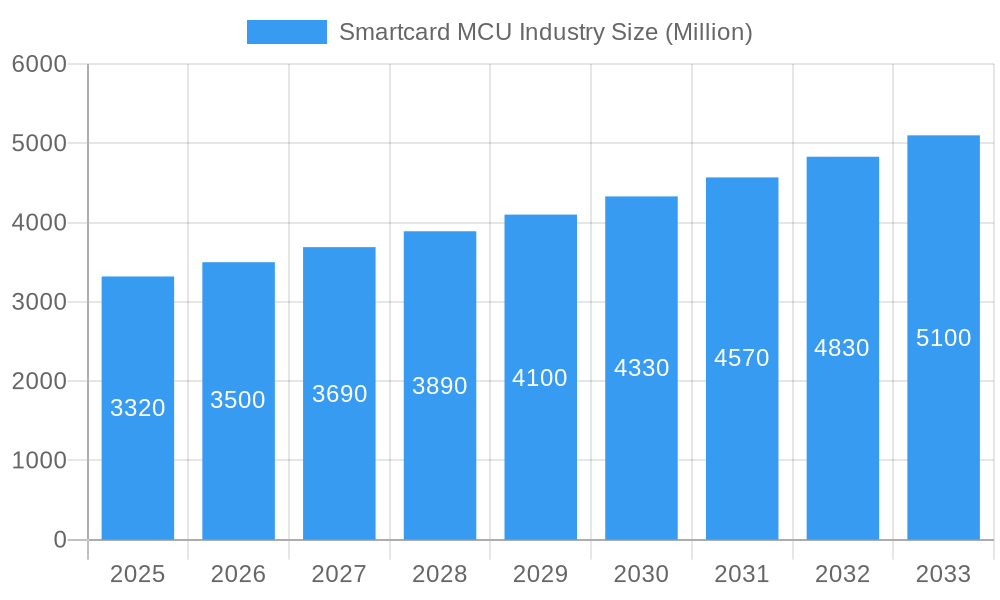
The smartcard MCU market, valued at $3.32 billion in 2025, is projected to experience robust growth, driven by the increasing adoption of contactless payment systems, the expansion of digital identification solutions, and the rising demand for secure authentication in various sectors. The market's Compound Annual Growth Rate (CAGR) of 5.29% from 2025 to 2033 indicates a steady expansion, fueled by technological advancements in microcontroller architecture, enhanced security features, and miniaturization. The 32-bit segment is expected to dominate due to its superior processing power and memory capacity, accommodating increasingly complex applications. Within functionality, transaction processing and security/access control segments are key drivers, mirroring the growing emphasis on secure financial transactions and data protection. Geographically, North America and Europe currently hold significant market share, but Asia is poised for substantial growth driven by rapid digitalization and increasing smartphone penetration. Major players like Giesecke+Devrient, Infineon Technologies, and NXP Semiconductors are actively involved in product innovation and strategic partnerships to maintain their market positions.
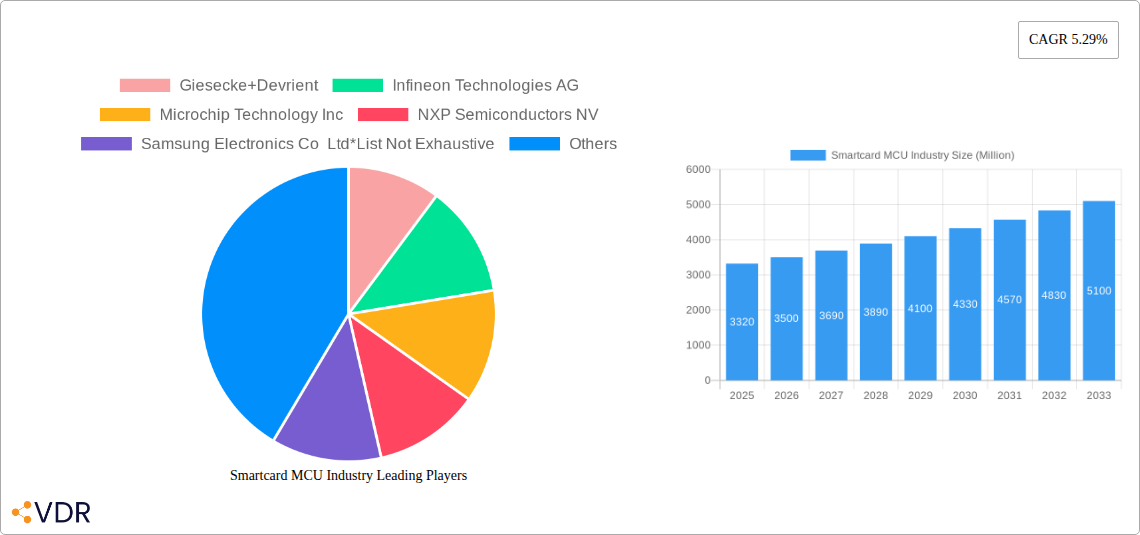
Smartcard MCU Industry Market Size (In Billion)
The market's growth trajectory is influenced by several factors. Government initiatives promoting digitalization and cashless transactions are significantly boosting demand. The increasing integration of smartcards in various IoT applications, such as access control systems and transportation ticketing, is creating new revenue streams. However, challenges remain; concerns regarding data security and privacy, alongside the potential for counterfeiting, could pose constraints on market growth. The continued development of robust security protocols and advanced encryption techniques will be crucial for mitigating these risks and fostering market expansion. The competitive landscape is characterized by both established players and emerging companies vying for market share through innovation and strategic acquisitions, fostering healthy competition and driving further market growth.
Smartcard MCU Industry Company Market Share
Smartcard MCU Industry Market Report: 2019-2033
This comprehensive report provides a detailed analysis of the Smartcard MCU industry, covering market dynamics, growth trends, regional segmentation, product landscape, key players, and future outlook. The report uses 2025 as its base year, with data spanning the historical period (2019-2024), the study period (2019-2033), and the forecast period (2025-2033). All values are presented in Million units.
Smartcard MCU Industry Market Dynamics & Structure
The Smartcard MCU market is characterized by a moderately concentrated landscape with key players such as Giesecke+Devrient, Infineon Technologies AG, Microchip Technology Inc, NXP Semiconductors NV, Samsung Electronics Co Ltd, STMicroelectronics, Zilog Inc, Renesas Electronics Corporation, Idemia Group, and Thales group holding significant market share. However, the entry of new players and technological advancements are fostering increased competition. The market is driven by the increasing demand for secure and efficient payment solutions across various end-user industries, coupled with ongoing technological innovation. Stringent regulatory frameworks focused on data security and privacy are influencing the adoption of advanced security features in smartcard MCUs. The rise of contactless payments and the expansion of IoT devices further fuel market growth.
- Market Concentration: Moderately concentrated, with top 10 players holding approximately xx% of the market share in 2024.
- Technological Innovation Drivers: Advancements in low-power consumption, enhanced security features (e.g., hardware-based encryption), and miniaturization.
- Regulatory Frameworks: Compliance with international security standards (e.g., EMVCo) and data privacy regulations (e.g., GDPR) is driving demand for sophisticated smartcard MCUs.
- Competitive Product Substitutes: Limited direct substitutes exist; however, software-based security solutions represent a potential indirect threat.
- End-User Demographics: Growth is fueled by rising adoption of smartcards in BFSI, telecommunications, government, healthcare, retail, and transportation sectors.
- M&A Trends: A moderate number of M&A deals (xx) were recorded between 2019 and 2024, primarily focused on enhancing technological capabilities and expanding market reach.
Smartcard MCU Industry Growth Trends & Insights
The Smartcard MCU market witnessed robust growth during the historical period (2019-2024), with a CAGR of xx%. This growth is attributed to increasing penetration of smartcards in various applications, driven by factors like the rising popularity of contactless payments, expanding digital infrastructure, and government initiatives promoting digitalization. Technological advancements, such as the introduction of more powerful and energy-efficient 32-bit MCUs, have further accelerated market expansion. Consumer behavior shifts towards cashless transactions and the growing adoption of secure identification systems are also significant contributors to market growth. The market is expected to continue its growth trajectory during the forecast period (2025-2033), with a projected CAGR of xx%, reaching xx Million units by 2033. This projection takes into account the expected growth in relevant end-user industries and the ongoing technological advancements in the smartcard MCU space. Market penetration in developing economies remains a significant opportunity for future growth.
Dominant Regions, Countries, or Segments in Smartcard MCU Industry
North America and Europe currently dominate the Smartcard MCU market, driven by high levels of digitalization and robust adoption of contactless payment technologies. However, Asia-Pacific is poised for significant growth due to its expanding economies, burgeoning middle class, and increasing smartphone penetration.
By Product: The 8-bit segment held the largest market share in 2024 (xx%), followed by 16-bit (xx%) and 32-bit (xx%). However, the 32-bit segment is projected to exhibit the highest CAGR during the forecast period, driven by increasing demand for sophisticated security features and enhanced processing capabilities.
By Functionality: The transaction segment is the largest, but the security and access control segment is experiencing the fastest growth, fueled by the increasing focus on data security and privacy.
By End-user Industry: BFSI, Telecommunications and Government sectors are the leading end-user industries, driven by high adoption of smartcards for payments, SIM cards, and national ID programs, respectively. The healthcare and retail sectors are also showing significant growth potential.
- Key Drivers:
- Robust growth of digital payment systems and contactless transactions.
- Expanding adoption of smartcards in various sectors like government, healthcare, and transportation.
- Growing demand for enhanced security features in smartcards.
- Favorable government regulations and initiatives promoting digitalization.
- Dominance Factors: North America and Europe benefit from strong digital infrastructure and high per capita spending on technology. Asia-Pacific's growth is driven by rising smartphone usage and increasing financial inclusion.
Smartcard MCU Industry Product Landscape
Smartcard MCUs are evolving towards greater integration, incorporating advanced security features like hardware-based encryption and secure elements. New products offer improved performance metrics, including lower power consumption, faster processing speeds, and enhanced communication capabilities. Unique selling propositions include increased memory capacity, enhanced security, and improved compatibility with various communication protocols. Technological advancements are focused on miniaturization, energy efficiency, and the integration of multiple functionalities within a single chip, reducing cost and complexity for manufacturers.
Key Drivers, Barriers & Challenges in Smartcard MCU Industry
Key Drivers: The primary drivers include the increasing demand for secure transactions, the rising adoption of contactless payments, the expansion of the IoT market, and government initiatives promoting digitalization. Technological advancements, such as the development of more secure and efficient MCUs, are also key drivers.
Key Challenges & Restraints: Challenges include the stringent regulatory environment, competition from alternative technologies, potential supply chain disruptions, and the need for ongoing investment in research and development to keep pace with technological advancements. The impact of these challenges on market growth is estimated to be xx% annually.
Emerging Opportunities in Smartcard MCU Industry
Emerging opportunities lie in the expanding adoption of smartcards in the healthcare sector for patient identification and medical record management, the rise of IoT devices, and the growth of biometric authentication systems. Untapped markets in developing economies represent significant potential for growth. Innovative applications such as secure access control systems and smart city initiatives are creating new demand.
Growth Accelerators in the Smartcard MCU Industry
Long-term growth will be accelerated by the continued development of advanced security features, the increasing demand for energy-efficient devices, and the expansion into new applications and markets. Strategic partnerships between MCU manufacturers and system integrators will play a critical role in driving market growth. The development of highly integrated solutions that combine multiple functionalities onto a single chip will reduce costs and complexity.
Key Players Shaping the Smartcard MCU Industry Market
- Giesecke+Devrient
- Infineon Technologies AG
- Microchip Technology Inc
- NXP Semiconductors NV
- Samsung Electronics Co Ltd
- STMicroelectronics
- Zilog Inc
- Renesas Electronics Corporation
- Idemia Group
- Thales group
Notable Milestones in Smartcard MCU Industry Sector
- April 2023: STMicroelectronics launched the STR71xF series of microcontrollers based on the ARM7 Thumb core, expanding its presence in the 32-bit MCU market.
- March 2023: NXP introduced the PN7642 chip, integrating a microcontroller, NFC front-end, and security features into a single IC, simplifying NFC-based system designs.
In-Depth Smartcard MCU Industry Market Outlook
The Smartcard MCU market is poised for sustained growth, driven by increasing demand from diverse sectors and technological advancements focused on enhanced security and miniaturization. Strategic opportunities exist in developing innovative applications, forging strategic partnerships, and tapping into the growth potential of emerging markets. The focus on cost-effective, highly secure, and energy-efficient solutions will be paramount in driving future market success.
Smartcard MCU Industry Segmentation
-
1. Product
- 1.1. 8-bit
- 1.2. 16-bit
- 1.3. 32-bit
-
2. Functionality
- 2.1. Transaction
- 2.2. Communication
- 2.3. Security and Access Control
-
3. End-user Industry
- 3.1. BFSI
- 3.2. Telecommunications
- 3.3. Government and Healthcare
- 3.4. Education
- 3.5. Retail
- 3.6. Transportation
- 3.7. Other End-User Industries
Smartcard MCU Industry Segmentation By Geography
- 1. North America
- 2. Europe
- 3. Asia
- 4. Australia and New Zealand
- 5. Latin America
- 6. Middle East and Africa
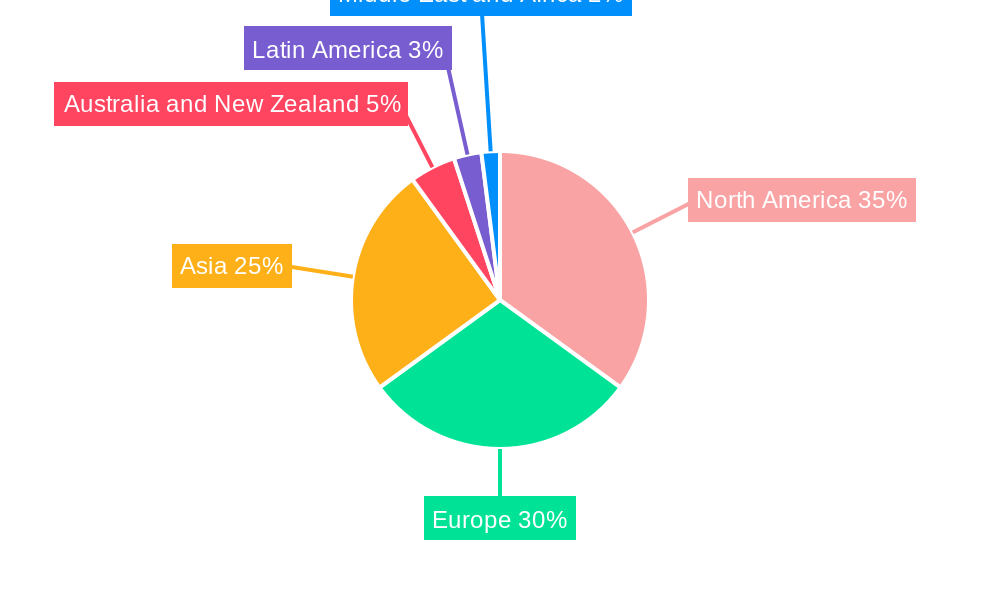
Smartcard MCU Industry Regional Market Share
Geographic Coverage of Smartcard MCU Industry
Smartcard MCU Industry REPORT HIGHLIGHTS
| Aspects | Details |
|---|---|
| Study Period | 2020-2034 |
| Base Year | 2025 |
| Estimated Year | 2026 |
| Forecast Period | 2026-2034 |
| Historical Period | 2020-2025 |
| Growth Rate | CAGR of 5.29% from 2020-2034 |
| Segmentation |
|
Table of Contents
- 1. Introduction
- 1.1. Research Scope
- 1.2. Market Segmentation
- 1.3. Research Objective
- 1.4. Definitions and Assumptions
- 2. Executive Summary
- 2.1. Market Snapshot
- 3. Market Dynamics
- 3.1. Market Drivers
- 3.2. Market Restrains
- 3.3. Market Trends
- 3.4. Market Opportunities
- 4. Market Factor Analysis
- 4.1. Porters Five Forces
- 4.1.1. Bargaining Power of Suppliers
- 4.1.2. Bargaining Power of Buyers
- 4.1.3. Threat of New Entrants
- 4.1.4. Threat of Substitutes
- 4.1.5. Competitive Rivalry
- 4.2. PESTEL analysis
- 4.3. BCG Analysis
- 4.3.1. Stars (High Growth, High Market Share)
- 4.3.2. Cash Cows (Low Growth, High Market Share)
- 4.3.3. Question Mark (High Growth, Low Market Share)
- 4.3.4. Dogs (Low Growth, Low Market Share)
- 4.4. Ansoff Matrix Analysis
- 4.5. Supply Chain Analysis
- 4.6. Regulatory Landscape
- 4.7. Current Market Potential and Opportunity Assessment (TAM–SAM–SOM Framework)
- 4.8. VDR Analyst Note
- 4.1. Porters Five Forces
- 5. Market Analysis, Insights and Forecast 2021-2033
- 5.1. Market Analysis, Insights and Forecast - by Product
- 5.1.1. 8-bit
- 5.1.2. 16-bit
- 5.1.3. 32-bit
- 5.2. Market Analysis, Insights and Forecast - by Functionality
- 5.2.1. Transaction
- 5.2.2. Communication
- 5.2.3. Security and Access Control
- 5.3. Market Analysis, Insights and Forecast - by End-user Industry
- 5.3.1. BFSI
- 5.3.2. Telecommunications
- 5.3.3. Government and Healthcare
- 5.3.4. Education
- 5.3.5. Retail
- 5.3.6. Transportation
- 5.3.7. Other End-User Industries
- 5.4. Market Analysis, Insights and Forecast - by Region
- 5.4.1. North America
- 5.4.2. Europe
- 5.4.3. Asia
- 5.4.4. Australia and New Zealand
- 5.4.5. Latin America
- 5.4.6. Middle East and Africa
- 5.1. Market Analysis, Insights and Forecast - by Product
- 6. Global Smartcard MCU Industry Analysis, Insights and Forecast, 2021-2033
- 6.1. Market Analysis, Insights and Forecast - by Product
- 6.1.1. 8-bit
- 6.1.2. 16-bit
- 6.1.3. 32-bit
- 6.2. Market Analysis, Insights and Forecast - by Functionality
- 6.2.1. Transaction
- 6.2.2. Communication
- 6.2.3. Security and Access Control
- 6.3. Market Analysis, Insights and Forecast - by End-user Industry
- 6.3.1. BFSI
- 6.3.2. Telecommunications
- 6.3.3. Government and Healthcare
- 6.3.4. Education
- 6.3.5. Retail
- 6.3.6. Transportation
- 6.3.7. Other End-User Industries
- 6.1. Market Analysis, Insights and Forecast - by Product
- 7. North America Smartcard MCU Industry Analysis, Insights and Forecast, 2021-2033
- 7.1. Market Analysis, Insights and Forecast - by Product
- 7.1.1. 8-bit
- 7.1.2. 16-bit
- 7.1.3. 32-bit
- 7.2. Market Analysis, Insights and Forecast - by Functionality
- 7.2.1. Transaction
- 7.2.2. Communication
- 7.2.3. Security and Access Control
- 7.3. Market Analysis, Insights and Forecast - by End-user Industry
- 7.3.1. BFSI
- 7.3.2. Telecommunications
- 7.3.3. Government and Healthcare
- 7.3.4. Education
- 7.3.5. Retail
- 7.3.6. Transportation
- 7.3.7. Other End-User Industries
- 7.1. Market Analysis, Insights and Forecast - by Product
- 8. Europe Smartcard MCU Industry Analysis, Insights and Forecast, 2021-2033
- 8.1. Market Analysis, Insights and Forecast - by Product
- 8.1.1. 8-bit
- 8.1.2. 16-bit
- 8.1.3. 32-bit
- 8.2. Market Analysis, Insights and Forecast - by Functionality
- 8.2.1. Transaction
- 8.2.2. Communication
- 8.2.3. Security and Access Control
- 8.3. Market Analysis, Insights and Forecast - by End-user Industry
- 8.3.1. BFSI
- 8.3.2. Telecommunications
- 8.3.3. Government and Healthcare
- 8.3.4. Education
- 8.3.5. Retail
- 8.3.6. Transportation
- 8.3.7. Other End-User Industries
- 8.1. Market Analysis, Insights and Forecast - by Product
- 9. Asia Smartcard MCU Industry Analysis, Insights and Forecast, 2021-2033
- 9.1. Market Analysis, Insights and Forecast - by Product
- 9.1.1. 8-bit
- 9.1.2. 16-bit
- 9.1.3. 32-bit
- 9.2. Market Analysis, Insights and Forecast - by Functionality
- 9.2.1. Transaction
- 9.2.2. Communication
- 9.2.3. Security and Access Control
- 9.3. Market Analysis, Insights and Forecast - by End-user Industry
- 9.3.1. BFSI
- 9.3.2. Telecommunications
- 9.3.3. Government and Healthcare
- 9.3.4. Education
- 9.3.5. Retail
- 9.3.6. Transportation
- 9.3.7. Other End-User Industries
- 9.1. Market Analysis, Insights and Forecast - by Product
- 10. Australia and New Zealand Smartcard MCU Industry Analysis, Insights and Forecast, 2021-2033
- 10.1. Market Analysis, Insights and Forecast - by Product
- 10.1.1. 8-bit
- 10.1.2. 16-bit
- 10.1.3. 32-bit
- 10.2. Market Analysis, Insights and Forecast - by Functionality
- 10.2.1. Transaction
- 10.2.2. Communication
- 10.2.3. Security and Access Control
- 10.3. Market Analysis, Insights and Forecast - by End-user Industry
- 10.3.1. BFSI
- 10.3.2. Telecommunications
- 10.3.3. Government and Healthcare
- 10.3.4. Education
- 10.3.5. Retail
- 10.3.6. Transportation
- 10.3.7. Other End-User Industries
- 10.1. Market Analysis, Insights and Forecast - by Product
- 11. Latin America Smartcard MCU Industry Analysis, Insights and Forecast, 2021-2033
- 11.1. Market Analysis, Insights and Forecast - by Product
- 11.1.1. 8-bit
- 11.1.2. 16-bit
- 11.1.3. 32-bit
- 11.2. Market Analysis, Insights and Forecast - by Functionality
- 11.2.1. Transaction
- 11.2.2. Communication
- 11.2.3. Security and Access Control
- 11.3. Market Analysis, Insights and Forecast - by End-user Industry
- 11.3.1. BFSI
- 11.3.2. Telecommunications
- 11.3.3. Government and Healthcare
- 11.3.4. Education
- 11.3.5. Retail
- 11.3.6. Transportation
- 11.3.7. Other End-User Industries
- 11.1. Market Analysis, Insights and Forecast - by Product
- 12. Middle East and Africa Smartcard MCU Industry Analysis, Insights and Forecast, 2021-2033
- 12.1. Market Analysis, Insights and Forecast - by Product
- 12.1.1. 8-bit
- 12.1.2. 16-bit
- 12.1.3. 32-bit
- 12.2. Market Analysis, Insights and Forecast - by Functionality
- 12.2.1. Transaction
- 12.2.2. Communication
- 12.2.3. Security and Access Control
- 12.3. Market Analysis, Insights and Forecast - by End-user Industry
- 12.3.1. BFSI
- 12.3.2. Telecommunications
- 12.3.3. Government and Healthcare
- 12.3.4. Education
- 12.3.5. Retail
- 12.3.6. Transportation
- 12.3.7. Other End-User Industries
- 12.1. Market Analysis, Insights and Forecast - by Product
- 13. Competitive Analysis
- 13.1. Company Profiles
- 13.1.1 Giesecke+Devrient
- 13.1.1.1. Company Overview
- 13.1.1.2. Products
- 13.1.1.3. Company Financials
- 13.1.1.4. SWOT Analysis
- 13.1.2 Infineon Technologies AG
- 13.1.2.1. Company Overview
- 13.1.2.2. Products
- 13.1.2.3. Company Financials
- 13.1.2.4. SWOT Analysis
- 13.1.3 Microchip Technology Inc
- 13.1.3.1. Company Overview
- 13.1.3.2. Products
- 13.1.3.3. Company Financials
- 13.1.3.4. SWOT Analysis
- 13.1.4 NXP Semiconductors NV
- 13.1.4.1. Company Overview
- 13.1.4.2. Products
- 13.1.4.3. Company Financials
- 13.1.4.4. SWOT Analysis
- 13.1.5 Samsung Electronics Co Ltd*List Not Exhaustive
- 13.1.5.1. Company Overview
- 13.1.5.2. Products
- 13.1.5.3. Company Financials
- 13.1.5.4. SWOT Analysis
- 13.1.6 STMicroelectronics
- 13.1.6.1. Company Overview
- 13.1.6.2. Products
- 13.1.6.3. Company Financials
- 13.1.6.4. SWOT Analysis
- 13.1.7 Zilog Inc
- 13.1.7.1. Company Overview
- 13.1.7.2. Products
- 13.1.7.3. Company Financials
- 13.1.7.4. SWOT Analysis
- 13.1.8 Renesas Electronics Corporation
- 13.1.8.1. Company Overview
- 13.1.8.2. Products
- 13.1.8.3. Company Financials
- 13.1.8.4. SWOT Analysis
- 13.1.9 Idemia Group
- 13.1.9.1. Company Overview
- 13.1.9.2. Products
- 13.1.9.3. Company Financials
- 13.1.9.4. SWOT Analysis
- 13.1.10 Thales group
- 13.1.10.1. Company Overview
- 13.1.10.2. Products
- 13.1.10.3. Company Financials
- 13.1.10.4. SWOT Analysis
- 13.1.1 Giesecke+Devrient
- 13.2. Market Entropy
- 13.2.1 Company's Key Areas Served
- 13.2.2 Recent Developments
- 13.3. Company Market Share Analysis 2025
- 13.3.1 Top 5 Companies Market Share Analysis
- 13.3.2 Top 3 Companies Market Share Analysis
- 13.4. List of Potential Customers
- 14. Research Methodology
List of Figures
- Figure 1: Global Smartcard MCU Industry Revenue Breakdown (Million, %) by Region 2025 & 2033
- Figure 2: North America Smartcard MCU Industry Revenue (Million), by Product 2025 & 2033
- Figure 3: North America Smartcard MCU Industry Revenue Share (%), by Product 2025 & 2033
- Figure 4: North America Smartcard MCU Industry Revenue (Million), by Functionality 2025 & 2033
- Figure 5: North America Smartcard MCU Industry Revenue Share (%), by Functionality 2025 & 2033
- Figure 6: North America Smartcard MCU Industry Revenue (Million), by End-user Industry 2025 & 2033
- Figure 7: North America Smartcard MCU Industry Revenue Share (%), by End-user Industry 2025 & 2033
- Figure 8: North America Smartcard MCU Industry Revenue (Million), by Country 2025 & 2033
- Figure 9: North America Smartcard MCU Industry Revenue Share (%), by Country 2025 & 2033
- Figure 10: Europe Smartcard MCU Industry Revenue (Million), by Product 2025 & 2033
- Figure 11: Europe Smartcard MCU Industry Revenue Share (%), by Product 2025 & 2033
- Figure 12: Europe Smartcard MCU Industry Revenue (Million), by Functionality 2025 & 2033
- Figure 13: Europe Smartcard MCU Industry Revenue Share (%), by Functionality 2025 & 2033
- Figure 14: Europe Smartcard MCU Industry Revenue (Million), by End-user Industry 2025 & 2033
- Figure 15: Europe Smartcard MCU Industry Revenue Share (%), by End-user Industry 2025 & 2033
- Figure 16: Europe Smartcard MCU Industry Revenue (Million), by Country 2025 & 2033
- Figure 17: Europe Smartcard MCU Industry Revenue Share (%), by Country 2025 & 2033
- Figure 18: Asia Smartcard MCU Industry Revenue (Million), by Product 2025 & 2033
- Figure 19: Asia Smartcard MCU Industry Revenue Share (%), by Product 2025 & 2033
- Figure 20: Asia Smartcard MCU Industry Revenue (Million), by Functionality 2025 & 2033
- Figure 21: Asia Smartcard MCU Industry Revenue Share (%), by Functionality 2025 & 2033
- Figure 22: Asia Smartcard MCU Industry Revenue (Million), by End-user Industry 2025 & 2033
- Figure 23: Asia Smartcard MCU Industry Revenue Share (%), by End-user Industry 2025 & 2033
- Figure 24: Asia Smartcard MCU Industry Revenue (Million), by Country 2025 & 2033
- Figure 25: Asia Smartcard MCU Industry Revenue Share (%), by Country 2025 & 2033
- Figure 26: Australia and New Zealand Smartcard MCU Industry Revenue (Million), by Product 2025 & 2033
- Figure 27: Australia and New Zealand Smartcard MCU Industry Revenue Share (%), by Product 2025 & 2033
- Figure 28: Australia and New Zealand Smartcard MCU Industry Revenue (Million), by Functionality 2025 & 2033
- Figure 29: Australia and New Zealand Smartcard MCU Industry Revenue Share (%), by Functionality 2025 & 2033
- Figure 30: Australia and New Zealand Smartcard MCU Industry Revenue (Million), by End-user Industry 2025 & 2033
- Figure 31: Australia and New Zealand Smartcard MCU Industry Revenue Share (%), by End-user Industry 2025 & 2033
- Figure 32: Australia and New Zealand Smartcard MCU Industry Revenue (Million), by Country 2025 & 2033
- Figure 33: Australia and New Zealand Smartcard MCU Industry Revenue Share (%), by Country 2025 & 2033
- Figure 34: Latin America Smartcard MCU Industry Revenue (Million), by Product 2025 & 2033
- Figure 35: Latin America Smartcard MCU Industry Revenue Share (%), by Product 2025 & 2033
- Figure 36: Latin America Smartcard MCU Industry Revenue (Million), by Functionality 2025 & 2033
- Figure 37: Latin America Smartcard MCU Industry Revenue Share (%), by Functionality 2025 & 2033
- Figure 38: Latin America Smartcard MCU Industry Revenue (Million), by End-user Industry 2025 & 2033
- Figure 39: Latin America Smartcard MCU Industry Revenue Share (%), by End-user Industry 2025 & 2033
- Figure 40: Latin America Smartcard MCU Industry Revenue (Million), by Country 2025 & 2033
- Figure 41: Latin America Smartcard MCU Industry Revenue Share (%), by Country 2025 & 2033
- Figure 42: Middle East and Africa Smartcard MCU Industry Revenue (Million), by Product 2025 & 2033
- Figure 43: Middle East and Africa Smartcard MCU Industry Revenue Share (%), by Product 2025 & 2033
- Figure 44: Middle East and Africa Smartcard MCU Industry Revenue (Million), by Functionality 2025 & 2033
- Figure 45: Middle East and Africa Smartcard MCU Industry Revenue Share (%), by Functionality 2025 & 2033
- Figure 46: Middle East and Africa Smartcard MCU Industry Revenue (Million), by End-user Industry 2025 & 2033
- Figure 47: Middle East and Africa Smartcard MCU Industry Revenue Share (%), by End-user Industry 2025 & 2033
- Figure 48: Middle East and Africa Smartcard MCU Industry Revenue (Million), by Country 2025 & 2033
- Figure 49: Middle East and Africa Smartcard MCU Industry Revenue Share (%), by Country 2025 & 2033
List of Tables
- Table 1: Global Smartcard MCU Industry Revenue Million Forecast, by Product 2020 & 2033
- Table 2: Global Smartcard MCU Industry Revenue Million Forecast, by Functionality 2020 & 2033
- Table 3: Global Smartcard MCU Industry Revenue Million Forecast, by End-user Industry 2020 & 2033
- Table 4: Global Smartcard MCU Industry Revenue Million Forecast, by Region 2020 & 2033
- Table 5: Global Smartcard MCU Industry Revenue Million Forecast, by Product 2020 & 2033
- Table 6: Global Smartcard MCU Industry Revenue Million Forecast, by Functionality 2020 & 2033
- Table 7: Global Smartcard MCU Industry Revenue Million Forecast, by End-user Industry 2020 & 2033
- Table 8: Global Smartcard MCU Industry Revenue Million Forecast, by Country 2020 & 2033
- Table 9: Global Smartcard MCU Industry Revenue Million Forecast, by Product 2020 & 2033
- Table 10: Global Smartcard MCU Industry Revenue Million Forecast, by Functionality 2020 & 2033
- Table 11: Global Smartcard MCU Industry Revenue Million Forecast, by End-user Industry 2020 & 2033
- Table 12: Global Smartcard MCU Industry Revenue Million Forecast, by Country 2020 & 2033
- Table 13: Global Smartcard MCU Industry Revenue Million Forecast, by Product 2020 & 2033
- Table 14: Global Smartcard MCU Industry Revenue Million Forecast, by Functionality 2020 & 2033
- Table 15: Global Smartcard MCU Industry Revenue Million Forecast, by End-user Industry 2020 & 2033
- Table 16: Global Smartcard MCU Industry Revenue Million Forecast, by Country 2020 & 2033
- Table 17: Global Smartcard MCU Industry Revenue Million Forecast, by Product 2020 & 2033
- Table 18: Global Smartcard MCU Industry Revenue Million Forecast, by Functionality 2020 & 2033
- Table 19: Global Smartcard MCU Industry Revenue Million Forecast, by End-user Industry 2020 & 2033
- Table 20: Global Smartcard MCU Industry Revenue Million Forecast, by Country 2020 & 2033
- Table 21: Global Smartcard MCU Industry Revenue Million Forecast, by Product 2020 & 2033
- Table 22: Global Smartcard MCU Industry Revenue Million Forecast, by Functionality 2020 & 2033
- Table 23: Global Smartcard MCU Industry Revenue Million Forecast, by End-user Industry 2020 & 2033
- Table 24: Global Smartcard MCU Industry Revenue Million Forecast, by Country 2020 & 2033
- Table 25: Global Smartcard MCU Industry Revenue Million Forecast, by Product 2020 & 2033
- Table 26: Global Smartcard MCU Industry Revenue Million Forecast, by Functionality 2020 & 2033
- Table 27: Global Smartcard MCU Industry Revenue Million Forecast, by End-user Industry 2020 & 2033
- Table 28: Global Smartcard MCU Industry Revenue Million Forecast, by Country 2020 & 2033
Frequently Asked Questions
1. What is the projected Compound Annual Growth Rate (CAGR) of the Smartcard MCU Industry?
The projected CAGR is approximately 5.29%.
2. Which companies are prominent players in the Smartcard MCU Industry?
Key companies in the market include Giesecke+Devrient, Infineon Technologies AG, Microchip Technology Inc, NXP Semiconductors NV, Samsung Electronics Co Ltd*List Not Exhaustive, STMicroelectronics, Zilog Inc, Renesas Electronics Corporation, Idemia Group, Thales group.
3. What are the main segments of the Smartcard MCU Industry?
The market segments include Product, Functionality, End-user Industry.
4. Can you provide details about the market size?
The market size is estimated to be USD 3.32 Million as of 2022.
5. What are some drivers contributing to market growth?
Rapid Development of Digital Technologies; Increasing Investments by Governments in Transportation Systems.
6. What are the notable trends driving market growth?
BFSI to Witness the Growth.
7. Are there any restraints impacting market growth?
Higher Cost of Advanced Featured Vehicles.
8. Can you provide examples of recent developments in the market?
April 2023: STMicroelectronics introduced a selection of microcontrollers, which are built on the ARM7 (TM) Thumb(R) core family developed by ARM (LSE: ARM). This new range, known as the STR71xF series, offers a variety of communication interfaces, including I2C, SPI, UART, CAN, USB, HDLC, MMC, and Smart Card interfaces. STMicroelectronics emphasized its established presence in the market for 8- and 16-bit MCUs and expressed its intention to venture into the 32-bit domain with this ARM-based family.
9. What pricing options are available for accessing the report?
Pricing options include single-user, multi-user, and enterprise licenses priced at USD 4750, USD 5250, and USD 8750 respectively.
10. Is the market size provided in terms of value or volume?
The market size is provided in terms of value, measured in Million.
11. Are there any specific market keywords associated with the report?
Yes, the market keyword associated with the report is "Smartcard MCU Industry," which aids in identifying and referencing the specific market segment covered.
12. How do I determine which pricing option suits my needs best?
The pricing options vary based on user requirements and access needs. Individual users may opt for single-user licenses, while businesses requiring broader access may choose multi-user or enterprise licenses for cost-effective access to the report.
13. Are there any additional resources or data provided in the Smartcard MCU Industry report?
While the report offers comprehensive insights, it's advisable to review the specific contents or supplementary materials provided to ascertain if additional resources or data are available.
14. How can I stay updated on further developments or reports in the Smartcard MCU Industry?
To stay informed about further developments, trends, and reports in the Smartcard MCU Industry, consider subscribing to industry newsletters, following relevant companies and organizations, or regularly checking reputable industry news sources and publications.
Methodology
Step 1 - Identification of Relevant Samples Size from Population Database


Step 2 - Approaches for Defining Global Market Size (Value, Volume* & Price*)

Note*: In applicable scenarios
Step 3 - Data Sources
Primary Research
- Web Analytics
- Survey Reports
- Research Institute
- Latest Research Reports
- Opinion Leaders
Secondary Research
- Annual Reports
- White Paper
- Latest Press Release
- Industry Association
- Paid Database
- Investor Presentations

Step 4 - Data Triangulation
Involves using different sources of information in order to increase the validity of a study
These sources are likely to be stakeholders in a program - participants, other researchers, program staff, other community members, and so on.
Then we put all data in single framework & apply various statistical tools to find out the dynamic on the market.
During the analysis stage, feedback from the stakeholder groups would be compared to determine areas of agreement as well as areas of divergence