

Key Insights
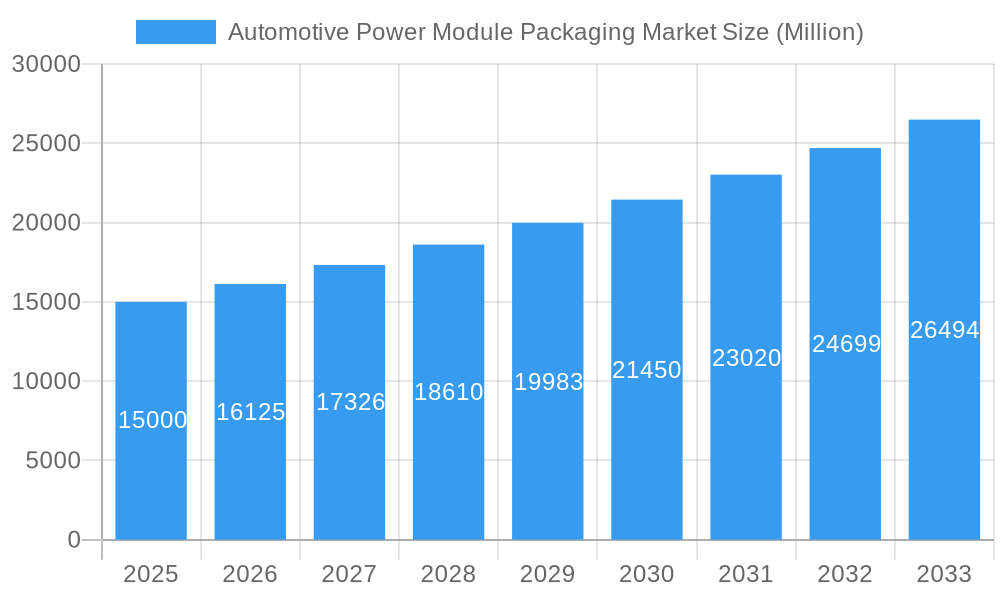
The automotive power module packaging market is poised for substantial expansion, propelled by the escalating adoption of electric vehicles (EVs) and hybrid electric vehicles (HEVs). Anticipated to grow at a compound annual growth rate (CAGR) of 14.3%, the market size is projected to reach $9.86 billion by 2025. This growth is underpinned by several key drivers: stringent global emission mandates accelerating vehicle electrification, and continuous advancements in power electronics enhancing automotive system efficiency and performance. The proliferation of advanced driver-assistance systems (ADAS) and autonomous driving technologies further fuels this expansion, as these systems depend critically on sophisticated power modules.
Automotive Power Module Packaging Market Market Size (In Billion)
Key market segments include Intelligent Power Modules (IPMs), Silicon Carbide (SiC) modules, and Gallium Nitride (GaN) modules. While IPMs currently command a significant market share, SiC and GaN modules are rapidly gaining prominence due to their superior performance attributes, including higher switching frequencies and power densities. The industry-wide transition to wide-bandgap (WBG) semiconductor technologies (SiC and GaN) represents a pivotal trend, promising enhanced efficiency and reduced vehicle weight.
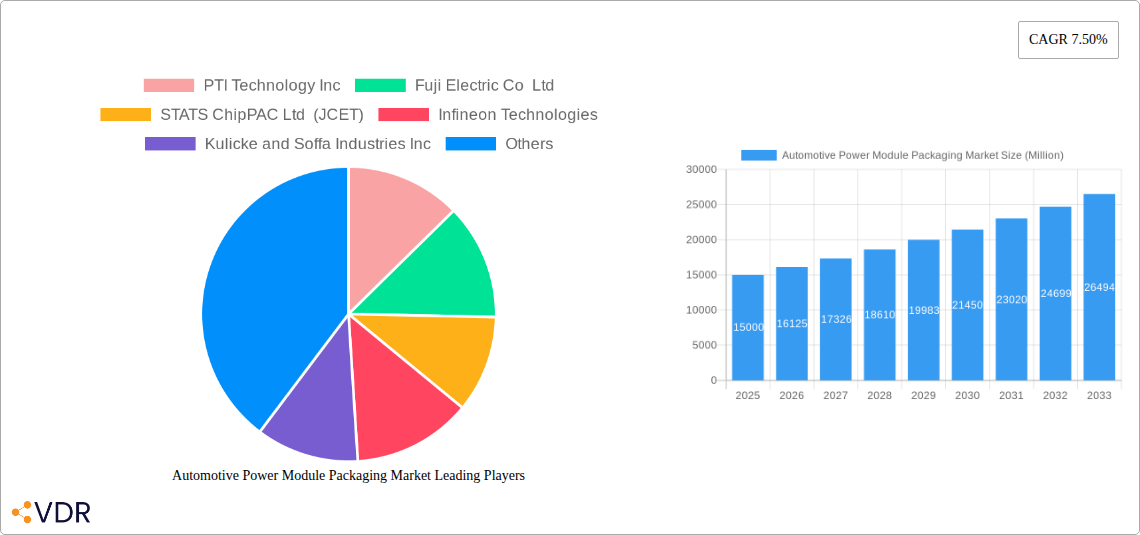
Automotive Power Module Packaging Market Company Market Share
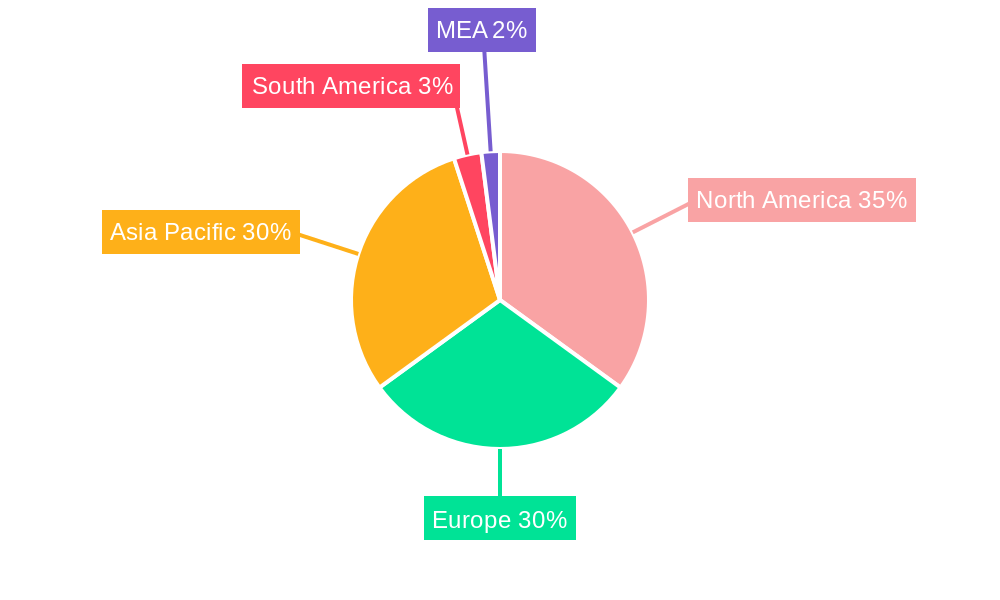
Geographically, North America, Europe, and Asia Pacific are major markets. China and other key Asian economies are increasingly vital as global EV production centers. However, challenges persist, notably the high cost of WBG modules and integration complexities. Despite these hurdles, the long-term outlook for automotive power module packaging remains exceptionally strong, driven by sustained EV growth and ongoing technological innovation.
Leading players such as Infineon Technologies, STMicroelectronics, Amkor Technology, and JCET are actively shaping the market through strategic alliances, product development, and capacity expansions. Intense competition necessitates continuous innovation and cost optimization. The projected market size of $9.86 billion by 2025 signifies a robust growth trajectory, potentially surpassing historical CAGRs, particularly fueled by the anticipated surge in global EV sales. Regional analysis indicates North America and Asia Pacific will likely retain dominant market positions, with Europe remaining a significant contributor due to stringent environmental regulations and high EV adoption rates. Future market expansion hinges on the continued reduction in WBG module costs and the development of more efficient, reliable packaging solutions tailored to the automotive industry's rigorous demands.
Automotive Power Module Packaging Market: A Comprehensive Report (2019-2033)
This in-depth report provides a comprehensive analysis of the Automotive Power Module Packaging market, encompassing market dynamics, growth trends, regional dominance, product landscape, key players, and future outlook. The report covers the period 2019-2033, with a focus on the forecast period 2025-2033 and a base year of 2025. This report is crucial for industry professionals, investors, and stakeholders seeking to understand and capitalize on the opportunities within this rapidly evolving sector. The parent market is the broader automotive electronics market, while the child market focuses specifically on power module packaging solutions.
Automotive Power Module Packaging Market Market Dynamics & Structure
The Automotive Power Module Packaging market is characterized by a moderately concentrated landscape, with key players like Infineon Technologies, STMicroelectronics, Amkor Technology, and Toshiba Electronic Device & Storage Corporation holding significant market share. Market concentration is expected to increase slightly over the forecast period due to ongoing consolidation. Technological innovation, particularly in SiC and GaN modules, is a key driver, alongside stringent emission regulations and the increasing demand for electric and hybrid vehicles. The market faces competition from alternative packaging technologies, and M&A activity has been moderate, with xx deals recorded between 2019 and 2024, leading to a xx% market share shift.
- Market Concentration: Moderately concentrated, with top 5 players holding approximately xx% market share in 2025.
- Technological Innovation: SiC and GaN modules are driving significant growth, pushing the need for advanced packaging solutions.
- Regulatory Frameworks: Stringent emission standards are pushing the adoption of efficient power modules.
- Competitive Substitutes: Alternative packaging technologies present some competitive pressure, but the need for higher power density favors advanced solutions.
- End-User Demographics: Primarily automotive OEMs and Tier-1 suppliers.
- M&A Trends: Moderate M&A activity, with xx deals completed between 2019 and 2024.
Automotive Power Module Packaging Market Growth Trends & Insights
The Automotive Power Module Packaging market is projected to witness robust growth, with a CAGR of xx% during the forecast period (2025-2033). This growth is primarily fueled by the increasing adoption of electric vehicles (EVs) and hybrid electric vehicles (HEVs), which require advanced power modules for efficient energy management. The market size is estimated at xx Million units in 2025 and is expected to reach xx Million units by 2033. Technological disruptions, such as the increasing adoption of SiC and GaN-based power modules, are further accelerating market expansion. Consumer preference for eco-friendly vehicles and enhanced vehicle performance is also driving demand. Market penetration of SiC and GaN modules is projected to grow from xx% in 2025 to xx% by 2033.
Dominant Regions, Countries, or Segments in Automotive Power Module Packaging Market
The Asia Pacific region is currently the dominant market for automotive power module packaging, accounting for approximately xx% of the global market share in 2025, driven by high production volumes of vehicles and a robust automotive industry. Europe and North America also represent significant market segments with significant growth potential due to the increasing focus on electric vehicle adoption and supportive government policies. Within the "By Type" segment, the Intelligent Power Module (IPM) segment holds the largest market share in 2025 at xx%, followed by SiC modules and GaN modules. However, SiC and GaN are expected to witness the highest growth rates over the forecast period due to their superior efficiency and power density.
- Asia Pacific: High vehicle production, supportive government policies, and a growing EV market drive dominance.
- Europe: Stringent emission regulations and growing adoption of EVs fuel market growth.
- North America: High demand for fuel-efficient and electric vehicles contribute to market expansion.
- Intelligent Power Modules (IPM): Largest market share in 2025, driven by widespread adoption in conventional vehicles.
- SiC Modules and GaN Modules: Fastest-growing segments due to superior efficiency and power density.
Automotive Power Module Packaging Market Product Landscape
The automotive power module packaging market offers a diverse range of products, including IPMs, SiC modules, and GaN modules, each designed to meet specific performance requirements and application needs. Innovation focuses on increasing power density, improving thermal management, and enhancing reliability. Unique selling propositions include smaller form factors, higher switching frequencies, and improved efficiency leading to reduced energy consumption and extended vehicle range. Advancements in packaging technologies, such as 3D packaging and advanced substrate materials, are crucial for achieving higher performance and reliability.
Key Drivers, Barriers & Challenges in Automotive Power Module Packaging Market
Key Drivers:
- The increasing demand for electric and hybrid vehicles is the primary driver.
- Stringent emission regulations are pushing for more efficient power management solutions.
- Advancements in SiC and GaN technology offer significant performance advantages.
Challenges and Restraints:
- High initial costs associated with SiC and GaN modules can pose a barrier to wider adoption.
- Supply chain disruptions can impact production and availability.
- Competition from established packaging technologies can limit market penetration.
Emerging Opportunities in Automotive Power Module Packaging Market
Emerging opportunities lie in the expansion into new vehicle segments, including commercial vehicles and two-wheelers. The development of more advanced packaging technologies, such as integrated power modules with embedded sensors, presents significant potential. Furthermore, growing demand for high-power applications in EVs and autonomous driving systems creates opportunities for specialized power module packaging solutions.
Growth Accelerators in the Automotive Power Module Packaging Market Industry
Long-term growth will be driven by technological breakthroughs in wide-bandgap semiconductors (SiC and GaN), enabling higher power density and efficiency. Strategic partnerships between semiconductor manufacturers and packaging companies will facilitate the development and deployment of advanced packaging solutions. Market expansion into emerging markets with a burgeoning automotive industry will further drive growth.
Key Players Shaping the Automotive Power Module Packaging Market Market
- PTI Technology Inc
- Fuji Electric Co Ltd
- STATS ChipPAC Ltd (JCET)
- Infineon Technologies
- Kulicke and Soffa Industries Inc
- STMicroelectronics
- Amkor Technology
- Toshiba Electronic Device & Storage Corporation
- Starpower Semiconductor Ltd
- Semikron
Notable Milestones in Automotive Power Module Packaging Sector
- 2022 Q3: Infineon launches a new generation of SiC modules with enhanced power density.
- 2023 Q1: STMicroelectronics announces a strategic partnership with a major automotive OEM for the development of advanced power module packaging solutions.
- 2024 Q2: Amkor Technology expands its manufacturing capacity for SiC and GaN module packaging.
In-Depth Automotive Power Module Packaging Market Market Outlook
The Automotive Power Module Packaging market is poised for significant growth in the coming years, driven by the continued rise in electric vehicle adoption and the ongoing development of advanced packaging technologies. Strategic partnerships and investments in R&D will be key to capturing market share and sustaining long-term growth. The market presents lucrative opportunities for companies that can provide innovative and high-performance packaging solutions to meet the demands of the evolving automotive industry.
Automotive Power Module Packaging Market Segmentation
-
1. Type
- 1.1. Intelligent Power Module (IPM)
- 1.2. SiC Module
- 1.3. GaN Module
- 1.4. Others (IGBT,FET)
Automotive Power Module Packaging Market Segmentation By Geography
- 1. North America
- 2. Europe
- 3. Asia Pacific
- 4. Rest of the World
Automotive Power Module Packaging Market Regional Market Share
Geographic Coverage of Automotive Power Module Packaging Market
Automotive Power Module Packaging Market REPORT HIGHLIGHTS
| Aspects | Details |
|---|---|
| Study Period | 2020-2034 |
| Base Year | 2025 |
| Estimated Year | 2026 |
| Forecast Period | 2026-2034 |
| Historical Period | 2020-2025 |
| Growth Rate | CAGR of 14.3% from 2020-2034 |
| Segmentation |
|
Table of Contents
- 1. Introduction
- 1.1. Research Scope
- 1.2. Market Segmentation
- 1.3. Research Objective
- 1.4. Definitions and Assumptions
- 2. Executive Summary
- 2.1. Market Snapshot
- 3. Market Dynamics
- 3.1. Market Drivers
- 3.2. Market Restrains
- 3.3. Market Trends
- 3.4. Market Opportunities
- 4. Market Factor Analysis
- 4.1. Porters Five Forces
- 4.1.1. Bargaining Power of Suppliers
- 4.1.2. Bargaining Power of Buyers
- 4.1.3. Threat of New Entrants
- 4.1.4. Threat of Substitutes
- 4.1.5. Competitive Rivalry
- 4.2. PESTEL analysis
- 4.3. BCG Analysis
- 4.3.1. Stars (High Growth, High Market Share)
- 4.3.2. Cash Cows (Low Growth, High Market Share)
- 4.3.3. Question Mark (High Growth, Low Market Share)
- 4.3.4. Dogs (Low Growth, Low Market Share)
- 4.4. Ansoff Matrix Analysis
- 4.5. Supply Chain Analysis
- 4.6. Regulatory Landscape
- 4.7. Current Market Potential and Opportunity Assessment (TAM–SAM–SOM Framework)
- 4.8. VDR Analyst Note
- 4.1. Porters Five Forces
- 5. Market Analysis, Insights and Forecast 2021-2033
- 5.1. Market Analysis, Insights and Forecast - by Type
- 5.1.1. Intelligent Power Module (IPM)
- 5.1.2. SiC Module
- 5.1.3. GaN Module
- 5.1.4. Others (IGBT,FET)
- 5.2. Market Analysis, Insights and Forecast - by Region
- 5.2.1. North America
- 5.2.2. Europe
- 5.2.3. Asia Pacific
- 5.2.4. Rest of the World
- 5.1. Market Analysis, Insights and Forecast - by Type
- 6. Global Automotive Power Module Packaging Market Analysis, Insights and Forecast, 2021-2033
- 6.1. Market Analysis, Insights and Forecast - by Type
- 6.1.1. Intelligent Power Module (IPM)
- 6.1.2. SiC Module
- 6.1.3. GaN Module
- 6.1.4. Others (IGBT,FET)
- 6.1. Market Analysis, Insights and Forecast - by Type
- 7. North America Automotive Power Module Packaging Market Analysis, Insights and Forecast, 2021-2033
- 7.1. Market Analysis, Insights and Forecast - by Type
- 7.1.1. Intelligent Power Module (IPM)
- 7.1.2. SiC Module
- 7.1.3. GaN Module
- 7.1.4. Others (IGBT,FET)
- 7.1. Market Analysis, Insights and Forecast - by Type
- 8. Europe Automotive Power Module Packaging Market Analysis, Insights and Forecast, 2021-2033
- 8.1. Market Analysis, Insights and Forecast - by Type
- 8.1.1. Intelligent Power Module (IPM)
- 8.1.2. SiC Module
- 8.1.3. GaN Module
- 8.1.4. Others (IGBT,FET)
- 8.1. Market Analysis, Insights and Forecast - by Type
- 9. Asia Pacific Automotive Power Module Packaging Market Analysis, Insights and Forecast, 2021-2033
- 9.1. Market Analysis, Insights and Forecast - by Type
- 9.1.1. Intelligent Power Module (IPM)
- 9.1.2. SiC Module
- 9.1.3. GaN Module
- 9.1.4. Others (IGBT,FET)
- 9.1. Market Analysis, Insights and Forecast - by Type
- 10. Rest of the World Automotive Power Module Packaging Market Analysis, Insights and Forecast, 2021-2033
- 10.1. Market Analysis, Insights and Forecast - by Type
- 10.1.1. Intelligent Power Module (IPM)
- 10.1.2. SiC Module
- 10.1.3. GaN Module
- 10.1.4. Others (IGBT,FET)
- 10.1. Market Analysis, Insights and Forecast - by Type
- 11. Competitive Analysis
- 11.1. Company Profiles
- 11.1.1 PTI Technology Inc
- 11.1.1.1. Company Overview
- 11.1.1.2. Products
- 11.1.1.3. Company Financials
- 11.1.1.4. SWOT Analysis
- 11.1.2 Fuji Electric Co Ltd
- 11.1.2.1. Company Overview
- 11.1.2.2. Products
- 11.1.2.3. Company Financials
- 11.1.2.4. SWOT Analysis
- 11.1.3 STATS ChipPAC Ltd (JCET)
- 11.1.3.1. Company Overview
- 11.1.3.2. Products
- 11.1.3.3. Company Financials
- 11.1.3.4. SWOT Analysis
- 11.1.4 Infineon Technologies
- 11.1.4.1. Company Overview
- 11.1.4.2. Products
- 11.1.4.3. Company Financials
- 11.1.4.4. SWOT Analysis
- 11.1.5 Kulicke and Soffa Industries Inc
- 11.1.5.1. Company Overview
- 11.1.5.2. Products
- 11.1.5.3. Company Financials
- 11.1.5.4. SWOT Analysis
- 11.1.6 STMicroelectronics
- 11.1.6.1. Company Overview
- 11.1.6.2. Products
- 11.1.6.3. Company Financials
- 11.1.6.4. SWOT Analysis
- 11.1.7 Amkor Technology
- 11.1.7.1. Company Overview
- 11.1.7.2. Products
- 11.1.7.3. Company Financials
- 11.1.7.4. SWOT Analysis
- 11.1.8 Toshiba Electronic Device & Storage Corporation
- 11.1.8.1. Company Overview
- 11.1.8.2. Products
- 11.1.8.3. Company Financials
- 11.1.8.4. SWOT Analysis
- 11.1.9 Starpower Semiconductor Ltd
- 11.1.9.1. Company Overview
- 11.1.9.2. Products
- 11.1.9.3. Company Financials
- 11.1.9.4. SWOT Analysis
- 11.1.10 Semikron
- 11.1.10.1. Company Overview
- 11.1.10.2. Products
- 11.1.10.3. Company Financials
- 11.1.10.4. SWOT Analysis
- 11.1.1 PTI Technology Inc
- 11.2. Market Entropy
- 11.2.1 Company's Key Areas Served
- 11.2.2 Recent Developments
- 11.3. Company Market Share Analysis 2025
- 11.3.1 Top 5 Companies Market Share Analysis
- 11.3.2 Top 3 Companies Market Share Analysis
- 11.4. List of Potential Customers
- 12. Research Methodology
List of Figures
- Figure 1: Global Automotive Power Module Packaging Market Revenue Breakdown (billion, %) by Region 2025 & 2033
- Figure 2: Global Automotive Power Module Packaging Market Volume Breakdown (K Unit, %) by Region 2025 & 2033
- Figure 3: North America Automotive Power Module Packaging Market Revenue (billion), by Type 2025 & 2033
- Figure 4: North America Automotive Power Module Packaging Market Volume (K Unit), by Type 2025 & 2033
- Figure 5: North America Automotive Power Module Packaging Market Revenue Share (%), by Type 2025 & 2033
- Figure 6: North America Automotive Power Module Packaging Market Volume Share (%), by Type 2025 & 2033
- Figure 7: North America Automotive Power Module Packaging Market Revenue (billion), by Country 2025 & 2033
- Figure 8: North America Automotive Power Module Packaging Market Volume (K Unit), by Country 2025 & 2033
- Figure 9: North America Automotive Power Module Packaging Market Revenue Share (%), by Country 2025 & 2033
- Figure 10: North America Automotive Power Module Packaging Market Volume Share (%), by Country 2025 & 2033
- Figure 11: Europe Automotive Power Module Packaging Market Revenue (billion), by Type 2025 & 2033
- Figure 12: Europe Automotive Power Module Packaging Market Volume (K Unit), by Type 2025 & 2033
- Figure 13: Europe Automotive Power Module Packaging Market Revenue Share (%), by Type 2025 & 2033
- Figure 14: Europe Automotive Power Module Packaging Market Volume Share (%), by Type 2025 & 2033
- Figure 15: Europe Automotive Power Module Packaging Market Revenue (billion), by Country 2025 & 2033
- Figure 16: Europe Automotive Power Module Packaging Market Volume (K Unit), by Country 2025 & 2033
- Figure 17: Europe Automotive Power Module Packaging Market Revenue Share (%), by Country 2025 & 2033
- Figure 18: Europe Automotive Power Module Packaging Market Volume Share (%), by Country 2025 & 2033
- Figure 19: Asia Pacific Automotive Power Module Packaging Market Revenue (billion), by Type 2025 & 2033
- Figure 20: Asia Pacific Automotive Power Module Packaging Market Volume (K Unit), by Type 2025 & 2033
- Figure 21: Asia Pacific Automotive Power Module Packaging Market Revenue Share (%), by Type 2025 & 2033
- Figure 22: Asia Pacific Automotive Power Module Packaging Market Volume Share (%), by Type 2025 & 2033
- Figure 23: Asia Pacific Automotive Power Module Packaging Market Revenue (billion), by Country 2025 & 2033
- Figure 24: Asia Pacific Automotive Power Module Packaging Market Volume (K Unit), by Country 2025 & 2033
- Figure 25: Asia Pacific Automotive Power Module Packaging Market Revenue Share (%), by Country 2025 & 2033
- Figure 26: Asia Pacific Automotive Power Module Packaging Market Volume Share (%), by Country 2025 & 2033
- Figure 27: Rest of the World Automotive Power Module Packaging Market Revenue (billion), by Type 2025 & 2033
- Figure 28: Rest of the World Automotive Power Module Packaging Market Volume (K Unit), by Type 2025 & 2033
- Figure 29: Rest of the World Automotive Power Module Packaging Market Revenue Share (%), by Type 2025 & 2033
- Figure 30: Rest of the World Automotive Power Module Packaging Market Volume Share (%), by Type 2025 & 2033
- Figure 31: Rest of the World Automotive Power Module Packaging Market Revenue (billion), by Country 2025 & 2033
- Figure 32: Rest of the World Automotive Power Module Packaging Market Volume (K Unit), by Country 2025 & 2033
- Figure 33: Rest of the World Automotive Power Module Packaging Market Revenue Share (%), by Country 2025 & 2033
- Figure 34: Rest of the World Automotive Power Module Packaging Market Volume Share (%), by Country 2025 & 2033
List of Tables
- Table 1: Global Automotive Power Module Packaging Market Revenue billion Forecast, by Type 2020 & 2033
- Table 2: Global Automotive Power Module Packaging Market Volume K Unit Forecast, by Type 2020 & 2033
- Table 3: Global Automotive Power Module Packaging Market Revenue billion Forecast, by Region 2020 & 2033
- Table 4: Global Automotive Power Module Packaging Market Volume K Unit Forecast, by Region 2020 & 2033
- Table 5: Global Automotive Power Module Packaging Market Revenue billion Forecast, by Type 2020 & 2033
- Table 6: Global Automotive Power Module Packaging Market Volume K Unit Forecast, by Type 2020 & 2033
- Table 7: Global Automotive Power Module Packaging Market Revenue billion Forecast, by Country 2020 & 2033
- Table 8: Global Automotive Power Module Packaging Market Volume K Unit Forecast, by Country 2020 & 2033
- Table 9: Global Automotive Power Module Packaging Market Revenue billion Forecast, by Type 2020 & 2033
- Table 10: Global Automotive Power Module Packaging Market Volume K Unit Forecast, by Type 2020 & 2033
- Table 11: Global Automotive Power Module Packaging Market Revenue billion Forecast, by Country 2020 & 2033
- Table 12: Global Automotive Power Module Packaging Market Volume K Unit Forecast, by Country 2020 & 2033
- Table 13: Global Automotive Power Module Packaging Market Revenue billion Forecast, by Type 2020 & 2033
- Table 14: Global Automotive Power Module Packaging Market Volume K Unit Forecast, by Type 2020 & 2033
- Table 15: Global Automotive Power Module Packaging Market Revenue billion Forecast, by Country 2020 & 2033
- Table 16: Global Automotive Power Module Packaging Market Volume K Unit Forecast, by Country 2020 & 2033
- Table 17: Global Automotive Power Module Packaging Market Revenue billion Forecast, by Type 2020 & 2033
- Table 18: Global Automotive Power Module Packaging Market Volume K Unit Forecast, by Type 2020 & 2033
- Table 19: Global Automotive Power Module Packaging Market Revenue billion Forecast, by Country 2020 & 2033
- Table 20: Global Automotive Power Module Packaging Market Volume K Unit Forecast, by Country 2020 & 2033
Frequently Asked Questions
1. What is the projected Compound Annual Growth Rate (CAGR) of the Automotive Power Module Packaging Market?
The projected CAGR is approximately 14.3%.
2. Which companies are prominent players in the Automotive Power Module Packaging Market?
Key companies in the market include PTI Technology Inc, Fuji Electric Co Ltd, STATS ChipPAC Ltd (JCET), Infineon Technologies, Kulicke and Soffa Industries Inc, STMicroelectronics, Amkor Technology, Toshiba Electronic Device & Storage Corporation, Starpower Semiconductor Ltd , Semikron.
3. What are the main segments of the Automotive Power Module Packaging Market?
The market segments include Type.
4. Can you provide details about the market size?
The market size is estimated to be USD 9.86 billion as of 2022.
5. What are some drivers contributing to market growth?
; Electric Vehicle and Hybrid Electric Vehicle to Drive the Automotive Power Module Packaging; Growing Demand Energy Efficient Battery Powered Devices.; Increasing Stringency of Emission Standards.
6. What are the notable trends driving market growth?
Electric Vehicle and Hybrid Electric Vehicle to Drive the Automotive Power Module Packaging.
7. Are there any restraints impacting market growth?
; Lack of Standard Protocols for the Development of Power Modules; Slow Adoption of New Technologies Derailing Innovation.
8. Can you provide examples of recent developments in the market?
N/A
9. What pricing options are available for accessing the report?
Pricing options include single-user, multi-user, and enterprise licenses priced at USD 4750, USD 5250, and USD 8750 respectively.
10. Is the market size provided in terms of value or volume?
The market size is provided in terms of value, measured in billion and volume, measured in K Unit.
11. Are there any specific market keywords associated with the report?
Yes, the market keyword associated with the report is "Automotive Power Module Packaging Market," which aids in identifying and referencing the specific market segment covered.
12. How do I determine which pricing option suits my needs best?
The pricing options vary based on user requirements and access needs. Individual users may opt for single-user licenses, while businesses requiring broader access may choose multi-user or enterprise licenses for cost-effective access to the report.
13. Are there any additional resources or data provided in the Automotive Power Module Packaging Market report?
While the report offers comprehensive insights, it's advisable to review the specific contents or supplementary materials provided to ascertain if additional resources or data are available.
14. How can I stay updated on further developments or reports in the Automotive Power Module Packaging Market?
To stay informed about further developments, trends, and reports in the Automotive Power Module Packaging Market, consider subscribing to industry newsletters, following relevant companies and organizations, or regularly checking reputable industry news sources and publications.
Methodology
Step 1 - Identification of Relevant Samples Size from Population Database


Step 2 - Approaches for Defining Global Market Size (Value, Volume* & Price*)

Note*: In applicable scenarios
Step 3 - Data Sources
Primary Research
- Web Analytics
- Survey Reports
- Research Institute
- Latest Research Reports
- Opinion Leaders
Secondary Research
- Annual Reports
- White Paper
- Latest Press Release
- Industry Association
- Paid Database
- Investor Presentations

Step 4 - Data Triangulation
Involves using different sources of information in order to increase the validity of a study
These sources are likely to be stakeholders in a program - participants, other researchers, program staff, other community members, and so on.
Then we put all data in single framework & apply various statistical tools to find out the dynamic on the market.
During the analysis stage, feedback from the stakeholder groups would be compared to determine areas of agreement as well as areas of divergence