

Key Insights
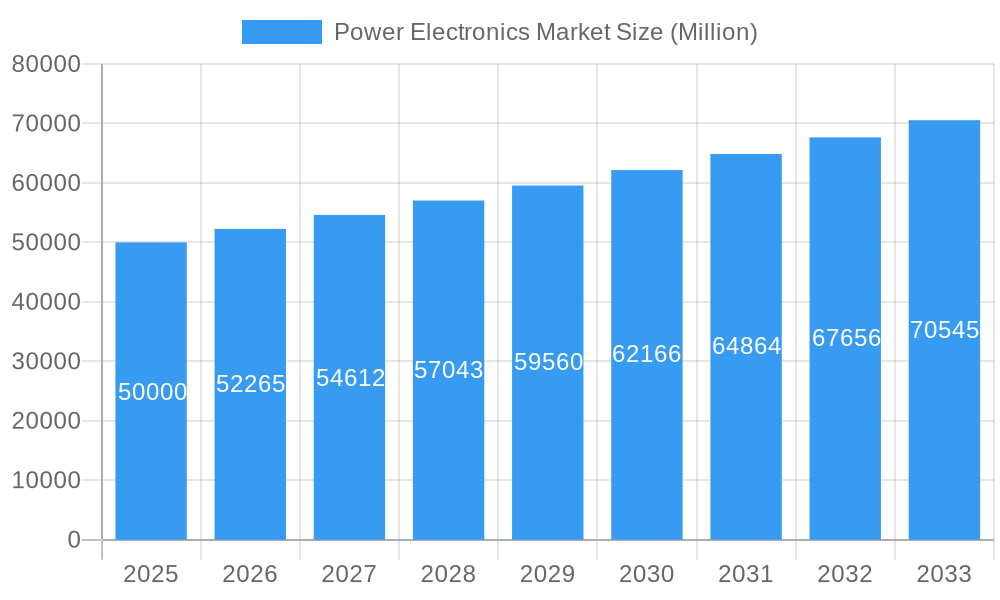
The global power electronics market is poised for significant expansion, driven by the escalating demand for energy-efficient solutions across key industries. The market is projected to achieve a Compound Annual Growth Rate (CAGR) of 5.4% between 2025 and 2033. This robust growth trajectory is underpinned by several critical factors, including the accelerated adoption of electric vehicles (EVs), the increasing integration of renewable energy sources such as solar and wind power, and the pervasive use of advanced power electronics in consumer electronics. Technological advancements in semiconductor materials, particularly Silicon Carbide (SiC) and Gallium Nitride (GaN), are further enhancing device efficiency and performance, thereby fueling market expansion. While discrete components currently lead the market share, power modules are anticipated to experience faster growth due to their compact design, enhanced reliability, and simplified integration. The Asia-Pacific region is expected to maintain its leadership position, benefiting from a strong electronics manufacturing base and rapid industrialization.
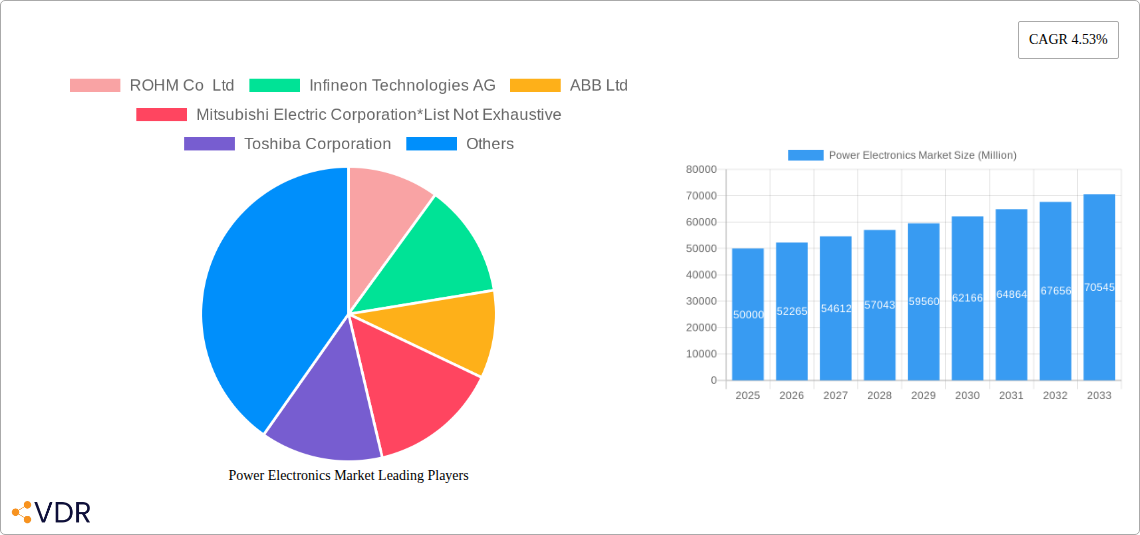
Power Electronics Market Market Size (In Billion)
Market segmentation highlights substantial opportunities within diverse end-user sectors. The automotive industry, primarily propelled by the transition to EVs and hybrid electric vehicles (HEVs), represents a pivotal growth driver. The consumer electronics sector, with its continuous demand for smaller, lighter, and more efficient devices, also contributes significantly. The IT and telecommunications industry, alongside the energy and power sectors, presents further avenues for market growth. Despite potential challenges such as high initial investment costs for new technologies and supply chain intricacies, the overall market outlook remains overwhelmingly positive. Leading industry players are actively investing in research and development and strategic collaborations to leverage this growth potential, intensifying innovation and competition within the power electronics landscape. The projected market size for 2025 is estimated at $51.73 billion, with expectations of continued expansion through to 2033, driven by ongoing technological innovation and global demand for power-efficient technologies.
Power Electronics Market Company Market Share
Power Electronics Market: A Comprehensive Report (2019-2033)
This in-depth report provides a comprehensive analysis of the Power Electronics Market, encompassing market dynamics, growth trends, regional dominance, product landscape, key players, and future outlook. The study period covers 2019-2033, with 2025 as the base and estimated year. The report is essential for industry professionals, investors, and strategists seeking to understand and capitalize on opportunities within this rapidly evolving sector. The market size is projected to reach xx Million units by 2033.
Power Electronics Market Dynamics & Structure
The power electronics market is characterized by moderate concentration, with key players like ROHM Co Ltd, Infineon Technologies AG, ABB Ltd, Mitsubishi Electric Corporation, Toshiba Corporation, STMicroelectronics NV, Texas Instruments Inc, ON Semiconductor Corporation, Vishay Intertechnologies Inc, and Renesas Electronic Corporation holding significant market share. However, the market is dynamic, with ongoing mergers and acquisitions (M&A) activity, estimated at xx deals in the last 5 years, reshaping the competitive landscape. Technological innovation, particularly in SiC and GaN materials, is a key driver, though high R&D costs present a significant barrier to entry for smaller players. Stringent regulatory frameworks surrounding energy efficiency and emissions further influence market dynamics. The increasing demand for energy-efficient solutions across various end-user industries fuels market growth. Substitute technologies are limited, given the unique capabilities of power electronics in power conversion and control.
- Market Concentration: Moderately concentrated, with top 10 players holding approximately xx% market share.
- Technological Innovation: SiC and GaN adoption is accelerating, but high R&D costs pose a barrier.
- Regulatory Landscape: Stringent energy efficiency standards drive market growth.
- M&A Activity: xx deals in the last 5 years indicate ongoing consolidation.
- End-User Demographics: Growing demand from automotive, renewable energy, and IT sectors.
Power Electronics Market Growth Trends & Insights
The power electronics market has witnessed robust growth in recent years, driven by the increasing adoption of renewable energy sources, the proliferation of electric vehicles, and the advancement of power semiconductor technologies. The market size experienced a CAGR of xx% during the historical period (2019-2024) and is projected to maintain a CAGR of xx% during the forecast period (2025-2033). This growth is underpinned by significant increases in adoption rates across various sectors, particularly in automotive (xx% penetration by 2033) and renewable energy. Technological disruptions, such as the widespread adoption of SiC and GaN devices, are further accelerating market expansion. Shifts in consumer behavior towards energy-efficient products also contribute significantly to market growth. The increasing demand for high-power density and efficient power conversion solutions in emerging applications such as data centers and 5G infrastructure are additional factors driving market expansion.
Dominant Regions, Countries, or Segments in Power Electronics Market
The Asia-Pacific region dominates the power electronics market, driven by strong growth in electronics manufacturing, automotive production, and renewable energy deployment in countries like China, Japan, and South Korea. Within segments, the automotive end-user industry is the largest, accounting for xx% of the market, followed by the IT and telecommunication sector (xx%). In terms of materials, Silicon/Germanium continues to hold the largest market share (xx%), but SiC and GaN are rapidly gaining traction, with projected CAGRs of xx% and xx% respectively, owing to their superior efficiency and power density. The discrete component segment holds the largest share (xx%), though the module segment is experiencing faster growth, driven by increasing demand for integrated solutions.
- Asia-Pacific Dominance: Strong growth in electronics manufacturing and renewable energy deployment.
- Automotive Sector Leadership: Largest end-user segment, fueled by EV adoption.
- SiC and GaN Growth: Rapid adoption due to superior efficiency and power density.
- Module Segment Growth: Driven by demand for integrated power solutions.
Power Electronics Market Product Landscape
The power electronics market is characterized by a wide array of products, including power MOSFETs, IGBTs, diodes, and integrated circuits. Recent innovations focus on increasing efficiency, power density, and thermal management. New materials like SiC and GaN are enabling smaller, lighter, and more efficient power modules. The unique selling propositions of these advanced materials include significantly reduced switching losses, higher operating frequencies, and improved thermal conductivity, leading to greater efficiency and reliability in various applications. Performance metrics such as switching frequency, efficiency, and thermal resistance are key considerations for selecting appropriate components.
Key Drivers, Barriers & Challenges in Power Electronics Market
Key Drivers:
- Increasing demand for energy-efficient solutions across various end-user industries.
- Growing adoption of electric vehicles and renewable energy sources.
- Advancements in power semiconductor technologies, particularly SiC and GaN.
- Government regulations promoting energy efficiency and emissions reduction.
Challenges & Restraints:
- High initial costs associated with SiC and GaN technologies.
- Supply chain disruptions impacting the availability of raw materials.
- Intense competition among established players and emerging market entrants.
- Regulatory hurdles and safety standards for high-power applications. This leads to an estimated xx% reduction in market growth annually.
Emerging Opportunities in Power Electronics Market
- Expansion into new and emerging markets, particularly in developing economies.
- Development of innovative applications, such as wireless power transfer and energy harvesting.
- Growing demand for power electronics in data centers and 5G infrastructure.
- Increasing focus on sustainability and the development of eco-friendly power solutions.
Growth Accelerators in the Power Electronics Market Industry
The power electronics market is poised for sustained growth due to several key factors. The continued adoption of electric vehicles and renewable energy sources will be significant drivers. Furthermore, ongoing technological advancements, particularly in wide bandgap semiconductors (SiC and GaN), will enable higher efficiency and power density solutions. Strategic partnerships and collaborations between semiconductor manufacturers and end-users will accelerate innovation and market penetration. Finally, increasing government investments in infrastructure projects supporting renewable energy and smart grids will create significant market opportunities.
Key Players Shaping the Power Electronics Market Market
- ROHM Co Ltd
- Infineon Technologies AG
- ABB Ltd
- Mitsubishi Electric Corporation
- Toshiba Corporation
- STMicroelectronics NV
- Texas Instruments Inc
- ON Semiconductor Corporation
- Vishay Intertechnologies Inc
- Renesas electronic corporation
Notable Milestones in Power Electronics Market Sector
- May 2023: Infineon Technologies AG launched its OptiMOS 740 V MOSFET family for automotive applications, improving performance and reducing package size.
- May 2023: Vishay Intertechnology introduced 17 new 650 V silicon carbide Schottky diodes (SiC), enhancing reliability and efficiency in switching power supplies.
- May 2023: Toshiba Electronics Europe launched a new 150V N-channel power MOSFET for high-performance switching power supplies, targeting communication base stations and industrial applications.
In-Depth Power Electronics Market Market Outlook
The power electronics market is expected to experience robust growth over the next decade, driven by technological advancements, increasing demand across various sectors, and favorable government policies. The continued adoption of energy-efficient solutions, along with the growing focus on renewable energy and electric vehicles, presents significant opportunities for market players. Strategic partnerships and M&A activity will further consolidate the market, leading to greater innovation and efficiency. The market's future potential is vast, with significant opportunities for companies that can develop and deliver innovative, high-performance, and cost-effective power electronic solutions.
Power Electronics Market Segmentation
-
1. Component
- 1.1. Discrete
- 1.2. Module
-
2. Material
- 2.1. Silicon/Germanium
- 2.2. Silicon Carbide (SiC)
- 2.3. Gallium Nitride (GaN)
-
3. End-user Industry
- 3.1. Automotive
- 3.2. Consumer Electronics
- 3.3. IT and Telecommunication
- 3.4. Military and Aerospace
- 3.5. Industrial
- 3.6. Energy and Power
- 3.7. Other End-user Industries
Power Electronics Market Segmentation By Geography
- 1. North America
- 2. Europe
- 3. Asia Pacific
- 4. Latin America
- 5. Middle East and Africa
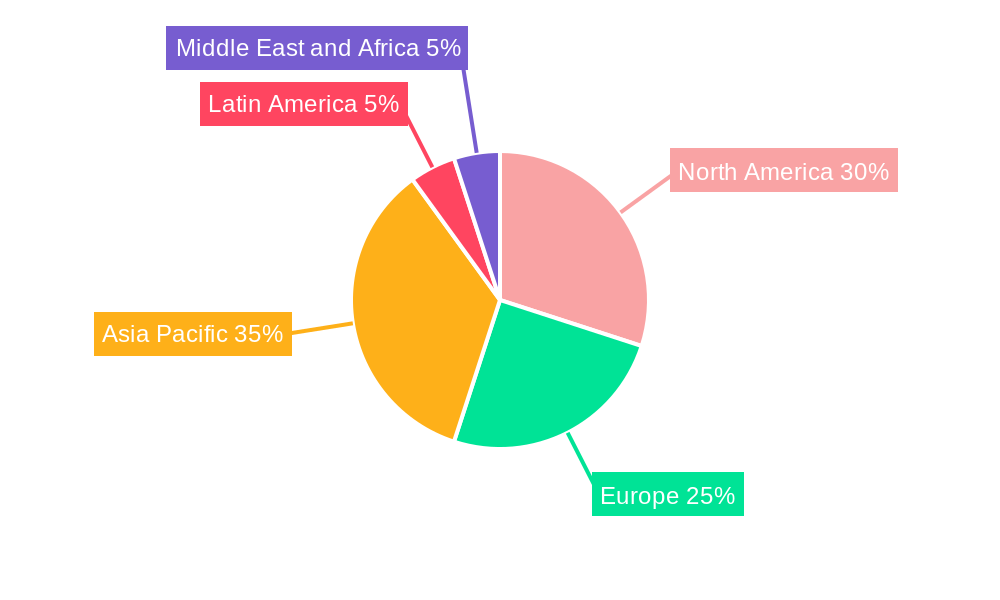
Power Electronics Market Regional Market Share
Geographic Coverage of Power Electronics Market
Power Electronics Market REPORT HIGHLIGHTS
| Aspects | Details |
|---|---|
| Study Period | 2020-2034 |
| Base Year | 2025 |
| Estimated Year | 2026 |
| Forecast Period | 2026-2034 |
| Historical Period | 2020-2025 |
| Growth Rate | CAGR of 5.4% from 2020-2034 |
| Segmentation |
|
Table of Contents
- 1. Introduction
- 1.1. Research Scope
- 1.2. Market Segmentation
- 1.3. Research Objective
- 1.4. Definitions and Assumptions
- 2. Executive Summary
- 2.1. Market Snapshot
- 3. Market Dynamics
- 3.1. Market Drivers
- 3.2. Market Restrains
- 3.3. Market Trends
- 3.4. Market Opportunities
- 4. Market Factor Analysis
- 4.1. Porters Five Forces
- 4.1.1. Bargaining Power of Suppliers
- 4.1.2. Bargaining Power of Buyers
- 4.1.3. Threat of New Entrants
- 4.1.4. Threat of Substitutes
- 4.1.5. Competitive Rivalry
- 4.2. PESTEL analysis
- 4.3. BCG Analysis
- 4.3.1. Stars (High Growth, High Market Share)
- 4.3.2. Cash Cows (Low Growth, High Market Share)
- 4.3.3. Question Mark (High Growth, Low Market Share)
- 4.3.4. Dogs (Low Growth, Low Market Share)
- 4.4. Ansoff Matrix Analysis
- 4.5. Supply Chain Analysis
- 4.6. Regulatory Landscape
- 4.7. Current Market Potential and Opportunity Assessment (TAM–SAM–SOM Framework)
- 4.8. VDR Analyst Note
- 4.1. Porters Five Forces
- 5. Market Analysis, Insights and Forecast 2021-2033
- 5.1. Market Analysis, Insights and Forecast - by Component
- 5.1.1. Discrete
- 5.1.2. Module
- 5.2. Market Analysis, Insights and Forecast - by Material
- 5.2.1. Silicon/Germanium
- 5.2.2. Silicon Carbide (SiC)
- 5.2.3. Gallium Nitride (GaN)
- 5.3. Market Analysis, Insights and Forecast - by End-user Industry
- 5.3.1. Automotive
- 5.3.2. Consumer Electronics
- 5.3.3. IT and Telecommunication
- 5.3.4. Military and Aerospace
- 5.3.5. Industrial
- 5.3.6. Energy and Power
- 5.3.7. Other End-user Industries
- 5.4. Market Analysis, Insights and Forecast - by Region
- 5.4.1. North America
- 5.4.2. Europe
- 5.4.3. Asia Pacific
- 5.4.4. Latin America
- 5.4.5. Middle East and Africa
- 5.1. Market Analysis, Insights and Forecast - by Component
- 6. Global Power Electronics Market Analysis, Insights and Forecast, 2021-2033
- 6.1. Market Analysis, Insights and Forecast - by Component
- 6.1.1. Discrete
- 6.1.2. Module
- 6.2. Market Analysis, Insights and Forecast - by Material
- 6.2.1. Silicon/Germanium
- 6.2.2. Silicon Carbide (SiC)
- 6.2.3. Gallium Nitride (GaN)
- 6.3. Market Analysis, Insights and Forecast - by End-user Industry
- 6.3.1. Automotive
- 6.3.2. Consumer Electronics
- 6.3.3. IT and Telecommunication
- 6.3.4. Military and Aerospace
- 6.3.5. Industrial
- 6.3.6. Energy and Power
- 6.3.7. Other End-user Industries
- 6.1. Market Analysis, Insights and Forecast - by Component
- 7. North America Power Electronics Market Analysis, Insights and Forecast, 2021-2033
- 7.1. Market Analysis, Insights and Forecast - by Component
- 7.1.1. Discrete
- 7.1.2. Module
- 7.2. Market Analysis, Insights and Forecast - by Material
- 7.2.1. Silicon/Germanium
- 7.2.2. Silicon Carbide (SiC)
- 7.2.3. Gallium Nitride (GaN)
- 7.3. Market Analysis, Insights and Forecast - by End-user Industry
- 7.3.1. Automotive
- 7.3.2. Consumer Electronics
- 7.3.3. IT and Telecommunication
- 7.3.4. Military and Aerospace
- 7.3.5. Industrial
- 7.3.6. Energy and Power
- 7.3.7. Other End-user Industries
- 7.1. Market Analysis, Insights and Forecast - by Component
- 8. Europe Power Electronics Market Analysis, Insights and Forecast, 2021-2033
- 8.1. Market Analysis, Insights and Forecast - by Component
- 8.1.1. Discrete
- 8.1.2. Module
- 8.2. Market Analysis, Insights and Forecast - by Material
- 8.2.1. Silicon/Germanium
- 8.2.2. Silicon Carbide (SiC)
- 8.2.3. Gallium Nitride (GaN)
- 8.3. Market Analysis, Insights and Forecast - by End-user Industry
- 8.3.1. Automotive
- 8.3.2. Consumer Electronics
- 8.3.3. IT and Telecommunication
- 8.3.4. Military and Aerospace
- 8.3.5. Industrial
- 8.3.6. Energy and Power
- 8.3.7. Other End-user Industries
- 8.1. Market Analysis, Insights and Forecast - by Component
- 9. Asia Pacific Power Electronics Market Analysis, Insights and Forecast, 2021-2033
- 9.1. Market Analysis, Insights and Forecast - by Component
- 9.1.1. Discrete
- 9.1.2. Module
- 9.2. Market Analysis, Insights and Forecast - by Material
- 9.2.1. Silicon/Germanium
- 9.2.2. Silicon Carbide (SiC)
- 9.2.3. Gallium Nitride (GaN)
- 9.3. Market Analysis, Insights and Forecast - by End-user Industry
- 9.3.1. Automotive
- 9.3.2. Consumer Electronics
- 9.3.3. IT and Telecommunication
- 9.3.4. Military and Aerospace
- 9.3.5. Industrial
- 9.3.6. Energy and Power
- 9.3.7. Other End-user Industries
- 9.1. Market Analysis, Insights and Forecast - by Component
- 10. Latin America Power Electronics Market Analysis, Insights and Forecast, 2021-2033
- 10.1. Market Analysis, Insights and Forecast - by Component
- 10.1.1. Discrete
- 10.1.2. Module
- 10.2. Market Analysis, Insights and Forecast - by Material
- 10.2.1. Silicon/Germanium
- 10.2.2. Silicon Carbide (SiC)
- 10.2.3. Gallium Nitride (GaN)
- 10.3. Market Analysis, Insights and Forecast - by End-user Industry
- 10.3.1. Automotive
- 10.3.2. Consumer Electronics
- 10.3.3. IT and Telecommunication
- 10.3.4. Military and Aerospace
- 10.3.5. Industrial
- 10.3.6. Energy and Power
- 10.3.7. Other End-user Industries
- 10.1. Market Analysis, Insights and Forecast - by Component
- 11. Middle East and Africa Power Electronics Market Analysis, Insights and Forecast, 2021-2033
- 11.1. Market Analysis, Insights and Forecast - by Component
- 11.1.1. Discrete
- 11.1.2. Module
- 11.2. Market Analysis, Insights and Forecast - by Material
- 11.2.1. Silicon/Germanium
- 11.2.2. Silicon Carbide (SiC)
- 11.2.3. Gallium Nitride (GaN)
- 11.3. Market Analysis, Insights and Forecast - by End-user Industry
- 11.3.1. Automotive
- 11.3.2. Consumer Electronics
- 11.3.3. IT and Telecommunication
- 11.3.4. Military and Aerospace
- 11.3.5. Industrial
- 11.3.6. Energy and Power
- 11.3.7. Other End-user Industries
- 11.1. Market Analysis, Insights and Forecast - by Component
- 12. Competitive Analysis
- 12.1. Company Profiles
- 12.1.1 ROHM Co Ltd
- 12.1.1.1. Company Overview
- 12.1.1.2. Products
- 12.1.1.3. Company Financials
- 12.1.1.4. SWOT Analysis
- 12.1.2 Infineon Technologies AG
- 12.1.2.1. Company Overview
- 12.1.2.2. Products
- 12.1.2.3. Company Financials
- 12.1.2.4. SWOT Analysis
- 12.1.3 ABB Ltd
- 12.1.3.1. Company Overview
- 12.1.3.2. Products
- 12.1.3.3. Company Financials
- 12.1.3.4. SWOT Analysis
- 12.1.4 Mitsubishi Electric Corporation*List Not Exhaustive
- 12.1.4.1. Company Overview
- 12.1.4.2. Products
- 12.1.4.3. Company Financials
- 12.1.4.4. SWOT Analysis
- 12.1.5 Toshiba Corporation
- 12.1.5.1. Company Overview
- 12.1.5.2. Products
- 12.1.5.3. Company Financials
- 12.1.5.4. SWOT Analysis
- 12.1.6 STMicroelectronics NV
- 12.1.6.1. Company Overview
- 12.1.6.2. Products
- 12.1.6.3. Company Financials
- 12.1.6.4. SWOT Analysis
- 12.1.7 Texas instruments Inc
- 12.1.7.1. Company Overview
- 12.1.7.2. Products
- 12.1.7.3. Company Financials
- 12.1.7.4. SWOT Analysis
- 12.1.8 ON Semiconductor Corporation
- 12.1.8.1. Company Overview
- 12.1.8.2. Products
- 12.1.8.3. Company Financials
- 12.1.8.4. SWOT Analysis
- 12.1.9 Vishay Intertechnologies Inc
- 12.1.9.1. Company Overview
- 12.1.9.2. Products
- 12.1.9.3. Company Financials
- 12.1.9.4. SWOT Analysis
- 12.1.10 Renesas electronic corporation
- 12.1.10.1. Company Overview
- 12.1.10.2. Products
- 12.1.10.3. Company Financials
- 12.1.10.4. SWOT Analysis
- 12.1.1 ROHM Co Ltd
- 12.2. Market Entropy
- 12.2.1 Company's Key Areas Served
- 12.2.2 Recent Developments
- 12.3. Company Market Share Analysis 2025
- 12.3.1 Top 5 Companies Market Share Analysis
- 12.3.2 Top 3 Companies Market Share Analysis
- 12.4. List of Potential Customers
- 13. Research Methodology
List of Figures
- Figure 1: Global Power Electronics Market Revenue Breakdown (billion, %) by Region 2025 & 2033
- Figure 2: North America Power Electronics Market Revenue (billion), by Component 2025 & 2033
- Figure 3: North America Power Electronics Market Revenue Share (%), by Component 2025 & 2033
- Figure 4: North America Power Electronics Market Revenue (billion), by Material 2025 & 2033
- Figure 5: North America Power Electronics Market Revenue Share (%), by Material 2025 & 2033
- Figure 6: North America Power Electronics Market Revenue (billion), by End-user Industry 2025 & 2033
- Figure 7: North America Power Electronics Market Revenue Share (%), by End-user Industry 2025 & 2033
- Figure 8: North America Power Electronics Market Revenue (billion), by Country 2025 & 2033
- Figure 9: North America Power Electronics Market Revenue Share (%), by Country 2025 & 2033
- Figure 10: Europe Power Electronics Market Revenue (billion), by Component 2025 & 2033
- Figure 11: Europe Power Electronics Market Revenue Share (%), by Component 2025 & 2033
- Figure 12: Europe Power Electronics Market Revenue (billion), by Material 2025 & 2033
- Figure 13: Europe Power Electronics Market Revenue Share (%), by Material 2025 & 2033
- Figure 14: Europe Power Electronics Market Revenue (billion), by End-user Industry 2025 & 2033
- Figure 15: Europe Power Electronics Market Revenue Share (%), by End-user Industry 2025 & 2033
- Figure 16: Europe Power Electronics Market Revenue (billion), by Country 2025 & 2033
- Figure 17: Europe Power Electronics Market Revenue Share (%), by Country 2025 & 2033
- Figure 18: Asia Pacific Power Electronics Market Revenue (billion), by Component 2025 & 2033
- Figure 19: Asia Pacific Power Electronics Market Revenue Share (%), by Component 2025 & 2033
- Figure 20: Asia Pacific Power Electronics Market Revenue (billion), by Material 2025 & 2033
- Figure 21: Asia Pacific Power Electronics Market Revenue Share (%), by Material 2025 & 2033
- Figure 22: Asia Pacific Power Electronics Market Revenue (billion), by End-user Industry 2025 & 2033
- Figure 23: Asia Pacific Power Electronics Market Revenue Share (%), by End-user Industry 2025 & 2033
- Figure 24: Asia Pacific Power Electronics Market Revenue (billion), by Country 2025 & 2033
- Figure 25: Asia Pacific Power Electronics Market Revenue Share (%), by Country 2025 & 2033
- Figure 26: Latin America Power Electronics Market Revenue (billion), by Component 2025 & 2033
- Figure 27: Latin America Power Electronics Market Revenue Share (%), by Component 2025 & 2033
- Figure 28: Latin America Power Electronics Market Revenue (billion), by Material 2025 & 2033
- Figure 29: Latin America Power Electronics Market Revenue Share (%), by Material 2025 & 2033
- Figure 30: Latin America Power Electronics Market Revenue (billion), by End-user Industry 2025 & 2033
- Figure 31: Latin America Power Electronics Market Revenue Share (%), by End-user Industry 2025 & 2033
- Figure 32: Latin America Power Electronics Market Revenue (billion), by Country 2025 & 2033
- Figure 33: Latin America Power Electronics Market Revenue Share (%), by Country 2025 & 2033
- Figure 34: Middle East and Africa Power Electronics Market Revenue (billion), by Component 2025 & 2033
- Figure 35: Middle East and Africa Power Electronics Market Revenue Share (%), by Component 2025 & 2033
- Figure 36: Middle East and Africa Power Electronics Market Revenue (billion), by Material 2025 & 2033
- Figure 37: Middle East and Africa Power Electronics Market Revenue Share (%), by Material 2025 & 2033
- Figure 38: Middle East and Africa Power Electronics Market Revenue (billion), by End-user Industry 2025 & 2033
- Figure 39: Middle East and Africa Power Electronics Market Revenue Share (%), by End-user Industry 2025 & 2033
- Figure 40: Middle East and Africa Power Electronics Market Revenue (billion), by Country 2025 & 2033
- Figure 41: Middle East and Africa Power Electronics Market Revenue Share (%), by Country 2025 & 2033
List of Tables
- Table 1: Global Power Electronics Market Revenue billion Forecast, by Component 2020 & 2033
- Table 2: Global Power Electronics Market Revenue billion Forecast, by Material 2020 & 2033
- Table 3: Global Power Electronics Market Revenue billion Forecast, by End-user Industry 2020 & 2033
- Table 4: Global Power Electronics Market Revenue billion Forecast, by Region 2020 & 2033
- Table 5: Global Power Electronics Market Revenue billion Forecast, by Component 2020 & 2033
- Table 6: Global Power Electronics Market Revenue billion Forecast, by Material 2020 & 2033
- Table 7: Global Power Electronics Market Revenue billion Forecast, by End-user Industry 2020 & 2033
- Table 8: Global Power Electronics Market Revenue billion Forecast, by Country 2020 & 2033
- Table 9: Global Power Electronics Market Revenue billion Forecast, by Component 2020 & 2033
- Table 10: Global Power Electronics Market Revenue billion Forecast, by Material 2020 & 2033
- Table 11: Global Power Electronics Market Revenue billion Forecast, by End-user Industry 2020 & 2033
- Table 12: Global Power Electronics Market Revenue billion Forecast, by Country 2020 & 2033
- Table 13: Global Power Electronics Market Revenue billion Forecast, by Component 2020 & 2033
- Table 14: Global Power Electronics Market Revenue billion Forecast, by Material 2020 & 2033
- Table 15: Global Power Electronics Market Revenue billion Forecast, by End-user Industry 2020 & 2033
- Table 16: Global Power Electronics Market Revenue billion Forecast, by Country 2020 & 2033
- Table 17: Global Power Electronics Market Revenue billion Forecast, by Component 2020 & 2033
- Table 18: Global Power Electronics Market Revenue billion Forecast, by Material 2020 & 2033
- Table 19: Global Power Electronics Market Revenue billion Forecast, by End-user Industry 2020 & 2033
- Table 20: Global Power Electronics Market Revenue billion Forecast, by Country 2020 & 2033
- Table 21: Global Power Electronics Market Revenue billion Forecast, by Component 2020 & 2033
- Table 22: Global Power Electronics Market Revenue billion Forecast, by Material 2020 & 2033
- Table 23: Global Power Electronics Market Revenue billion Forecast, by End-user Industry 2020 & 2033
- Table 24: Global Power Electronics Market Revenue billion Forecast, by Country 2020 & 2033
Frequently Asked Questions
1. What is the projected Compound Annual Growth Rate (CAGR) of the Power Electronics Market?
The projected CAGR is approximately 5.4%.
2. Which companies are prominent players in the Power Electronics Market?
Key companies in the market include ROHM Co Ltd, Infineon Technologies AG, ABB Ltd, Mitsubishi Electric Corporation*List Not Exhaustive, Toshiba Corporation, STMicroelectronics NV, Texas instruments Inc, ON Semiconductor Corporation, Vishay Intertechnologies Inc, Renesas electronic corporation.
3. What are the main segments of the Power Electronics Market?
The market segments include Component, Material, End-user Industry.
4. Can you provide details about the market size?
The market size is estimated to be USD 51.73 billion as of 2022.
5. What are some drivers contributing to market growth?
Rising Demand for High-energy and Power-efficient Devices in the Electronics Segment; Demand for Green Energy Power Generation Drives.
6. What are the notable trends driving market growth?
Rising Demand for High-energy and Power-efficient Devices in the Electronics Segment is Expected to Drive the Market Growth.
7. Are there any restraints impacting market growth?
Rising Demand for Integrated Circuits.
8. Can you provide examples of recent developments in the market?
May 2023: Infineon Technologies AG has launched its latest generation of power MOSFETs for automotive applications, the OptiMOS 740 V MOSFET family, in a variety of lead-free and rugged performance packages. The new family combines 300 mm thin wafer technology with innovative packaging to offer significant performance benefits in a small package. This makes this MOSFET ideal for all standard and future 40 V automotive MOSFET applications, such as braking systems, electric power steering, circuit breakers, and new zone architectures.
9. What pricing options are available for accessing the report?
Pricing options include single-user, multi-user, and enterprise licenses priced at USD 4750, USD 5250, and USD 8750 respectively.
10. Is the market size provided in terms of value or volume?
The market size is provided in terms of value, measured in billion.
11. Are there any specific market keywords associated with the report?
Yes, the market keyword associated with the report is "Power Electronics Market," which aids in identifying and referencing the specific market segment covered.
12. How do I determine which pricing option suits my needs best?
The pricing options vary based on user requirements and access needs. Individual users may opt for single-user licenses, while businesses requiring broader access may choose multi-user or enterprise licenses for cost-effective access to the report.
13. Are there any additional resources or data provided in the Power Electronics Market report?
While the report offers comprehensive insights, it's advisable to review the specific contents or supplementary materials provided to ascertain if additional resources or data are available.
14. How can I stay updated on further developments or reports in the Power Electronics Market?
To stay informed about further developments, trends, and reports in the Power Electronics Market, consider subscribing to industry newsletters, following relevant companies and organizations, or regularly checking reputable industry news sources and publications.
Methodology
Step 1 - Identification of Relevant Samples Size from Population Database


Step 2 - Approaches for Defining Global Market Size (Value, Volume* & Price*)

Note*: In applicable scenarios
Step 3 - Data Sources
Primary Research
- Web Analytics
- Survey Reports
- Research Institute
- Latest Research Reports
- Opinion Leaders
Secondary Research
- Annual Reports
- White Paper
- Latest Press Release
- Industry Association
- Paid Database
- Investor Presentations

Step 4 - Data Triangulation
Involves using different sources of information in order to increase the validity of a study
These sources are likely to be stakeholders in a program - participants, other researchers, program staff, other community members, and so on.
Then we put all data in single framework & apply various statistical tools to find out the dynamic on the market.
During the analysis stage, feedback from the stakeholder groups would be compared to determine areas of agreement as well as areas of divergence