

Key Insights
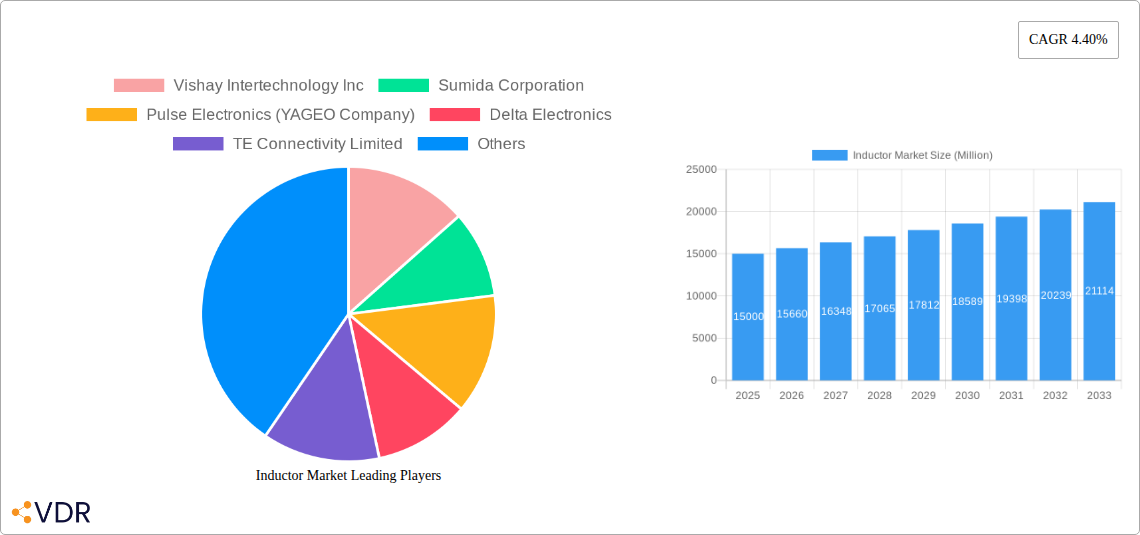
The global inductor market is poised for significant expansion, driven by escalating demand across diverse end-user industries. The compound annual growth rate (CAGR) of 6.49% from 2025 to 2033 underscores a consistent upward trajectory. This growth is primarily propelled by advancements in the automotive, aerospace and defense, and communications sectors. Miniaturization trends in electronics, particularly within consumer electronics and computing, are significantly influencing inductor design and demand, fostering a shift towards smaller, more efficient components. The automotive industry's transition to electric and hybrid vehicles is a pivotal driver, requiring advanced inductors for efficient power management and energy storage. Concurrently, the widespread adoption of 5G and other sophisticated communication technologies necessitates high-performance inductors capable of handling increased data rates and power demands. The projected market size for 2025 is estimated at $15.25 billion. Key market players, including Vishay Intertechnology, Murata Manufacturing, and TDK Corporation, alongside emerging competitors, are fueling innovation and price competitiveness. Challenges include the increasing complexity of inductor designs and the imperative for materials exhibiting enhanced performance characteristics. Further research into cost-effective and environmentally sustainable materials is critical for sustained growth in this vital electronic component sector.
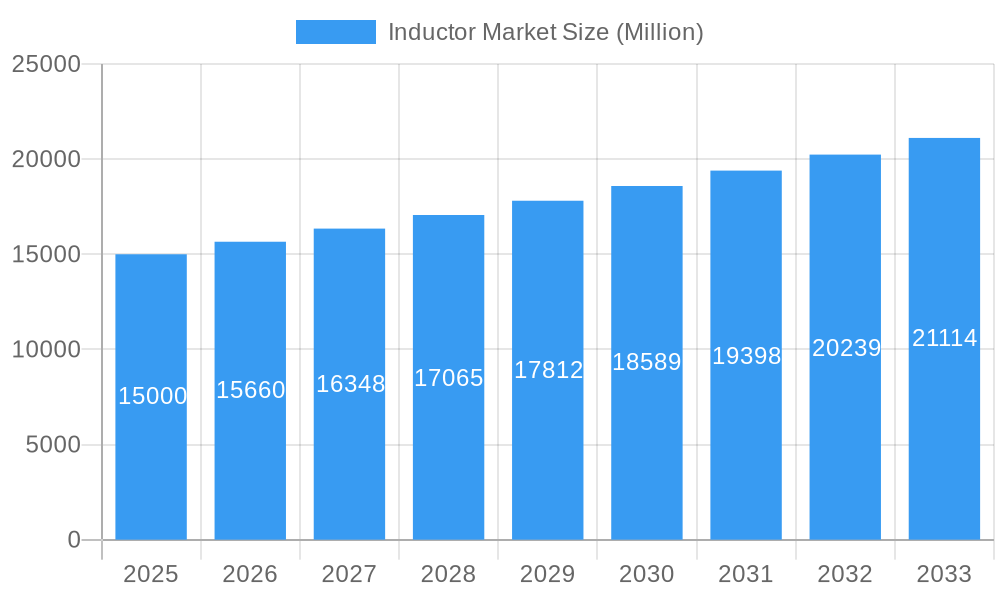
Inductor Market Market Size (In Billion)
Market segmentation highlights robust performance across various inductor types and end-user industries. Power inductors are projected to command a substantial market share due to their indispensable role in power management systems. The automotive sector is anticipated to lead end-user industry demand, reflecting the growing integration of electronics in vehicles. Geographically, the Asia-Pacific region is expected to capture a significant market share, driven by prominent electronics manufacturing hubs and the region's expanding consumer electronics market. North America and Europe are also projected to be significant contributors, bolstered by strong aerospace and defense sectors and advanced technology adoption. The forecast period (2025-2033) indicates sustained growth, primarily influenced by technological advancements, increased automation, and the ongoing digital transformation across various industries. Potential market restraints include supply chain vulnerabilities, fluctuations in raw material costs, and the emergence of alternative technologies.
Inductor Market Company Market Share
Inductor Market: A Comprehensive Report (2019-2033)
This comprehensive report provides a detailed analysis of the Inductor Market, encompassing market dynamics, growth trends, regional dominance, product landscape, key players, and future outlook. With a study period spanning 2019-2033, a base year of 2025, and a forecast period of 2025-2033, this report offers invaluable insights for industry professionals, investors, and strategic decision-makers. The market is segmented by type (Power, Frequency) and end-user industry (Automotive, Aerospace and Defense, Communications, Consumer Electronics and Computing, Other End-User Industries). The report's quantitative and qualitative analysis is based on extensive research and includes detailed market sizing (in Million units).
Inductor Market Dynamics & Structure
The Inductor Market exhibits a moderately consolidated structure, with key players holding significant market share. The market's growth is driven by technological innovations focused on miniaturization, increased efficiency, and improved power handling capabilities. Stringent regulatory frameworks regarding energy efficiency and electromagnetic interference (EMI) also significantly influence market dynamics. Competitive substitutes, such as alternative passive components, pose a challenge. End-user demographics, particularly the burgeoning automotive and consumer electronics sectors, play a crucial role in driving demand. Mergers and acquisitions (M&A) activity in the industry is relatively frequent, reflecting consolidation and strategic expansion efforts.
- Market Concentration: xx% held by top 5 players in 2024.
- Technological Innovation: Focus on miniaturization, higher power density, and improved EMI performance.
- Regulatory Landscape: Increasingly stringent regulations related to energy efficiency and environmental impact.
- Competitive Substitutes: Capacitors and other passive components present some level of competition.
- M&A Activity: xx major M&A deals recorded between 2019 and 2024.
- Innovation Barriers: High R&D costs and challenges in miniaturizing components while maintaining performance.
Inductor Market Growth Trends & Insights
The Inductor Market experienced a CAGR of xx% during the historical period (2019-2024), reaching a market size of xx Million units in 2024. This growth is projected to continue at a CAGR of xx% during the forecast period (2025-2033), driven by factors such as the increasing adoption of electric vehicles, the proliferation of connected devices, and the expansion of 5G networks. Technological disruptions, such as the development of high-frequency inductors and advanced materials, are further accelerating market growth. Shifting consumer preferences towards smaller, more efficient electronic devices are also contributing factors. Market penetration in key end-user segments remains relatively high, with significant opportunities for expansion in emerging markets.
Dominant Regions, Countries, or Segments in Inductor Market
The Asia-Pacific region is currently the dominant market for inductors, holding the largest market share of xx% in 2024, driven by significant growth in the consumer electronics and automotive sectors within countries like China, Japan, and South Korea. North America and Europe also hold substantial shares, with steady growth anticipated.
By Type:
- Power Inductors: Dominating the market due to their widespread use in power supply units and other power electronics applications.
- Frequency Inductors: Experiencing significant growth driven by the increasing demand for high-frequency applications in 5G and other communication technologies.
By End-User Industry:
- Automotive: Fastest-growing segment, fueled by the rising adoption of electric and hybrid vehicles.
- Consumer Electronics and Computing: A large and established market segment, with consistent demand for inductors in various electronic devices.
- Aerospace and Defense: A niche market with strong demand for high-reliability inductors.
Key Drivers:
- Strong economic growth in developing economies.
- Increasing government investments in infrastructure projects.
- Growing demand for energy-efficient electronics.
Inductor Market Product Landscape
The inductor market showcases continuous product innovation, focusing on enhancing performance metrics like miniaturization, increased power density, and improved efficiency. New materials and advanced manufacturing techniques are being utilized to create smaller, lighter, and more reliable inductors. Unique selling propositions often revolve around improved thermal management, lower EMI, and superior frequency response. Recent advancements include the incorporation of integrated circuitry and the development of novel inductor designs to cater to specific application needs.
Key Drivers, Barriers & Challenges in Inductor Market
Key Drivers:
- The rising demand for miniaturized electronics in various applications is a major driver for the inductor market.
- The expanding automotive industry, particularly the growth of electric vehicles (EVs), significantly boosts the demand for power inductors.
- Advancements in 5G and other communication technologies are driving the growth of high-frequency inductors.
Challenges & Restraints:
- Fluctuations in raw material prices can impact the cost and profitability of inductor manufacturing.
- Intense competition among established and emerging players creates pricing pressures.
- Regulatory compliance and certifications add to the cost and complexity of product development.
Emerging Opportunities in Inductor Market
Emerging opportunities lie in the development of inductors for next-generation applications such as autonomous vehicles, wearable electronics, and advanced medical devices. Untapped markets in developing economies, particularly in Asia and Africa, offer significant potential for growth. Innovative applications of inductors in energy harvesting and wireless power transfer also present promising prospects. The growing demand for high-frequency inductors in 5G and beyond-5G infrastructure represents another key opportunity.
Growth Accelerators in the Inductor Market Industry
Long-term growth in the inductor market will be driven by ongoing technological advancements, particularly in materials science and manufacturing processes. Strategic partnerships and collaborations between inductor manufacturers and end-user industries are expected to fuel innovation and accelerate market expansion. Government initiatives promoting energy efficiency and the adoption of advanced technologies will further stimulate market growth.
Key Players Shaping the Inductor Market Market
- Vishay Intertechnology Inc
- Sumida Corporation
- Pulse Electronics (YAGEO Company)
- Delta Electronics
- TE Connectivity Limited
- Taiyo Yuden Co Ltd
- TDK Corporation
- Coilcraft Inc
- Murata Manufacturing Co Ltd
- Sagami Elec Co Ltd
- Panasonic Corporation
Notable Milestones in Inductor Market Sector
- January 2022: Panasonic Corporation commercialized a low-loss, highly vibration-resistant surface-mounted vehicle power inductor (PCC-M15A0MF series), addressing the demand for higher working currents and smaller ECU board sizes in the automotive sector.
- January 2022: The YAGEO group completed the acquisition of Chilisin Electronics Corporation, creating Pulse Electronics through the integration of Chilisin with its affiliated companies. This significantly reshaped the market landscape.
In-Depth Inductor Market Market Outlook
The future of the Inductor Market appears bright, with sustained growth driven by technological innovation and increasing demand from diverse sectors. Strategic partnerships, expansion into new markets, and continuous product development will be crucial for success. The market presents significant opportunities for companies that can effectively adapt to evolving technological advancements and customer needs. The focus on miniaturization, higher efficiency, and improved reliability will continue to shape the market landscape.
Inductor Market Segmentation
- 1. Production Analysis
- 2. Consumption Analysis
- 3. Import Market Analysis (Value & Volume)
- 4. Export Market Analysis (Value & Volume)
- 5. Price Trend Analysis
Inductor Market Segmentation By Geography
-
1. North America
- 1.1. United States
- 1.2. Canada
- 1.3. Mexico
-
2. South America
- 2.1. Brazil
- 2.2. Argentina
- 2.3. Rest of South America
-
3. Europe
- 3.1. United Kingdom
- 3.2. Germany
- 3.3. France
- 3.4. Italy
- 3.5. Spain
- 3.6. Russia
- 3.7. Benelux
- 3.8. Nordics
- 3.9. Rest of Europe
-
4. Middle East & Africa
- 4.1. Turkey
- 4.2. Israel
- 4.3. GCC
- 4.4. North Africa
- 4.5. South Africa
- 4.6. Rest of Middle East & Africa
-
5. Asia Pacific
- 5.1. China
- 5.2. India
- 5.3. Japan
- 5.4. South Korea
- 5.5. ASEAN
- 5.6. Oceania
- 5.7. Rest of Asia Pacific
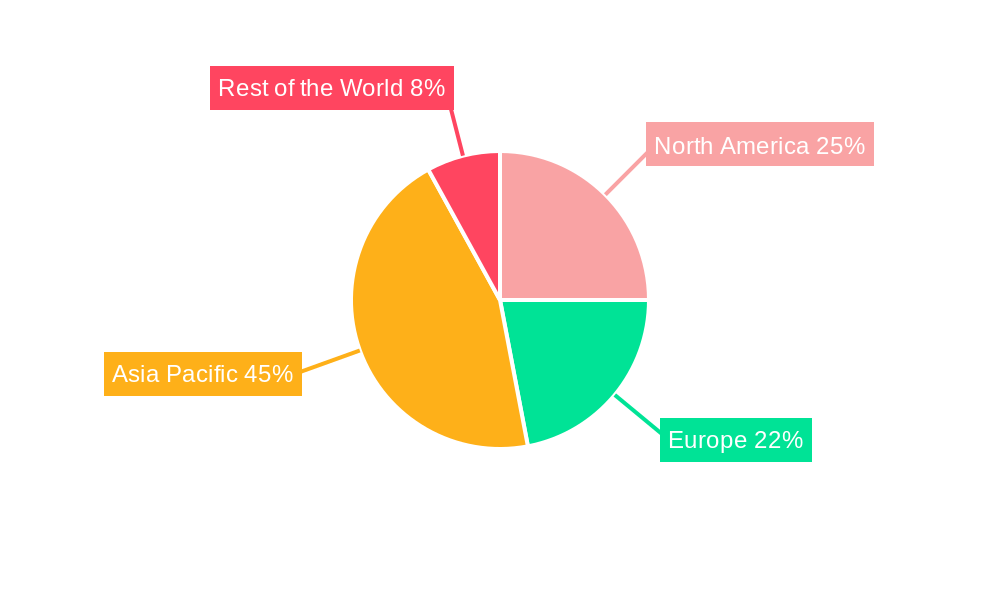
Inductor Market Regional Market Share
Geographic Coverage of Inductor Market
Inductor Market REPORT HIGHLIGHTS
| Aspects | Details |
|---|---|
| Study Period | 2020-2034 |
| Base Year | 2025 |
| Estimated Year | 2026 |
| Forecast Period | 2026-2034 |
| Historical Period | 2020-2025 |
| Growth Rate | CAGR of 6.49% from 2020-2034 |
| Segmentation |
|
Table of Contents
- 1. Introduction
- 1.1. Research Scope
- 1.2. Market Segmentation
- 1.3. Research Objective
- 1.4. Definitions and Assumptions
- 2. Executive Summary
- 2.1. Market Snapshot
- 3. Market Dynamics
- 3.1. Market Drivers
- 3.2. Market Restrains
- 3.3. Market Trends
- 3.4. Market Opportunities
- 4. Market Factor Analysis
- 4.1. Porters Five Forces
- 4.1.1. Bargaining Power of Suppliers
- 4.1.2. Bargaining Power of Buyers
- 4.1.3. Threat of New Entrants
- 4.1.4. Threat of Substitutes
- 4.1.5. Competitive Rivalry
- 4.2. PESTEL analysis
- 4.3. BCG Analysis
- 4.3.1. Stars (High Growth, High Market Share)
- 4.3.2. Cash Cows (Low Growth, High Market Share)
- 4.3.3. Question Mark (High Growth, Low Market Share)
- 4.3.4. Dogs (Low Growth, Low Market Share)
- 4.4. Ansoff Matrix Analysis
- 4.5. Supply Chain Analysis
- 4.6. Regulatory Landscape
- 4.7. Current Market Potential and Opportunity Assessment (TAM–SAM–SOM Framework)
- 4.8. VDR Analyst Note
- 4.1. Porters Five Forces
- 5. Market Analysis, Insights and Forecast 2021-2033
- 5.1. Market Analysis, Insights and Forecast - by Production Analysis
- 5.2. Market Analysis, Insights and Forecast - by Consumption Analysis
- 5.3. Market Analysis, Insights and Forecast - by Import Market Analysis (Value & Volume)
- 5.4. Market Analysis, Insights and Forecast - by Export Market Analysis (Value & Volume)
- 5.5. Market Analysis, Insights and Forecast - by Price Trend Analysis
- 5.6. Market Analysis, Insights and Forecast - by Region
- 5.6.1. North America
- 5.6.2. South America
- 5.6.3. Europe
- 5.6.4. Middle East & Africa
- 5.6.5. Asia Pacific
- 6. Global Inductor Market Analysis, Insights and Forecast, 2021-2033
- 6.1. Market Analysis, Insights and Forecast - by Production Analysis
- 6.2. Market Analysis, Insights and Forecast - by Consumption Analysis
- 6.3. Market Analysis, Insights and Forecast - by Import Market Analysis (Value & Volume)
- 6.4. Market Analysis, Insights and Forecast - by Export Market Analysis (Value & Volume)
- 6.5. Market Analysis, Insights and Forecast - by Price Trend Analysis
- 7. North America Inductor Market Analysis, Insights and Forecast, 2021-2033
- 7.1. Market Analysis, Insights and Forecast - by Production Analysis
- 7.2. Market Analysis, Insights and Forecast - by Consumption Analysis
- 7.3. Market Analysis, Insights and Forecast - by Import Market Analysis (Value & Volume)
- 7.4. Market Analysis, Insights and Forecast - by Export Market Analysis (Value & Volume)
- 7.5. Market Analysis, Insights and Forecast - by Price Trend Analysis
- 8. South America Inductor Market Analysis, Insights and Forecast, 2021-2033
- 8.1. Market Analysis, Insights and Forecast - by Production Analysis
- 8.2. Market Analysis, Insights and Forecast - by Consumption Analysis
- 8.3. Market Analysis, Insights and Forecast - by Import Market Analysis (Value & Volume)
- 8.4. Market Analysis, Insights and Forecast - by Export Market Analysis (Value & Volume)
- 8.5. Market Analysis, Insights and Forecast - by Price Trend Analysis
- 9. Europe Inductor Market Analysis, Insights and Forecast, 2021-2033
- 9.1. Market Analysis, Insights and Forecast - by Production Analysis
- 9.2. Market Analysis, Insights and Forecast - by Consumption Analysis
- 9.3. Market Analysis, Insights and Forecast - by Import Market Analysis (Value & Volume)
- 9.4. Market Analysis, Insights and Forecast - by Export Market Analysis (Value & Volume)
- 9.5. Market Analysis, Insights and Forecast - by Price Trend Analysis
- 10. Middle East & Africa Inductor Market Analysis, Insights and Forecast, 2021-2033
- 10.1. Market Analysis, Insights and Forecast - by Production Analysis
- 10.2. Market Analysis, Insights and Forecast - by Consumption Analysis
- 10.3. Market Analysis, Insights and Forecast - by Import Market Analysis (Value & Volume)
- 10.4. Market Analysis, Insights and Forecast - by Export Market Analysis (Value & Volume)
- 10.5. Market Analysis, Insights and Forecast - by Price Trend Analysis
- 11. Asia Pacific Inductor Market Analysis, Insights and Forecast, 2021-2033
- 11.1. Market Analysis, Insights and Forecast - by Production Analysis
- 11.2. Market Analysis, Insights and Forecast - by Consumption Analysis
- 11.3. Market Analysis, Insights and Forecast - by Import Market Analysis (Value & Volume)
- 11.4. Market Analysis, Insights and Forecast - by Export Market Analysis (Value & Volume)
- 11.5. Market Analysis, Insights and Forecast - by Price Trend Analysis
- 12. Competitive Analysis
- 12.1. Company Profiles
- 12.1.1 Vishay Intertechnology Inc
- 12.1.1.1. Company Overview
- 12.1.1.2. Products
- 12.1.1.3. Company Financials
- 12.1.1.4. SWOT Analysis
- 12.1.2 Sumida Corporation
- 12.1.2.1. Company Overview
- 12.1.2.2. Products
- 12.1.2.3. Company Financials
- 12.1.2.4. SWOT Analysis
- 12.1.3 Pulse Electronics (YAGEO Company)
- 12.1.3.1. Company Overview
- 12.1.3.2. Products
- 12.1.3.3. Company Financials
- 12.1.3.4. SWOT Analysis
- 12.1.4 Delta Electronics
- 12.1.4.1. Company Overview
- 12.1.4.2. Products
- 12.1.4.3. Company Financials
- 12.1.4.4. SWOT Analysis
- 12.1.5 TE Connectivity Limited
- 12.1.5.1. Company Overview
- 12.1.5.2. Products
- 12.1.5.3. Company Financials
- 12.1.5.4. SWOT Analysis
- 12.1.6 Taiyo Yuden Co Ltd
- 12.1.6.1. Company Overview
- 12.1.6.2. Products
- 12.1.6.3. Company Financials
- 12.1.6.4. SWOT Analysis
- 12.1.7 TDK Corporation
- 12.1.7.1. Company Overview
- 12.1.7.2. Products
- 12.1.7.3. Company Financials
- 12.1.7.4. SWOT Analysis
- 12.1.8 Coilcraft Inc *List Not Exhaustive
- 12.1.8.1. Company Overview
- 12.1.8.2. Products
- 12.1.8.3. Company Financials
- 12.1.8.4. SWOT Analysis
- 12.1.9 Murata Manufacturing Co Ltd
- 12.1.9.1. Company Overview
- 12.1.9.2. Products
- 12.1.9.3. Company Financials
- 12.1.9.4. SWOT Analysis
- 12.1.10 Sagami Elec Co Ltd
- 12.1.10.1. Company Overview
- 12.1.10.2. Products
- 12.1.10.3. Company Financials
- 12.1.10.4. SWOT Analysis
- 12.1.11 Panasonic Corporation
- 12.1.11.1. Company Overview
- 12.1.11.2. Products
- 12.1.11.3. Company Financials
- 12.1.11.4. SWOT Analysis
- 12.1.1 Vishay Intertechnology Inc
- 12.2. Market Entropy
- 12.2.1 Company's Key Areas Served
- 12.2.2 Recent Developments
- 12.3. Company Market Share Analysis 2025
- 12.3.1 Top 5 Companies Market Share Analysis
- 12.3.2 Top 3 Companies Market Share Analysis
- 12.4. List of Potential Customers
- 13. Research Methodology
List of Figures
- Figure 1: Global Inductor Market Revenue Breakdown (billion, %) by Region 2025 & 2033
- Figure 2: North America Inductor Market Revenue (billion), by Production Analysis 2025 & 2033
- Figure 3: North America Inductor Market Revenue Share (%), by Production Analysis 2025 & 2033
- Figure 4: North America Inductor Market Revenue (billion), by Consumption Analysis 2025 & 2033
- Figure 5: North America Inductor Market Revenue Share (%), by Consumption Analysis 2025 & 2033
- Figure 6: North America Inductor Market Revenue (billion), by Import Market Analysis (Value & Volume) 2025 & 2033
- Figure 7: North America Inductor Market Revenue Share (%), by Import Market Analysis (Value & Volume) 2025 & 2033
- Figure 8: North America Inductor Market Revenue (billion), by Export Market Analysis (Value & Volume) 2025 & 2033
- Figure 9: North America Inductor Market Revenue Share (%), by Export Market Analysis (Value & Volume) 2025 & 2033
- Figure 10: North America Inductor Market Revenue (billion), by Price Trend Analysis 2025 & 2033
- Figure 11: North America Inductor Market Revenue Share (%), by Price Trend Analysis 2025 & 2033
- Figure 12: North America Inductor Market Revenue (billion), by Country 2025 & 2033
- Figure 13: North America Inductor Market Revenue Share (%), by Country 2025 & 2033
- Figure 14: South America Inductor Market Revenue (billion), by Production Analysis 2025 & 2033
- Figure 15: South America Inductor Market Revenue Share (%), by Production Analysis 2025 & 2033
- Figure 16: South America Inductor Market Revenue (billion), by Consumption Analysis 2025 & 2033
- Figure 17: South America Inductor Market Revenue Share (%), by Consumption Analysis 2025 & 2033
- Figure 18: South America Inductor Market Revenue (billion), by Import Market Analysis (Value & Volume) 2025 & 2033
- Figure 19: South America Inductor Market Revenue Share (%), by Import Market Analysis (Value & Volume) 2025 & 2033
- Figure 20: South America Inductor Market Revenue (billion), by Export Market Analysis (Value & Volume) 2025 & 2033
- Figure 21: South America Inductor Market Revenue Share (%), by Export Market Analysis (Value & Volume) 2025 & 2033
- Figure 22: South America Inductor Market Revenue (billion), by Price Trend Analysis 2025 & 2033
- Figure 23: South America Inductor Market Revenue Share (%), by Price Trend Analysis 2025 & 2033
- Figure 24: South America Inductor Market Revenue (billion), by Country 2025 & 2033
- Figure 25: South America Inductor Market Revenue Share (%), by Country 2025 & 2033
- Figure 26: Europe Inductor Market Revenue (billion), by Production Analysis 2025 & 2033
- Figure 27: Europe Inductor Market Revenue Share (%), by Production Analysis 2025 & 2033
- Figure 28: Europe Inductor Market Revenue (billion), by Consumption Analysis 2025 & 2033
- Figure 29: Europe Inductor Market Revenue Share (%), by Consumption Analysis 2025 & 2033
- Figure 30: Europe Inductor Market Revenue (billion), by Import Market Analysis (Value & Volume) 2025 & 2033
- Figure 31: Europe Inductor Market Revenue Share (%), by Import Market Analysis (Value & Volume) 2025 & 2033
- Figure 32: Europe Inductor Market Revenue (billion), by Export Market Analysis (Value & Volume) 2025 & 2033
- Figure 33: Europe Inductor Market Revenue Share (%), by Export Market Analysis (Value & Volume) 2025 & 2033
- Figure 34: Europe Inductor Market Revenue (billion), by Price Trend Analysis 2025 & 2033
- Figure 35: Europe Inductor Market Revenue Share (%), by Price Trend Analysis 2025 & 2033
- Figure 36: Europe Inductor Market Revenue (billion), by Country 2025 & 2033
- Figure 37: Europe Inductor Market Revenue Share (%), by Country 2025 & 2033
- Figure 38: Middle East & Africa Inductor Market Revenue (billion), by Production Analysis 2025 & 2033
- Figure 39: Middle East & Africa Inductor Market Revenue Share (%), by Production Analysis 2025 & 2033
- Figure 40: Middle East & Africa Inductor Market Revenue (billion), by Consumption Analysis 2025 & 2033
- Figure 41: Middle East & Africa Inductor Market Revenue Share (%), by Consumption Analysis 2025 & 2033
- Figure 42: Middle East & Africa Inductor Market Revenue (billion), by Import Market Analysis (Value & Volume) 2025 & 2033
- Figure 43: Middle East & Africa Inductor Market Revenue Share (%), by Import Market Analysis (Value & Volume) 2025 & 2033
- Figure 44: Middle East & Africa Inductor Market Revenue (billion), by Export Market Analysis (Value & Volume) 2025 & 2033
- Figure 45: Middle East & Africa Inductor Market Revenue Share (%), by Export Market Analysis (Value & Volume) 2025 & 2033
- Figure 46: Middle East & Africa Inductor Market Revenue (billion), by Price Trend Analysis 2025 & 2033
- Figure 47: Middle East & Africa Inductor Market Revenue Share (%), by Price Trend Analysis 2025 & 2033
- Figure 48: Middle East & Africa Inductor Market Revenue (billion), by Country 2025 & 2033
- Figure 49: Middle East & Africa Inductor Market Revenue Share (%), by Country 2025 & 2033
- Figure 50: Asia Pacific Inductor Market Revenue (billion), by Production Analysis 2025 & 2033
- Figure 51: Asia Pacific Inductor Market Revenue Share (%), by Production Analysis 2025 & 2033
- Figure 52: Asia Pacific Inductor Market Revenue (billion), by Consumption Analysis 2025 & 2033
- Figure 53: Asia Pacific Inductor Market Revenue Share (%), by Consumption Analysis 2025 & 2033
- Figure 54: Asia Pacific Inductor Market Revenue (billion), by Import Market Analysis (Value & Volume) 2025 & 2033
- Figure 55: Asia Pacific Inductor Market Revenue Share (%), by Import Market Analysis (Value & Volume) 2025 & 2033
- Figure 56: Asia Pacific Inductor Market Revenue (billion), by Export Market Analysis (Value & Volume) 2025 & 2033
- Figure 57: Asia Pacific Inductor Market Revenue Share (%), by Export Market Analysis (Value & Volume) 2025 & 2033
- Figure 58: Asia Pacific Inductor Market Revenue (billion), by Price Trend Analysis 2025 & 2033
- Figure 59: Asia Pacific Inductor Market Revenue Share (%), by Price Trend Analysis 2025 & 2033
- Figure 60: Asia Pacific Inductor Market Revenue (billion), by Country 2025 & 2033
- Figure 61: Asia Pacific Inductor Market Revenue Share (%), by Country 2025 & 2033
List of Tables
- Table 1: Global Inductor Market Revenue billion Forecast, by Production Analysis 2020 & 2033
- Table 2: Global Inductor Market Revenue billion Forecast, by Consumption Analysis 2020 & 2033
- Table 3: Global Inductor Market Revenue billion Forecast, by Import Market Analysis (Value & Volume) 2020 & 2033
- Table 4: Global Inductor Market Revenue billion Forecast, by Export Market Analysis (Value & Volume) 2020 & 2033
- Table 5: Global Inductor Market Revenue billion Forecast, by Price Trend Analysis 2020 & 2033
- Table 6: Global Inductor Market Revenue billion Forecast, by Region 2020 & 2033
- Table 7: Global Inductor Market Revenue billion Forecast, by Production Analysis 2020 & 2033
- Table 8: Global Inductor Market Revenue billion Forecast, by Consumption Analysis 2020 & 2033
- Table 9: Global Inductor Market Revenue billion Forecast, by Import Market Analysis (Value & Volume) 2020 & 2033
- Table 10: Global Inductor Market Revenue billion Forecast, by Export Market Analysis (Value & Volume) 2020 & 2033
- Table 11: Global Inductor Market Revenue billion Forecast, by Price Trend Analysis 2020 & 2033
- Table 12: Global Inductor Market Revenue billion Forecast, by Country 2020 & 2033
- Table 13: United States Inductor Market Revenue (billion) Forecast, by Application 2020 & 2033
- Table 14: Canada Inductor Market Revenue (billion) Forecast, by Application 2020 & 2033
- Table 15: Mexico Inductor Market Revenue (billion) Forecast, by Application 2020 & 2033
- Table 16: Global Inductor Market Revenue billion Forecast, by Production Analysis 2020 & 2033
- Table 17: Global Inductor Market Revenue billion Forecast, by Consumption Analysis 2020 & 2033
- Table 18: Global Inductor Market Revenue billion Forecast, by Import Market Analysis (Value & Volume) 2020 & 2033
- Table 19: Global Inductor Market Revenue billion Forecast, by Export Market Analysis (Value & Volume) 2020 & 2033
- Table 20: Global Inductor Market Revenue billion Forecast, by Price Trend Analysis 2020 & 2033
- Table 21: Global Inductor Market Revenue billion Forecast, by Country 2020 & 2033
- Table 22: Brazil Inductor Market Revenue (billion) Forecast, by Application 2020 & 2033
- Table 23: Argentina Inductor Market Revenue (billion) Forecast, by Application 2020 & 2033
- Table 24: Rest of South America Inductor Market Revenue (billion) Forecast, by Application 2020 & 2033
- Table 25: Global Inductor Market Revenue billion Forecast, by Production Analysis 2020 & 2033
- Table 26: Global Inductor Market Revenue billion Forecast, by Consumption Analysis 2020 & 2033
- Table 27: Global Inductor Market Revenue billion Forecast, by Import Market Analysis (Value & Volume) 2020 & 2033
- Table 28: Global Inductor Market Revenue billion Forecast, by Export Market Analysis (Value & Volume) 2020 & 2033
- Table 29: Global Inductor Market Revenue billion Forecast, by Price Trend Analysis 2020 & 2033
- Table 30: Global Inductor Market Revenue billion Forecast, by Country 2020 & 2033
- Table 31: United Kingdom Inductor Market Revenue (billion) Forecast, by Application 2020 & 2033
- Table 32: Germany Inductor Market Revenue (billion) Forecast, by Application 2020 & 2033
- Table 33: France Inductor Market Revenue (billion) Forecast, by Application 2020 & 2033
- Table 34: Italy Inductor Market Revenue (billion) Forecast, by Application 2020 & 2033
- Table 35: Spain Inductor Market Revenue (billion) Forecast, by Application 2020 & 2033
- Table 36: Russia Inductor Market Revenue (billion) Forecast, by Application 2020 & 2033
- Table 37: Benelux Inductor Market Revenue (billion) Forecast, by Application 2020 & 2033
- Table 38: Nordics Inductor Market Revenue (billion) Forecast, by Application 2020 & 2033
- Table 39: Rest of Europe Inductor Market Revenue (billion) Forecast, by Application 2020 & 2033
- Table 40: Global Inductor Market Revenue billion Forecast, by Production Analysis 2020 & 2033
- Table 41: Global Inductor Market Revenue billion Forecast, by Consumption Analysis 2020 & 2033
- Table 42: Global Inductor Market Revenue billion Forecast, by Import Market Analysis (Value & Volume) 2020 & 2033
- Table 43: Global Inductor Market Revenue billion Forecast, by Export Market Analysis (Value & Volume) 2020 & 2033
- Table 44: Global Inductor Market Revenue billion Forecast, by Price Trend Analysis 2020 & 2033
- Table 45: Global Inductor Market Revenue billion Forecast, by Country 2020 & 2033
- Table 46: Turkey Inductor Market Revenue (billion) Forecast, by Application 2020 & 2033
- Table 47: Israel Inductor Market Revenue (billion) Forecast, by Application 2020 & 2033
- Table 48: GCC Inductor Market Revenue (billion) Forecast, by Application 2020 & 2033
- Table 49: North Africa Inductor Market Revenue (billion) Forecast, by Application 2020 & 2033
- Table 50: South Africa Inductor Market Revenue (billion) Forecast, by Application 2020 & 2033
- Table 51: Rest of Middle East & Africa Inductor Market Revenue (billion) Forecast, by Application 2020 & 2033
- Table 52: Global Inductor Market Revenue billion Forecast, by Production Analysis 2020 & 2033
- Table 53: Global Inductor Market Revenue billion Forecast, by Consumption Analysis 2020 & 2033
- Table 54: Global Inductor Market Revenue billion Forecast, by Import Market Analysis (Value & Volume) 2020 & 2033
- Table 55: Global Inductor Market Revenue billion Forecast, by Export Market Analysis (Value & Volume) 2020 & 2033
- Table 56: Global Inductor Market Revenue billion Forecast, by Price Trend Analysis 2020 & 2033
- Table 57: Global Inductor Market Revenue billion Forecast, by Country 2020 & 2033
- Table 58: China Inductor Market Revenue (billion) Forecast, by Application 2020 & 2033
- Table 59: India Inductor Market Revenue (billion) Forecast, by Application 2020 & 2033
- Table 60: Japan Inductor Market Revenue (billion) Forecast, by Application 2020 & 2033
- Table 61: South Korea Inductor Market Revenue (billion) Forecast, by Application 2020 & 2033
- Table 62: ASEAN Inductor Market Revenue (billion) Forecast, by Application 2020 & 2033
- Table 63: Oceania Inductor Market Revenue (billion) Forecast, by Application 2020 & 2033
- Table 64: Rest of Asia Pacific Inductor Market Revenue (billion) Forecast, by Application 2020 & 2033
Frequently Asked Questions
1. What is the projected Compound Annual Growth Rate (CAGR) of the Inductor Market?
The projected CAGR is approximately 6.49%.
2. Which companies are prominent players in the Inductor Market?
Key companies in the market include Vishay Intertechnology Inc, Sumida Corporation, Pulse Electronics (YAGEO Company), Delta Electronics, TE Connectivity Limited, Taiyo Yuden Co Ltd, TDK Corporation, Coilcraft Inc *List Not Exhaustive, Murata Manufacturing Co Ltd, Sagami Elec Co Ltd, Panasonic Corporation.
3. What are the main segments of the Inductor Market?
The market segments include Production Analysis, Consumption Analysis, Import Market Analysis (Value & Volume), Export Market Analysis (Value & Volume), Price Trend Analysis.
4. Can you provide details about the market size?
The market size is estimated to be USD 15.25 billion as of 2022.
5. What are some drivers contributing to market growth?
Rise in Innovations in Consumer Electronics Products; Growing Demand for Energy Efficient Electrical and Electronic Systems.
6. What are the notable trends driving market growth?
Automotive Industry Segment is Expected to Register Significant Growth.
7. Are there any restraints impacting market growth?
Rising Cost of Raw Materials. Especially Copper.
8. Can you provide examples of recent developments in the market?
January 2022: A low-loss, highly vibration-resistant surface-mounted vehicle power inductor (PCC-M15A0MF series) commercialized, according to an announcement from Panasonic Corporation's Industry Company. Due to the rising performance of automotive device operations, the market demands for bigger working currents and reduced ECU (Electronic Control Unit) board sizes have been met by this 15.6 mm square inductor. By conserving space in the mounting regions for power circuits, the firm will increase the dependability of power circuits with these incredibly dependable PCC-M15A0MF series power inductors. To meet market demands, the product portfolio will also be improved in the future by extending the inductance range of available products.
9. What pricing options are available for accessing the report?
Pricing options include single-user, multi-user, and enterprise licenses priced at USD 4750, USD 5250, and USD 8750 respectively.
10. Is the market size provided in terms of value or volume?
The market size is provided in terms of value, measured in billion.
11. Are there any specific market keywords associated with the report?
Yes, the market keyword associated with the report is "Inductor Market," which aids in identifying and referencing the specific market segment covered.
12. How do I determine which pricing option suits my needs best?
The pricing options vary based on user requirements and access needs. Individual users may opt for single-user licenses, while businesses requiring broader access may choose multi-user or enterprise licenses for cost-effective access to the report.
13. Are there any additional resources or data provided in the Inductor Market report?
While the report offers comprehensive insights, it's advisable to review the specific contents or supplementary materials provided to ascertain if additional resources or data are available.
14. How can I stay updated on further developments or reports in the Inductor Market?
To stay informed about further developments, trends, and reports in the Inductor Market, consider subscribing to industry newsletters, following relevant companies and organizations, or regularly checking reputable industry news sources and publications.
Methodology
Step 1 - Identification of Relevant Samples Size from Population Database


Step 2 - Approaches for Defining Global Market Size (Value, Volume* & Price*)

Note*: In applicable scenarios
Step 3 - Data Sources
Primary Research
- Web Analytics
- Survey Reports
- Research Institute
- Latest Research Reports
- Opinion Leaders
Secondary Research
- Annual Reports
- White Paper
- Latest Press Release
- Industry Association
- Paid Database
- Investor Presentations

Step 4 - Data Triangulation
Involves using different sources of information in order to increase the validity of a study
These sources are likely to be stakeholders in a program - participants, other researchers, program staff, other community members, and so on.
Then we put all data in single framework & apply various statistical tools to find out the dynamic on the market.
During the analysis stage, feedback from the stakeholder groups would be compared to determine areas of agreement as well as areas of divergence