
Key Insights
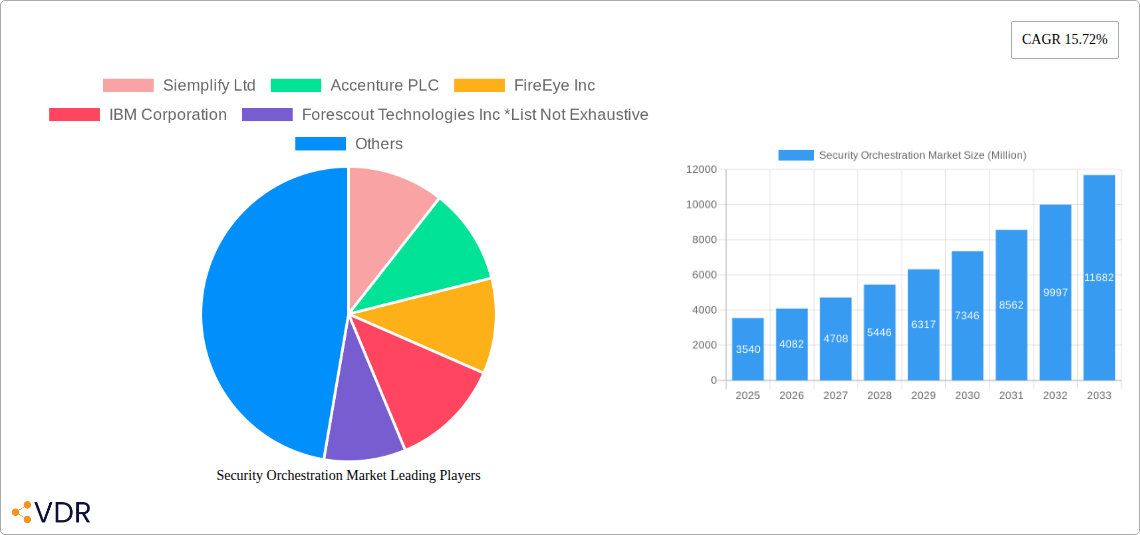
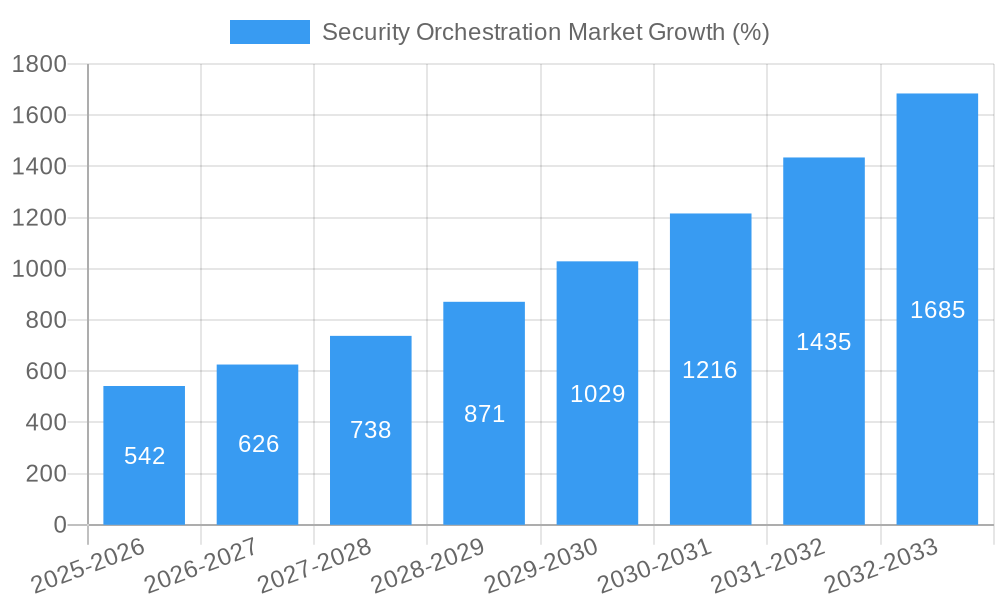
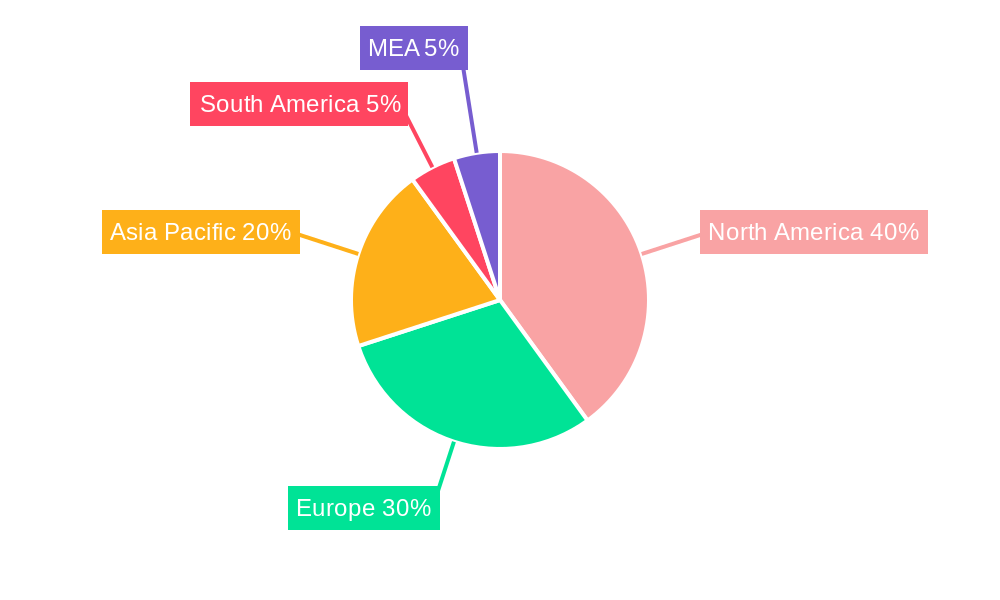
The Security Orchestration, Automation, and Response (SOAR) market is experiencing robust growth, projected to reach \$3.54 billion in 2025 and expand at a Compound Annual Growth Rate (CAGR) of 15.72% from 2025 to 2033. This expansion is driven by the escalating complexity and volume of cybersecurity threats facing organizations across all sectors. The increasing adoption of cloud computing and the expanding attack surface necessitate automated security responses and streamlined incident management. Furthermore, a growing shortage of skilled cybersecurity professionals fuels the demand for SOAR solutions that can automate tasks, improve efficiency, and reduce the reliance on manual intervention. Key segments driving market growth include software and services within the BFSI (Banking, Financial Services, and Insurance), IT and Telecommunications, Government and Defence, and E-commerce sectors. The competitive landscape is characterized by a mix of established players like IBM, Accenture, and Palo Alto Networks, as well as innovative startups like Siemplify and Swimlane, all vying for market share with a diverse range of offerings tailored to specific customer needs. Geographic growth is expected to be widespread, with North America and Europe maintaining significant market share, while the Asia-Pacific region shows strong potential for future expansion.
The significant growth in the SOAR market is intrinsically linked to the increasing sophistication of cyberattacks. Organizations are under immense pressure to improve their security posture, detect threats faster, and respond effectively. SOAR platforms offer a tangible solution by centralizing security operations, automating repetitive tasks such as threat hunting and vulnerability management, and improving incident response times. This leads to reduced costs associated with breaches, improved compliance with industry regulations, and a strengthened overall security posture. The continued evolution of threat landscapes, coupled with the ongoing digital transformation across industries, will continue to drive the demand for advanced SOAR capabilities, contributing to the sustained market growth throughout the forecast period. The market's success is further cemented by its ability to address critical skill shortages within cybersecurity teams, thus enhancing operational efficiency.
Security Orchestration Market: A Comprehensive Report (2019-2033)
This in-depth report provides a comprehensive analysis of the Security Orchestration market, encompassing market dynamics, growth trends, regional analysis, product landscape, key players, and future outlook. The study period covers 2019-2033, with 2025 as the base and estimated year. The report is designed for industry professionals, investors, and strategic decision-makers seeking a detailed understanding of this rapidly evolving market. The market size is projected to reach xx Million by 2033.
Security Orchestration Market Dynamics & Structure
The Security Orchestration market is characterized by a moderately concentrated landscape with several major players vying for market share. Technological innovation, particularly in AI and automation, is a key driver, pushing the market towards more sophisticated and efficient solutions. Stringent regulatory frameworks, like GDPR and CCPA, further fuel demand, while increasing cyber threats act as a powerful catalyst for adoption. The market witnesses continuous M&A activity, with larger players consolidating their position through acquisitions of smaller specialized firms. Competitive substitutes include traditional SIEM solutions, though SOAR’s automation capabilities offer a significant advantage. End-user demographics are shifting towards cloud-based solutions, reflecting a growing preference for scalability and accessibility.
- Market Concentration: Moderately concentrated, with top 5 players holding approximately xx% market share in 2024.
- Technological Innovation: AI, Machine Learning (ML), and automation are major drivers, improving threat detection and response efficiency.
- Regulatory Frameworks: GDPR, CCPA, and other data privacy regulations are increasing demand for robust security solutions.
- M&A Activity: Significant M&A activity observed in the past 5 years, with an estimated xx deals completed.
- Innovation Barriers: High initial investment costs and a shortage of skilled professionals can hinder adoption.
Security Orchestration Market Growth Trends & Insights
The Security Orchestration market has experienced robust growth over the historical period (2019-2024), driven by rising cyber threats and the increasing adoption of cloud technologies. The market size witnessed a CAGR of xx% during this period and is projected to maintain a healthy CAGR of xx% during the forecast period (2025-2033), reaching xx Million by 2033. This growth is fueled by a rising awareness of security vulnerabilities among organizations across various sectors and the increasing need to automate security operations to improve response times and reduce costs. The shift towards cloud-based solutions is a prominent trend, while technological disruptions, including advancements in AI and ML, are continuously enhancing the capabilities of SOAR platforms. Consumer behavior shifts indicate a growing preference for integrated solutions that streamline security operations and provide comprehensive threat intelligence.
Dominant Regions, Countries, or Segments in Security Orchestration Market
North America currently holds the largest market share in the Security Orchestration market, driven by high technological adoption rates, a strong emphasis on cybersecurity, and the presence of major technology companies. However, the Asia-Pacific region is expected to witness the fastest growth rate in the coming years, fueled by increasing digitalization and government initiatives to strengthen cybersecurity infrastructure. Within the market segments, the Software segment currently holds the largest share, while the BFSI and IT & Telecommunication sectors are the most significant end-user industries.
- North America: High adoption rates, mature cybersecurity infrastructure, and presence of major technology companies.
- Asia-Pacific: Rapid growth driven by increasing digitalization and government initiatives.
- Software Segment: Dominates the market due to its scalability, flexibility, and cost-effectiveness.
- BFSI & IT & Telecommunication: Highest demand due to stringent regulatory requirements and critical data assets.
- Government and Defence: Significant growth potential due to increased cybersecurity spending.
Security Orchestration Market Product Landscape
Security Orchestration solutions are evolving rapidly, incorporating advanced technologies like AI, ML, and automation to enhance threat detection, incident response, and overall security posture. Products offer features like automated threat hunting, vulnerability management, incident response playbooks, and integrated reporting. Unique selling propositions include improved efficiency, reduced response times, and comprehensive security visibility. Technological advancements continuously improve the accuracy and speed of threat detection and response.
Key Drivers, Barriers & Challenges in Security Orchestration Market
Key Drivers:
- The rising sophistication and frequency of cyberattacks.
- The increasing adoption of cloud computing and DevOps methodologies.
- The need for automated and efficient security operations.
Challenges & Restraints:
- High implementation costs and the need for skilled personnel.
- Integration complexities with existing security tools.
- Vendor lock-in and lack of standardization. This leads to xx Million in lost revenue annually (estimated).
Emerging Opportunities in Security Orchestration Market
- Expanding into untapped markets, such as small and medium-sized enterprises (SMEs).
- Developing specialized solutions for specific industry verticals, like healthcare and energy.
- Integrating SOAR platforms with emerging technologies such as blockchain and IoT security.
Growth Accelerators in the Security Orchestration Market Industry
Strategic partnerships between SOAR vendors and other security solution providers are creating more comprehensive security ecosystems. Technological breakthroughs in areas such as AI and ML are continuously enhancing the capabilities of SOAR platforms, enabling faster and more accurate threat detection and response. Market expansion strategies, including global reach and new product launches, are accelerating market growth.
Key Players Shaping the Security Orchestration Market Market
- Siemplify Ltd
- Accenture PLC
- FireEye Inc
- IBM Corporation
- Forescout Technologies Inc
- DFLabs SpA
- Swimlane LLC
- Amazon Web Services Inc
- Tufin Software Technologies Ltd
- DXC Technology Company
- Cisco System Inc
- RSA Security LLC
- Palo Alto Networks Inc
- Cyberbit Ltd
Notable Milestones in Security Orchestration Market Sector
- April 2023: D3 Security launched Smart SOAR, enhancing threat response for MSSPs and MDR providers.
- April 2023: Cycode introduced its ASOC solution, improving application security orchestration and correlation within development pipelines.
In-Depth Security Orchestration Market Market Outlook
The Security Orchestration market is poised for continued robust growth, driven by the ever-increasing sophistication of cyber threats and the growing need for automated and efficient security operations. Strategic partnerships, technological advancements, and expanding market penetration across various industries will continue to fuel market expansion. The market’s future holds significant potential for innovation and growth, creating attractive opportunities for both established players and new entrants.
Security Orchestration Market Segmentation
-
1. Type
- 1.1. Software
- 1.2. Services
-
2. End-user Industry
- 2.1. BFSI
- 2.2. IT and Telecommunication
- 2.3. Government and Defence
- 2.4. E-commerce
- 2.5. Other End-user Industries
Security Orchestration Market Segmentation By Geography
-
1. North America
- 1.1. United States
- 1.2. Canada
-
2. Europe
- 2.1. United Kingdom
- 2.2. France
- 2.3. Germany
- 2.4. Rest of Europe
-
3. Asia Pacific
- 3.1. China
- 3.2. Japan
- 3.3. Australia
- 3.4. Rest of Asia Pacific
-
4. Rest of the World
- 4.1. Latin America
- 4.2. Middle East
Security Orchestration Market REPORT HIGHLIGHTS
| Aspects | Details |
|---|---|
| Study Period | 2019-2033 |
| Base Year | 2024 |
| Estimated Year | 2025 |
| Forecast Period | 2025-2033 |
| Historical Period | 2019-2024 |
| Growth Rate | CAGR of 15.72% from 2019-2033 |
| Segmentation |
|
Table of Contents
- 1. Introduction
- 1.1. Research Scope
- 1.2. Market Segmentation
- 1.3. Research Methodology
- 1.4. Definitions and Assumptions
- 2. Executive Summary
- 2.1. Introduction
- 3. Market Dynamics
- 3.1. Introduction
- 3.2. Market Drivers
- 3.2.1. Rising Trend of Automated Security Operation for Seamless Workflow; Need of Disparate Cybersecurity Technologies to Handle Network Complexity
- 3.3. Market Restrains
- 3.3.1. Lack of Awareness among Professionals
- 3.4. Market Trends
- 3.4.1. IT and Telecommunication Sector is Projected to Record Significant Growth
- 4. Market Factor Analysis
- 4.1. Porters Five Forces
- 4.2. Supply/Value Chain
- 4.3. PESTEL analysis
- 4.4. Market Entropy
- 4.5. Patent/Trademark Analysis
- 5. Global Security Orchestration Market Analysis, Insights and Forecast, 2019-2031
- 5.1. Market Analysis, Insights and Forecast - by Type
- 5.1.1. Software
- 5.1.2. Services
- 5.2. Market Analysis, Insights and Forecast - by End-user Industry
- 5.2.1. BFSI
- 5.2.2. IT and Telecommunication
- 5.2.3. Government and Defence
- 5.2.4. E-commerce
- 5.2.5. Other End-user Industries
- 5.3. Market Analysis, Insights and Forecast - by Region
- 5.3.1. North America
- 5.3.2. Europe
- 5.3.3. Asia Pacific
- 5.3.4. Rest of the World
- 5.1. Market Analysis, Insights and Forecast - by Type
- 6. North America Security Orchestration Market Analysis, Insights and Forecast, 2019-2031
- 6.1. Market Analysis, Insights and Forecast - by Type
- 6.1.1. Software
- 6.1.2. Services
- 6.2. Market Analysis, Insights and Forecast - by End-user Industry
- 6.2.1. BFSI
- 6.2.2. IT and Telecommunication
- 6.2.3. Government and Defence
- 6.2.4. E-commerce
- 6.2.5. Other End-user Industries
- 6.1. Market Analysis, Insights and Forecast - by Type
- 7. Europe Security Orchestration Market Analysis, Insights and Forecast, 2019-2031
- 7.1. Market Analysis, Insights and Forecast - by Type
- 7.1.1. Software
- 7.1.2. Services
- 7.2. Market Analysis, Insights and Forecast - by End-user Industry
- 7.2.1. BFSI
- 7.2.2. IT and Telecommunication
- 7.2.3. Government and Defence
- 7.2.4. E-commerce
- 7.2.5. Other End-user Industries
- 7.1. Market Analysis, Insights and Forecast - by Type
- 8. Asia Pacific Security Orchestration Market Analysis, Insights and Forecast, 2019-2031
- 8.1. Market Analysis, Insights and Forecast - by Type
- 8.1.1. Software
- 8.1.2. Services
- 8.2. Market Analysis, Insights and Forecast - by End-user Industry
- 8.2.1. BFSI
- 8.2.2. IT and Telecommunication
- 8.2.3. Government and Defence
- 8.2.4. E-commerce
- 8.2.5. Other End-user Industries
- 8.1. Market Analysis, Insights and Forecast - by Type
- 9. Rest of the World Security Orchestration Market Analysis, Insights and Forecast, 2019-2031
- 9.1. Market Analysis, Insights and Forecast - by Type
- 9.1.1. Software
- 9.1.2. Services
- 9.2. Market Analysis, Insights and Forecast - by End-user Industry
- 9.2.1. BFSI
- 9.2.2. IT and Telecommunication
- 9.2.3. Government and Defence
- 9.2.4. E-commerce
- 9.2.5. Other End-user Industries
- 9.1. Market Analysis, Insights and Forecast - by Type
- 10. North America Security Orchestration Market Analysis, Insights and Forecast, 2019-2031
- 10.1. Market Analysis, Insights and Forecast - By Country/Sub-region
- 10.1.1 United States
- 10.1.2 Canada
- 10.1.3 Mexico
- 11. Europe Security Orchestration Market Analysis, Insights and Forecast, 2019-2031
- 11.1. Market Analysis, Insights and Forecast - By Country/Sub-region
- 11.1.1 Germany
- 11.1.2 United Kingdom
- 11.1.3 France
- 11.1.4 Spain
- 11.1.5 Italy
- 11.1.6 Spain
- 11.1.7 Belgium
- 11.1.8 Netherland
- 11.1.9 Nordics
- 11.1.10 Rest of Europe
- 12. Asia Pacific Security Orchestration Market Analysis, Insights and Forecast, 2019-2031
- 12.1. Market Analysis, Insights and Forecast - By Country/Sub-region
- 12.1.1 China
- 12.1.2 Japan
- 12.1.3 India
- 12.1.4 South Korea
- 12.1.5 Southeast Asia
- 12.1.6 Australia
- 12.1.7 Indonesia
- 12.1.8 Phillipes
- 12.1.9 Singapore
- 12.1.10 Thailandc
- 12.1.11 Rest of Asia Pacific
- 13. South America Security Orchestration Market Analysis, Insights and Forecast, 2019-2031
- 13.1. Market Analysis, Insights and Forecast - By Country/Sub-region
- 13.1.1 Brazil
- 13.1.2 Argentina
- 13.1.3 Peru
- 13.1.4 Chile
- 13.1.5 Colombia
- 13.1.6 Ecuador
- 13.1.7 Venezuela
- 13.1.8 Rest of South America
- 14. North America Security Orchestration Market Analysis, Insights and Forecast, 2019-2031
- 14.1. Market Analysis, Insights and Forecast - By Country/Sub-region
- 14.1.1 United States
- 14.1.2 Canada
- 14.1.3 Mexico
- 15. MEA Security Orchestration Market Analysis, Insights and Forecast, 2019-2031
- 15.1. Market Analysis, Insights and Forecast - By Country/Sub-region
- 15.1.1 United Arab Emirates
- 15.1.2 Saudi Arabia
- 15.1.3 South Africa
- 15.1.4 Rest of Middle East and Africa
- 16. Competitive Analysis
- 16.1. Global Market Share Analysis 2024
- 16.2. Company Profiles
- 16.2.1 Siemplify Ltd
- 16.2.1.1. Overview
- 16.2.1.2. Products
- 16.2.1.3. SWOT Analysis
- 16.2.1.4. Recent Developments
- 16.2.1.5. Financials (Based on Availability)
- 16.2.2 Accenture PLC
- 16.2.2.1. Overview
- 16.2.2.2. Products
- 16.2.2.3. SWOT Analysis
- 16.2.2.4. Recent Developments
- 16.2.2.5. Financials (Based on Availability)
- 16.2.3 FireEye Inc
- 16.2.3.1. Overview
- 16.2.3.2. Products
- 16.2.3.3. SWOT Analysis
- 16.2.3.4. Recent Developments
- 16.2.3.5. Financials (Based on Availability)
- 16.2.4 IBM Corporation
- 16.2.4.1. Overview
- 16.2.4.2. Products
- 16.2.4.3. SWOT Analysis
- 16.2.4.4. Recent Developments
- 16.2.4.5. Financials (Based on Availability)
- 16.2.5 Forescout Technologies Inc *List Not Exhaustive
- 16.2.5.1. Overview
- 16.2.5.2. Products
- 16.2.5.3. SWOT Analysis
- 16.2.5.4. Recent Developments
- 16.2.5.5. Financials (Based on Availability)
- 16.2.6 DFLabs SpA
- 16.2.6.1. Overview
- 16.2.6.2. Products
- 16.2.6.3. SWOT Analysis
- 16.2.6.4. Recent Developments
- 16.2.6.5. Financials (Based on Availability)
- 16.2.7 Swimlane LLC
- 16.2.7.1. Overview
- 16.2.7.2. Products
- 16.2.7.3. SWOT Analysis
- 16.2.7.4. Recent Developments
- 16.2.7.5. Financials (Based on Availability)
- 16.2.8 Amazon Web Services Inc
- 16.2.8.1. Overview
- 16.2.8.2. Products
- 16.2.8.3. SWOT Analysis
- 16.2.8.4. Recent Developments
- 16.2.8.5. Financials (Based on Availability)
- 16.2.9 Tufin Software Technologies Ltd
- 16.2.9.1. Overview
- 16.2.9.2. Products
- 16.2.9.3. SWOT Analysis
- 16.2.9.4. Recent Developments
- 16.2.9.5. Financials (Based on Availability)
- 16.2.10 DXC Technology Company
- 16.2.10.1. Overview
- 16.2.10.2. Products
- 16.2.10.3. SWOT Analysis
- 16.2.10.4. Recent Developments
- 16.2.10.5. Financials (Based on Availability)
- 16.2.11 Cisco System Inc
- 16.2.11.1. Overview
- 16.2.11.2. Products
- 16.2.11.3. SWOT Analysis
- 16.2.11.4. Recent Developments
- 16.2.11.5. Financials (Based on Availability)
- 16.2.12 RSA Security LLC
- 16.2.12.1. Overview
- 16.2.12.2. Products
- 16.2.12.3. SWOT Analysis
- 16.2.12.4. Recent Developments
- 16.2.12.5. Financials (Based on Availability)
- 16.2.13 Palo Alto Networks Inc
- 16.2.13.1. Overview
- 16.2.13.2. Products
- 16.2.13.3. SWOT Analysis
- 16.2.13.4. Recent Developments
- 16.2.13.5. Financials (Based on Availability)
- 16.2.14 Cyberbit Ltd
- 16.2.14.1. Overview
- 16.2.14.2. Products
- 16.2.14.3. SWOT Analysis
- 16.2.14.4. Recent Developments
- 16.2.14.5. Financials (Based on Availability)
- 16.2.1 Siemplify Ltd
List of Figures
- Figure 1: Global Security Orchestration Market Revenue Breakdown (Million, %) by Region 2024 & 2032
- Figure 2: North America Security Orchestration Market Revenue (Million), by Country 2024 & 2032
- Figure 3: North America Security Orchestration Market Revenue Share (%), by Country 2024 & 2032
- Figure 4: Europe Security Orchestration Market Revenue (Million), by Country 2024 & 2032
- Figure 5: Europe Security Orchestration Market Revenue Share (%), by Country 2024 & 2032
- Figure 6: Asia Pacific Security Orchestration Market Revenue (Million), by Country 2024 & 2032
- Figure 7: Asia Pacific Security Orchestration Market Revenue Share (%), by Country 2024 & 2032
- Figure 8: South America Security Orchestration Market Revenue (Million), by Country 2024 & 2032
- Figure 9: South America Security Orchestration Market Revenue Share (%), by Country 2024 & 2032
- Figure 10: North America Security Orchestration Market Revenue (Million), by Country 2024 & 2032
- Figure 11: North America Security Orchestration Market Revenue Share (%), by Country 2024 & 2032
- Figure 12: MEA Security Orchestration Market Revenue (Million), by Country 2024 & 2032
- Figure 13: MEA Security Orchestration Market Revenue Share (%), by Country 2024 & 2032
- Figure 14: North America Security Orchestration Market Revenue (Million), by Type 2024 & 2032
- Figure 15: North America Security Orchestration Market Revenue Share (%), by Type 2024 & 2032
- Figure 16: North America Security Orchestration Market Revenue (Million), by End-user Industry 2024 & 2032
- Figure 17: North America Security Orchestration Market Revenue Share (%), by End-user Industry 2024 & 2032
- Figure 18: North America Security Orchestration Market Revenue (Million), by Country 2024 & 2032
- Figure 19: North America Security Orchestration Market Revenue Share (%), by Country 2024 & 2032
- Figure 20: Europe Security Orchestration Market Revenue (Million), by Type 2024 & 2032
- Figure 21: Europe Security Orchestration Market Revenue Share (%), by Type 2024 & 2032
- Figure 22: Europe Security Orchestration Market Revenue (Million), by End-user Industry 2024 & 2032
- Figure 23: Europe Security Orchestration Market Revenue Share (%), by End-user Industry 2024 & 2032
- Figure 24: Europe Security Orchestration Market Revenue (Million), by Country 2024 & 2032
- Figure 25: Europe Security Orchestration Market Revenue Share (%), by Country 2024 & 2032
- Figure 26: Asia Pacific Security Orchestration Market Revenue (Million), by Type 2024 & 2032
- Figure 27: Asia Pacific Security Orchestration Market Revenue Share (%), by Type 2024 & 2032
- Figure 28: Asia Pacific Security Orchestration Market Revenue (Million), by End-user Industry 2024 & 2032
- Figure 29: Asia Pacific Security Orchestration Market Revenue Share (%), by End-user Industry 2024 & 2032
- Figure 30: Asia Pacific Security Orchestration Market Revenue (Million), by Country 2024 & 2032
- Figure 31: Asia Pacific Security Orchestration Market Revenue Share (%), by Country 2024 & 2032
- Figure 32: Rest of the World Security Orchestration Market Revenue (Million), by Type 2024 & 2032
- Figure 33: Rest of the World Security Orchestration Market Revenue Share (%), by Type 2024 & 2032
- Figure 34: Rest of the World Security Orchestration Market Revenue (Million), by End-user Industry 2024 & 2032
- Figure 35: Rest of the World Security Orchestration Market Revenue Share (%), by End-user Industry 2024 & 2032
- Figure 36: Rest of the World Security Orchestration Market Revenue (Million), by Country 2024 & 2032
- Figure 37: Rest of the World Security Orchestration Market Revenue Share (%), by Country 2024 & 2032
List of Tables
- Table 1: Global Security Orchestration Market Revenue Million Forecast, by Region 2019 & 2032
- Table 2: Global Security Orchestration Market Revenue Million Forecast, by Type 2019 & 2032
- Table 3: Global Security Orchestration Market Revenue Million Forecast, by End-user Industry 2019 & 2032
- Table 4: Global Security Orchestration Market Revenue Million Forecast, by Region 2019 & 2032
- Table 5: Global Security Orchestration Market Revenue Million Forecast, by Country 2019 & 2032
- Table 6: United States Security Orchestration Market Revenue (Million) Forecast, by Application 2019 & 2032
- Table 7: Canada Security Orchestration Market Revenue (Million) Forecast, by Application 2019 & 2032
- Table 8: Mexico Security Orchestration Market Revenue (Million) Forecast, by Application 2019 & 2032
- Table 9: Global Security Orchestration Market Revenue Million Forecast, by Country 2019 & 2032
- Table 10: Germany Security Orchestration Market Revenue (Million) Forecast, by Application 2019 & 2032
- Table 11: United Kingdom Security Orchestration Market Revenue (Million) Forecast, by Application 2019 & 2032
- Table 12: France Security Orchestration Market Revenue (Million) Forecast, by Application 2019 & 2032
- Table 13: Spain Security Orchestration Market Revenue (Million) Forecast, by Application 2019 & 2032
- Table 14: Italy Security Orchestration Market Revenue (Million) Forecast, by Application 2019 & 2032
- Table 15: Spain Security Orchestration Market Revenue (Million) Forecast, by Application 2019 & 2032
- Table 16: Belgium Security Orchestration Market Revenue (Million) Forecast, by Application 2019 & 2032
- Table 17: Netherland Security Orchestration Market Revenue (Million) Forecast, by Application 2019 & 2032
- Table 18: Nordics Security Orchestration Market Revenue (Million) Forecast, by Application 2019 & 2032
- Table 19: Rest of Europe Security Orchestration Market Revenue (Million) Forecast, by Application 2019 & 2032
- Table 20: Global Security Orchestration Market Revenue Million Forecast, by Country 2019 & 2032
- Table 21: China Security Orchestration Market Revenue (Million) Forecast, by Application 2019 & 2032
- Table 22: Japan Security Orchestration Market Revenue (Million) Forecast, by Application 2019 & 2032
- Table 23: India Security Orchestration Market Revenue (Million) Forecast, by Application 2019 & 2032
- Table 24: South Korea Security Orchestration Market Revenue (Million) Forecast, by Application 2019 & 2032
- Table 25: Southeast Asia Security Orchestration Market Revenue (Million) Forecast, by Application 2019 & 2032
- Table 26: Australia Security Orchestration Market Revenue (Million) Forecast, by Application 2019 & 2032
- Table 27: Indonesia Security Orchestration Market Revenue (Million) Forecast, by Application 2019 & 2032
- Table 28: Phillipes Security Orchestration Market Revenue (Million) Forecast, by Application 2019 & 2032
- Table 29: Singapore Security Orchestration Market Revenue (Million) Forecast, by Application 2019 & 2032
- Table 30: Thailandc Security Orchestration Market Revenue (Million) Forecast, by Application 2019 & 2032
- Table 31: Rest of Asia Pacific Security Orchestration Market Revenue (Million) Forecast, by Application 2019 & 2032
- Table 32: Global Security Orchestration Market Revenue Million Forecast, by Country 2019 & 2032
- Table 33: Brazil Security Orchestration Market Revenue (Million) Forecast, by Application 2019 & 2032
- Table 34: Argentina Security Orchestration Market Revenue (Million) Forecast, by Application 2019 & 2032
- Table 35: Peru Security Orchestration Market Revenue (Million) Forecast, by Application 2019 & 2032
- Table 36: Chile Security Orchestration Market Revenue (Million) Forecast, by Application 2019 & 2032
- Table 37: Colombia Security Orchestration Market Revenue (Million) Forecast, by Application 2019 & 2032
- Table 38: Ecuador Security Orchestration Market Revenue (Million) Forecast, by Application 2019 & 2032
- Table 39: Venezuela Security Orchestration Market Revenue (Million) Forecast, by Application 2019 & 2032
- Table 40: Rest of South America Security Orchestration Market Revenue (Million) Forecast, by Application 2019 & 2032
- Table 41: Global Security Orchestration Market Revenue Million Forecast, by Country 2019 & 2032
- Table 42: United States Security Orchestration Market Revenue (Million) Forecast, by Application 2019 & 2032
- Table 43: Canada Security Orchestration Market Revenue (Million) Forecast, by Application 2019 & 2032
- Table 44: Mexico Security Orchestration Market Revenue (Million) Forecast, by Application 2019 & 2032
- Table 45: Global Security Orchestration Market Revenue Million Forecast, by Country 2019 & 2032
- Table 46: United Arab Emirates Security Orchestration Market Revenue (Million) Forecast, by Application 2019 & 2032
- Table 47: Saudi Arabia Security Orchestration Market Revenue (Million) Forecast, by Application 2019 & 2032
- Table 48: South Africa Security Orchestration Market Revenue (Million) Forecast, by Application 2019 & 2032
- Table 49: Rest of Middle East and Africa Security Orchestration Market Revenue (Million) Forecast, by Application 2019 & 2032
- Table 50: Global Security Orchestration Market Revenue Million Forecast, by Type 2019 & 2032
- Table 51: Global Security Orchestration Market Revenue Million Forecast, by End-user Industry 2019 & 2032
- Table 52: Global Security Orchestration Market Revenue Million Forecast, by Country 2019 & 2032
- Table 53: United States Security Orchestration Market Revenue (Million) Forecast, by Application 2019 & 2032
- Table 54: Canada Security Orchestration Market Revenue (Million) Forecast, by Application 2019 & 2032
- Table 55: Global Security Orchestration Market Revenue Million Forecast, by Type 2019 & 2032
- Table 56: Global Security Orchestration Market Revenue Million Forecast, by End-user Industry 2019 & 2032
- Table 57: Global Security Orchestration Market Revenue Million Forecast, by Country 2019 & 2032
- Table 58: United Kingdom Security Orchestration Market Revenue (Million) Forecast, by Application 2019 & 2032
- Table 59: France Security Orchestration Market Revenue (Million) Forecast, by Application 2019 & 2032
- Table 60: Germany Security Orchestration Market Revenue (Million) Forecast, by Application 2019 & 2032
- Table 61: Rest of Europe Security Orchestration Market Revenue (Million) Forecast, by Application 2019 & 2032
- Table 62: Global Security Orchestration Market Revenue Million Forecast, by Type 2019 & 2032
- Table 63: Global Security Orchestration Market Revenue Million Forecast, by End-user Industry 2019 & 2032
- Table 64: Global Security Orchestration Market Revenue Million Forecast, by Country 2019 & 2032
- Table 65: China Security Orchestration Market Revenue (Million) Forecast, by Application 2019 & 2032
- Table 66: Japan Security Orchestration Market Revenue (Million) Forecast, by Application 2019 & 2032
- Table 67: Australia Security Orchestration Market Revenue (Million) Forecast, by Application 2019 & 2032
- Table 68: Rest of Asia Pacific Security Orchestration Market Revenue (Million) Forecast, by Application 2019 & 2032
- Table 69: Global Security Orchestration Market Revenue Million Forecast, by Type 2019 & 2032
- Table 70: Global Security Orchestration Market Revenue Million Forecast, by End-user Industry 2019 & 2032
- Table 71: Global Security Orchestration Market Revenue Million Forecast, by Country 2019 & 2032
- Table 72: Latin America Security Orchestration Market Revenue (Million) Forecast, by Application 2019 & 2032
- Table 73: Middle East Security Orchestration Market Revenue (Million) Forecast, by Application 2019 & 2032
Frequently Asked Questions
1. What is the projected Compound Annual Growth Rate (CAGR) of the Security Orchestration Market?
The projected CAGR is approximately 15.72%.
2. Which companies are prominent players in the Security Orchestration Market?
Key companies in the market include Siemplify Ltd, Accenture PLC, FireEye Inc, IBM Corporation, Forescout Technologies Inc *List Not Exhaustive, DFLabs SpA, Swimlane LLC, Amazon Web Services Inc, Tufin Software Technologies Ltd, DXC Technology Company, Cisco System Inc, RSA Security LLC, Palo Alto Networks Inc, Cyberbit Ltd.
3. What are the main segments of the Security Orchestration Market?
The market segments include Type, End-user Industry.
4. Can you provide details about the market size?
The market size is estimated to be USD 3.54 Million as of 2022.
5. What are some drivers contributing to market growth?
Rising Trend of Automated Security Operation for Seamless Workflow; Need of Disparate Cybersecurity Technologies to Handle Network Complexity.
6. What are the notable trends driving market growth?
IT and Telecommunication Sector is Projected to Record Significant Growth.
7. Are there any restraints impacting market growth?
Lack of Awareness among Professionals.
8. Can you provide examples of recent developments in the market?
April 2023-A new version of D3 Security's security orchestration, automation, and response solution, Smart SOAR, has been launched. The solution is intended to help MSSPs and managed detection and response (MDR) providers to respond to threats and remediate security instances automatically.
9. What pricing options are available for accessing the report?
Pricing options include single-user, multi-user, and enterprise licenses priced at USD 4750, USD 5250, and USD 8750 respectively.
10. Is the market size provided in terms of value or volume?
The market size is provided in terms of value, measured in Million.
11. Are there any specific market keywords associated with the report?
Yes, the market keyword associated with the report is "Security Orchestration Market," which aids in identifying and referencing the specific market segment covered.
12. How do I determine which pricing option suits my needs best?
The pricing options vary based on user requirements and access needs. Individual users may opt for single-user licenses, while businesses requiring broader access may choose multi-user or enterprise licenses for cost-effective access to the report.
13. Are there any additional resources or data provided in the Security Orchestration Market report?
While the report offers comprehensive insights, it's advisable to review the specific contents or supplementary materials provided to ascertain if additional resources or data are available.
14. How can I stay updated on further developments or reports in the Security Orchestration Market?
To stay informed about further developments, trends, and reports in the Security Orchestration Market, consider subscribing to industry newsletters, following relevant companies and organizations, or regularly checking reputable industry news sources and publications.
Methodology
Step 1 - Identification of Relevant Samples Size from Population Database


Step 2 - Approaches for Defining Global Market Size (Value, Volume* & Price*)

Note*: In applicable scenarios
Step 3 - Data Sources
Primary Research
- Web Analytics
- Survey Reports
- Research Institute
- Latest Research Reports
- Opinion Leaders
Secondary Research
- Annual Reports
- White Paper
- Latest Press Release
- Industry Association
- Paid Database
- Investor Presentations

Step 4 - Data Triangulation
Involves using different sources of information in order to increase the validity of a study
These sources are likely to be stakeholders in a program - participants, other researchers, program staff, other community members, and so on.
Then we put all data in single framework & apply various statistical tools to find out the dynamic on the market.
During the analysis stage, feedback from the stakeholder groups would be compared to determine areas of agreement as well as areas of divergence


