

Key Insights
The Asia-Pacific (APAC) Digital Out-of-Home (DOOH) advertising market is experiencing robust growth, driven by increasing urbanization, rising smartphone penetration, and a shift towards data-driven advertising strategies. The region's diverse economies and burgeoning digital landscape present significant opportunities for DOOH deployment. Key growth drivers include the expansion of smart city initiatives, which are integrating DOOH into urban infrastructure, and the adoption of programmatic advertising, allowing for more targeted and efficient campaigns. Furthermore, the increasing adoption of advanced technologies like AI and augmented reality (AR) in DOOH displays is enhancing engagement and attracting more advertisers. While challenges remain, such as the need for standardized measurement and the complexities of navigating diverse regulatory landscapes across different APAC countries, the overall trajectory points towards substantial expansion.
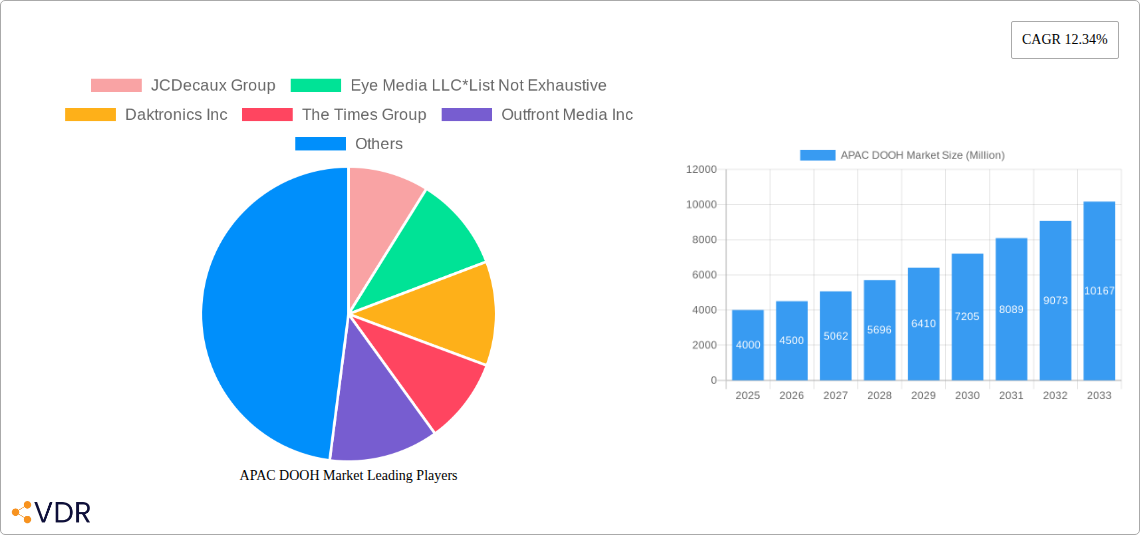
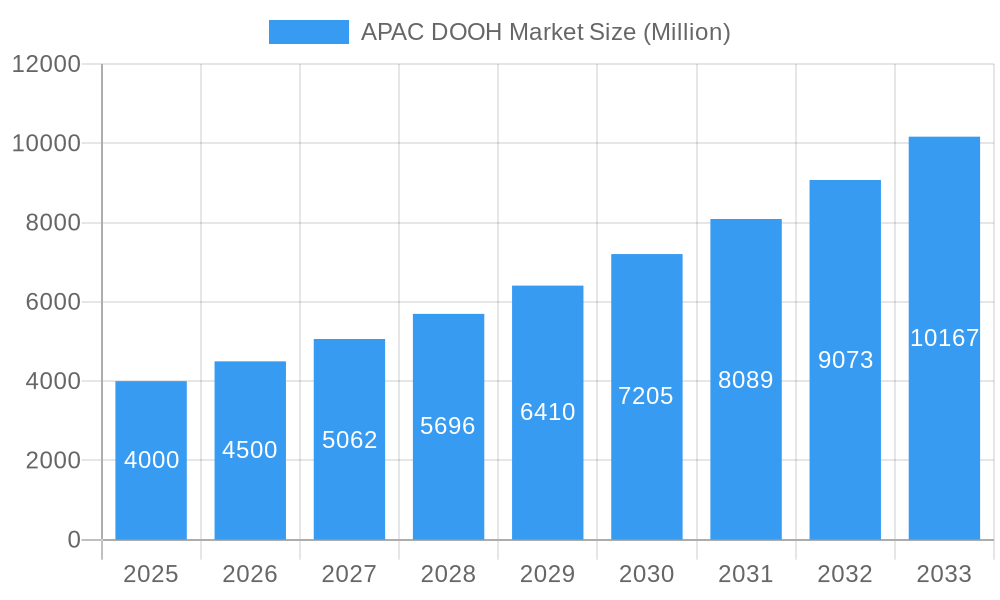
APAC DOOH Market Market Size (In Billion)
Specifically within APAC, China, India, Japan, and South Korea are expected to be the major contributors to market growth. China's sophisticated advertising market and high density of urban populations make it a key player, while India’s burgeoning middle class and increasing digital adoption promise significant future expansion. Japan's technologically advanced market and high advertising spend present further opportunities. The increasing adoption of DOOH in retail environments, particularly in shopping malls and high-street locations, further fuels market growth. Transit advertising, leveraging public transport networks in major cities, is another significant segment. The continued development of sophisticated ad-serving technologies and analytics platforms will further enhance the effectiveness and attractiveness of DOOH advertising in the years to come. The market's future will be shaped by the extent to which these technological advancements are adopted and integrated into existing infrastructure, leading to an increasingly competitive and dynamic landscape.
APAC DOOH Market Company Market Share
APAC DOOH Market: A Comprehensive Report (2019-2033)
This in-depth report provides a comprehensive analysis of the Asia-Pacific Digital Out-of-Home (DOOH) advertising market, offering invaluable insights for industry professionals, investors, and strategic planners. The report covers the period from 2019 to 2033, with a focus on the forecast period from 2025 to 2033, using 2025 as the base year. The report meticulously examines market dynamics, growth trends, dominant segments, key players, and emerging opportunities within this rapidly evolving sector. Expect detailed analysis of key segments including By Location (Indoor, Outdoor), By Application (Billboard, Transit, Street Furniture, Other Applications), By End User (Retail, Healthcare/Pharmaceuticals, Financial Services, Automotive, Telecom/Utilities, Government Agencies, Other End Users), and by country (China, Japan, Australia, India, South Korea, Hong Kong, Thailand, Singapore, and Rest of Asia-Pacific). The report's value extends to understanding market concentration, technological advancements, and the impact of regulatory changes, providing a 360-degree view of the APAC DOOH market.
APAC DOOH Market Dynamics & Structure
The APAC DOOH market is characterized by a moderately concentrated landscape, with a few major players holding significant market share, alongside a large number of smaller, regional players. The market is experiencing rapid technological innovation, driven by the increasing adoption of programmatic advertising, data-driven solutions, and interactive displays. Regulatory frameworks vary across countries, impacting market growth and investment strategies. Competitive product substitutes, such as digital video advertising and social media, pose a constant challenge. The demographics of end-users are diverse, creating opportunities for targeted advertising campaigns. Mergers and acquisitions (M&A) activity is expected to continue, driving consolidation and innovation.
- Market Concentration: The top 5 players hold approximately xx% of the market share in 2025.
- Technological Innovation: Programmatic DOOH is experiencing significant adoption, with a CAGR of xx% during 2025-2033.
- Regulatory Frameworks: Variations in regulations across countries create complexities for market expansion.
- M&A Activity: An estimated xx M&A deals are projected in the APAC DOOH sector between 2025-2033.
- Innovation Barriers: High initial investment costs and lack of standardized measurement metrics are key challenges.
APAC DOOH Market Growth Trends & Insights
The APAC DOOH market is experiencing robust growth, driven by increasing urbanization, rising disposable incomes, and the expanding adoption of digital technologies. The market size is projected to reach xx million units by 2033, exhibiting a CAGR of xx% during the forecast period. This growth is fueled by factors such as the rising popularity of programmatic DOOH advertising, enhanced audience targeting capabilities, and the increasing demand for measurable ROI from advertising campaigns. Consumer behavior shifts, including increased screen time and a preference for engaging digital content, further contribute to the market's expansion. Technological disruptions, like the integration of AI and big data analytics, are transforming DOOH advertising, enabling better campaign optimization and audience engagement.
Dominant Regions, Countries, or Segments in APAC DOOH Market
China and Japan represent the largest markets within the APAC region, accounting for xx% and xx% of the total market size in 2025, respectively. Outdoor advertising continues to dominate the location segment, driven by high visibility and reach, though indoor DOOH is showing significant growth, especially in major metropolitan areas. Billboards remain the leading application segment, while transit advertising and street furniture are also experiencing strong growth. The retail sector is a major end-user, with significant investments in DOOH advertising for brand building and promotion, closely followed by the automotive and financial services sectors.
- Key Drivers: Strong economic growth, increased infrastructure development, and rising consumer spending in major economies.
- Dominance Factors: High population density, advanced infrastructure, and favorable regulatory environments in leading markets.
APAC DOOH Market Product Landscape
The APAC DOOH market is witnessing constant product innovation, with new displays offering improved resolution, brighter displays, and interactive features. Programmatic platforms are enhancing campaign optimization, measurement, and targeting. Smart DOOH displays are integrating with mobile devices, and data analytics, enabling real-time audience engagement and measurement. Key selling propositions include improved targeting capabilities, enhanced measurement tools, and the ability to deliver dynamic and personalized advertising messages.
Key Drivers, Barriers & Challenges in APAC DOOH Market
Key Drivers: Rising smartphone penetration, growth of programmatic advertising, and increasing investments in smart city infrastructure are major drivers. Government initiatives supporting digitalization and technological advancements also contribute significantly.
Key Challenges: High implementation costs, lack of standardized measurement metrics, and fragmented media ownership create challenges. Data privacy concerns and regulatory uncertainties also impact market growth. Supply chain disruptions pose significant risks to timely delivery and deployment of DOOH solutions.
Emerging Opportunities in APAP DOOH Market
Emerging opportunities include the expansion of DOOH advertising into smaller cities and rural areas, the growing use of DOOH in experiential marketing campaigns, and the integration of DOOH with augmented reality (AR) and virtual reality (VR) technologies. The increasing use of data analytics and AI for campaign optimization presents significant growth potential.
Growth Accelerators in the APAC DOOH Market Industry
Technological advancements, strategic partnerships between media owners and technology providers, and expanding market penetration in less developed regions are key growth accelerators. Increased adoption of programmatic advertising and enhanced data-driven solutions further propel market growth.
Key Players Shaping the APAC DOOH Market Market
- JCDecaux Group
- Eye Media LLC
- Daktronics Inc
- The Times Group
- Outfront Media Inc
- BroadSign International LLC
- oOh!media Limited
- Talon Outdoor Ltd
- Clear Channel Outdoor Holdings Inc
Notable Milestones in APAC DOOH Market Sector
- April 2022: Group M partners with Moving Walls to automate and improve accountability in Malaysian DOOH advertising.
- January 2022: Hivestack launches operations in Malaysia, expanding programmatic DOOH access for brands and agencies.
In-Depth APAC DOOH Market Outlook
The APAC DOOH market holds immense future potential, driven by continued technological advancements, increasing digital adoption, and favorable economic growth in several key markets. Strategic partnerships and innovations in programmatic advertising will unlock further growth opportunities. The market's long-term prospects remain positive, with significant expansion expected across various segments and countries.
APAC DOOH Market Segmentation
-
1. Location
- 1.1. Indoor
- 1.2. Outdoor
-
2. Application
- 2.1. Billboard
- 2.2. Transit
- 2.3. Street Furniture
- 2.4. Other Applications
-
3. End User
- 3.1. Retail
- 3.2. Healthcare/Pharmaceuticals
- 3.3. Financial Services
- 3.4. Automotive
- 3.5. Telecom/Utilities
- 3.6. Government Agencies
- 3.7. Other End Users
APAC DOOH Market Segmentation By Geography
-
1. North America
- 1.1. United States
- 1.2. Canada
- 1.3. Mexico
-
2. South America
- 2.1. Brazil
- 2.2. Argentina
- 2.3. Rest of South America
-
3. Europe
- 3.1. United Kingdom
- 3.2. Germany
- 3.3. France
- 3.4. Italy
- 3.5. Spain
- 3.6. Russia
- 3.7. Benelux
- 3.8. Nordics
- 3.9. Rest of Europe
-
4. Middle East & Africa
- 4.1. Turkey
- 4.2. Israel
- 4.3. GCC
- 4.4. North Africa
- 4.5. South Africa
- 4.6. Rest of Middle East & Africa
-
5. Asia Pacific
- 5.1. China
- 5.2. India
- 5.3. Japan
- 5.4. South Korea
- 5.5. ASEAN
- 5.6. Oceania
- 5.7. Rest of Asia Pacific
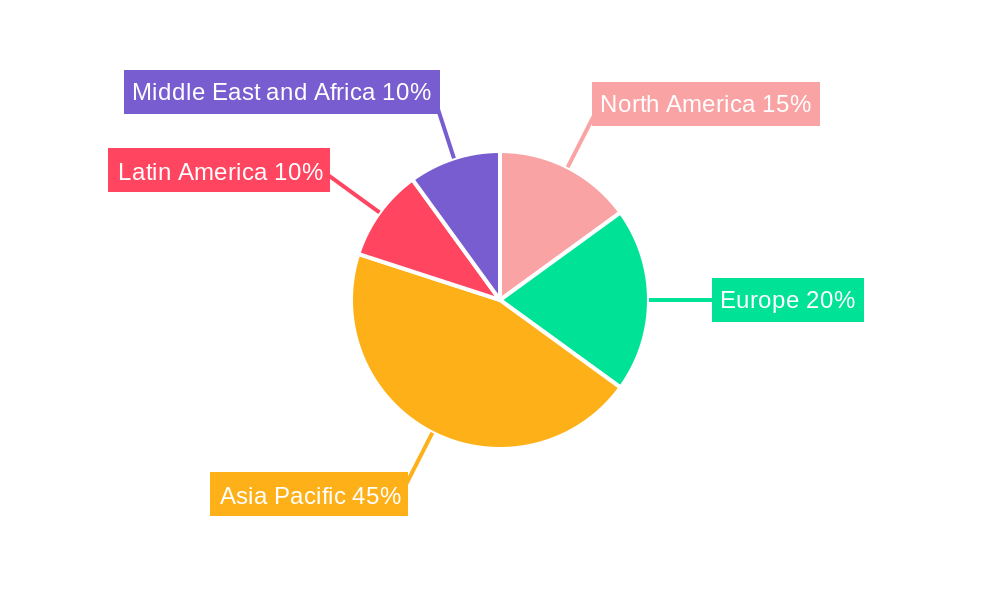
APAC DOOH Market Regional Market Share
Geographic Coverage of APAC DOOH Market
APAC DOOH Market REPORT HIGHLIGHTS
| Aspects | Details |
|---|---|
| Study Period | 2020-2034 |
| Base Year | 2025 |
| Estimated Year | 2026 |
| Forecast Period | 2026-2034 |
| Historical Period | 2020-2025 |
| Growth Rate | CAGR of 12.34% from 2020-2034 |
| Segmentation |
|
Table of Contents
- 1. Introduction
- 1.1. Research Scope
- 1.2. Market Segmentation
- 1.3. Research Objective
- 1.4. Definitions and Assumptions
- 2. Executive Summary
- 2.1. Market Snapshot
- 3. Market Dynamics
- 3.1. Market Drivers
- 3.2. Market Restrains
- 3.3. Market Trends
- 3.4. Market Opportunities
- 4. Market Factor Analysis
- 4.1. Porters Five Forces
- 4.1.1. Bargaining Power of Suppliers
- 4.1.2. Bargaining Power of Buyers
- 4.1.3. Threat of New Entrants
- 4.1.4. Threat of Substitutes
- 4.1.5. Competitive Rivalry
- 4.2. PESTEL analysis
- 4.3. BCG Analysis
- 4.3.1. Stars (High Growth, High Market Share)
- 4.3.2. Cash Cows (Low Growth, High Market Share)
- 4.3.3. Question Mark (High Growth, Low Market Share)
- 4.3.4. Dogs (Low Growth, Low Market Share)
- 4.4. Ansoff Matrix Analysis
- 4.5. Supply Chain Analysis
- 4.6. Regulatory Landscape
- 4.7. Current Market Potential and Opportunity Assessment (TAM–SAM–SOM Framework)
- 4.8. VDR Analyst Note
- 4.1. Porters Five Forces
- 5. Market Analysis, Insights and Forecast 2021-2033
- 5.1. Market Analysis, Insights and Forecast - by Location
- 5.1.1. Indoor
- 5.1.2. Outdoor
- 5.2. Market Analysis, Insights and Forecast - by Application
- 5.2.1. Billboard
- 5.2.2. Transit
- 5.2.3. Street Furniture
- 5.2.4. Other Applications
- 5.3. Market Analysis, Insights and Forecast - by End User
- 5.3.1. Retail
- 5.3.2. Healthcare/Pharmaceuticals
- 5.3.3. Financial Services
- 5.3.4. Automotive
- 5.3.5. Telecom/Utilities
- 5.3.6. Government Agencies
- 5.3.7. Other End Users
- 5.4. Market Analysis, Insights and Forecast - by Region
- 5.4.1. North America
- 5.4.2. South America
- 5.4.3. Europe
- 5.4.4. Middle East & Africa
- 5.4.5. Asia Pacific
- 5.1. Market Analysis, Insights and Forecast - by Location
- 6. Global APAC DOOH Market Analysis, Insights and Forecast, 2021-2033
- 6.1. Market Analysis, Insights and Forecast - by Location
- 6.1.1. Indoor
- 6.1.2. Outdoor
- 6.2. Market Analysis, Insights and Forecast - by Application
- 6.2.1. Billboard
- 6.2.2. Transit
- 6.2.3. Street Furniture
- 6.2.4. Other Applications
- 6.3. Market Analysis, Insights and Forecast - by End User
- 6.3.1. Retail
- 6.3.2. Healthcare/Pharmaceuticals
- 6.3.3. Financial Services
- 6.3.4. Automotive
- 6.3.5. Telecom/Utilities
- 6.3.6. Government Agencies
- 6.3.7. Other End Users
- 6.1. Market Analysis, Insights and Forecast - by Location
- 7. North America APAC DOOH Market Analysis, Insights and Forecast, 2021-2033
- 7.1. Market Analysis, Insights and Forecast - by Location
- 7.1.1. Indoor
- 7.1.2. Outdoor
- 7.2. Market Analysis, Insights and Forecast - by Application
- 7.2.1. Billboard
- 7.2.2. Transit
- 7.2.3. Street Furniture
- 7.2.4. Other Applications
- 7.3. Market Analysis, Insights and Forecast - by End User
- 7.3.1. Retail
- 7.3.2. Healthcare/Pharmaceuticals
- 7.3.3. Financial Services
- 7.3.4. Automotive
- 7.3.5. Telecom/Utilities
- 7.3.6. Government Agencies
- 7.3.7. Other End Users
- 7.1. Market Analysis, Insights and Forecast - by Location
- 8. South America APAC DOOH Market Analysis, Insights and Forecast, 2021-2033
- 8.1. Market Analysis, Insights and Forecast - by Location
- 8.1.1. Indoor
- 8.1.2. Outdoor
- 8.2. Market Analysis, Insights and Forecast - by Application
- 8.2.1. Billboard
- 8.2.2. Transit
- 8.2.3. Street Furniture
- 8.2.4. Other Applications
- 8.3. Market Analysis, Insights and Forecast - by End User
- 8.3.1. Retail
- 8.3.2. Healthcare/Pharmaceuticals
- 8.3.3. Financial Services
- 8.3.4. Automotive
- 8.3.5. Telecom/Utilities
- 8.3.6. Government Agencies
- 8.3.7. Other End Users
- 8.1. Market Analysis, Insights and Forecast - by Location
- 9. Europe APAC DOOH Market Analysis, Insights and Forecast, 2021-2033
- 9.1. Market Analysis, Insights and Forecast - by Location
- 9.1.1. Indoor
- 9.1.2. Outdoor
- 9.2. Market Analysis, Insights and Forecast - by Application
- 9.2.1. Billboard
- 9.2.2. Transit
- 9.2.3. Street Furniture
- 9.2.4. Other Applications
- 9.3. Market Analysis, Insights and Forecast - by End User
- 9.3.1. Retail
- 9.3.2. Healthcare/Pharmaceuticals
- 9.3.3. Financial Services
- 9.3.4. Automotive
- 9.3.5. Telecom/Utilities
- 9.3.6. Government Agencies
- 9.3.7. Other End Users
- 9.1. Market Analysis, Insights and Forecast - by Location
- 10. Middle East & Africa APAC DOOH Market Analysis, Insights and Forecast, 2021-2033
- 10.1. Market Analysis, Insights and Forecast - by Location
- 10.1.1. Indoor
- 10.1.2. Outdoor
- 10.2. Market Analysis, Insights and Forecast - by Application
- 10.2.1. Billboard
- 10.2.2. Transit
- 10.2.3. Street Furniture
- 10.2.4. Other Applications
- 10.3. Market Analysis, Insights and Forecast - by End User
- 10.3.1. Retail
- 10.3.2. Healthcare/Pharmaceuticals
- 10.3.3. Financial Services
- 10.3.4. Automotive
- 10.3.5. Telecom/Utilities
- 10.3.6. Government Agencies
- 10.3.7. Other End Users
- 10.1. Market Analysis, Insights and Forecast - by Location
- 11. Asia Pacific APAC DOOH Market Analysis, Insights and Forecast, 2021-2033
- 11.1. Market Analysis, Insights and Forecast - by Location
- 11.1.1. Indoor
- 11.1.2. Outdoor
- 11.2. Market Analysis, Insights and Forecast - by Application
- 11.2.1. Billboard
- 11.2.2. Transit
- 11.2.3. Street Furniture
- 11.2.4. Other Applications
- 11.3. Market Analysis, Insights and Forecast - by End User
- 11.3.1. Retail
- 11.3.2. Healthcare/Pharmaceuticals
- 11.3.3. Financial Services
- 11.3.4. Automotive
- 11.3.5. Telecom/Utilities
- 11.3.6. Government Agencies
- 11.3.7. Other End Users
- 11.1. Market Analysis, Insights and Forecast - by Location
- 12. Competitive Analysis
- 12.1. Company Profiles
- 12.1.1 JCDecaux Group
- 12.1.1.1. Company Overview
- 12.1.1.2. Products
- 12.1.1.3. Company Financials
- 12.1.1.4. SWOT Analysis
- 12.1.2 Eye Media LLC*List Not Exhaustive
- 12.1.2.1. Company Overview
- 12.1.2.2. Products
- 12.1.2.3. Company Financials
- 12.1.2.4. SWOT Analysis
- 12.1.3 Daktronics Inc
- 12.1.3.1. Company Overview
- 12.1.3.2. Products
- 12.1.3.3. Company Financials
- 12.1.3.4. SWOT Analysis
- 12.1.4 The Times Group
- 12.1.4.1. Company Overview
- 12.1.4.2. Products
- 12.1.4.3. Company Financials
- 12.1.4.4. SWOT Analysis
- 12.1.5 Outfront Media Inc
- 12.1.5.1. Company Overview
- 12.1.5.2. Products
- 12.1.5.3. Company Financials
- 12.1.5.4. SWOT Analysis
- 12.1.6 BroadSign International LLC
- 12.1.6.1. Company Overview
- 12.1.6.2. Products
- 12.1.6.3. Company Financials
- 12.1.6.4. SWOT Analysis
- 12.1.7 oOh!media Limited
- 12.1.7.1. Company Overview
- 12.1.7.2. Products
- 12.1.7.3. Company Financials
- 12.1.7.4. SWOT Analysis
- 12.1.8 Talon Outdoor Ltd
- 12.1.8.1. Company Overview
- 12.1.8.2. Products
- 12.1.8.3. Company Financials
- 12.1.8.4. SWOT Analysis
- 12.1.9 Clear Channel Outdoor Holdings Inc
- 12.1.9.1. Company Overview
- 12.1.9.2. Products
- 12.1.9.3. Company Financials
- 12.1.9.4. SWOT Analysis
- 12.1.1 JCDecaux Group
- 12.2. Market Entropy
- 12.2.1 Company's Key Areas Served
- 12.2.2 Recent Developments
- 12.3. Company Market Share Analysis 2025
- 12.3.1 Top 5 Companies Market Share Analysis
- 12.3.2 Top 3 Companies Market Share Analysis
- 12.4. List of Potential Customers
- 13. Research Methodology
List of Figures
- Figure 1: Global APAC DOOH Market Revenue Breakdown (Million, %) by Region 2025 & 2033
- Figure 2: North America APAC DOOH Market Revenue (Million), by Location 2025 & 2033
- Figure 3: North America APAC DOOH Market Revenue Share (%), by Location 2025 & 2033
- Figure 4: North America APAC DOOH Market Revenue (Million), by Application 2025 & 2033
- Figure 5: North America APAC DOOH Market Revenue Share (%), by Application 2025 & 2033
- Figure 6: North America APAC DOOH Market Revenue (Million), by End User 2025 & 2033
- Figure 7: North America APAC DOOH Market Revenue Share (%), by End User 2025 & 2033
- Figure 8: North America APAC DOOH Market Revenue (Million), by Country 2025 & 2033
- Figure 9: North America APAC DOOH Market Revenue Share (%), by Country 2025 & 2033
- Figure 10: South America APAC DOOH Market Revenue (Million), by Location 2025 & 2033
- Figure 11: South America APAC DOOH Market Revenue Share (%), by Location 2025 & 2033
- Figure 12: South America APAC DOOH Market Revenue (Million), by Application 2025 & 2033
- Figure 13: South America APAC DOOH Market Revenue Share (%), by Application 2025 & 2033
- Figure 14: South America APAC DOOH Market Revenue (Million), by End User 2025 & 2033
- Figure 15: South America APAC DOOH Market Revenue Share (%), by End User 2025 & 2033
- Figure 16: South America APAC DOOH Market Revenue (Million), by Country 2025 & 2033
- Figure 17: South America APAC DOOH Market Revenue Share (%), by Country 2025 & 2033
- Figure 18: Europe APAC DOOH Market Revenue (Million), by Location 2025 & 2033
- Figure 19: Europe APAC DOOH Market Revenue Share (%), by Location 2025 & 2033
- Figure 20: Europe APAC DOOH Market Revenue (Million), by Application 2025 & 2033
- Figure 21: Europe APAC DOOH Market Revenue Share (%), by Application 2025 & 2033
- Figure 22: Europe APAC DOOH Market Revenue (Million), by End User 2025 & 2033
- Figure 23: Europe APAC DOOH Market Revenue Share (%), by End User 2025 & 2033
- Figure 24: Europe APAC DOOH Market Revenue (Million), by Country 2025 & 2033
- Figure 25: Europe APAC DOOH Market Revenue Share (%), by Country 2025 & 2033
- Figure 26: Middle East & Africa APAC DOOH Market Revenue (Million), by Location 2025 & 2033
- Figure 27: Middle East & Africa APAC DOOH Market Revenue Share (%), by Location 2025 & 2033
- Figure 28: Middle East & Africa APAC DOOH Market Revenue (Million), by Application 2025 & 2033
- Figure 29: Middle East & Africa APAC DOOH Market Revenue Share (%), by Application 2025 & 2033
- Figure 30: Middle East & Africa APAC DOOH Market Revenue (Million), by End User 2025 & 2033
- Figure 31: Middle East & Africa APAC DOOH Market Revenue Share (%), by End User 2025 & 2033
- Figure 32: Middle East & Africa APAC DOOH Market Revenue (Million), by Country 2025 & 2033
- Figure 33: Middle East & Africa APAC DOOH Market Revenue Share (%), by Country 2025 & 2033
- Figure 34: Asia Pacific APAC DOOH Market Revenue (Million), by Location 2025 & 2033
- Figure 35: Asia Pacific APAC DOOH Market Revenue Share (%), by Location 2025 & 2033
- Figure 36: Asia Pacific APAC DOOH Market Revenue (Million), by Application 2025 & 2033
- Figure 37: Asia Pacific APAC DOOH Market Revenue Share (%), by Application 2025 & 2033
- Figure 38: Asia Pacific APAC DOOH Market Revenue (Million), by End User 2025 & 2033
- Figure 39: Asia Pacific APAC DOOH Market Revenue Share (%), by End User 2025 & 2033
- Figure 40: Asia Pacific APAC DOOH Market Revenue (Million), by Country 2025 & 2033
- Figure 41: Asia Pacific APAC DOOH Market Revenue Share (%), by Country 2025 & 2033
List of Tables
- Table 1: Global APAC DOOH Market Revenue Million Forecast, by Location 2020 & 2033
- Table 2: Global APAC DOOH Market Revenue Million Forecast, by Application 2020 & 2033
- Table 3: Global APAC DOOH Market Revenue Million Forecast, by End User 2020 & 2033
- Table 4: Global APAC DOOH Market Revenue Million Forecast, by Region 2020 & 2033
- Table 5: Global APAC DOOH Market Revenue Million Forecast, by Location 2020 & 2033
- Table 6: Global APAC DOOH Market Revenue Million Forecast, by Application 2020 & 2033
- Table 7: Global APAC DOOH Market Revenue Million Forecast, by End User 2020 & 2033
- Table 8: Global APAC DOOH Market Revenue Million Forecast, by Country 2020 & 2033
- Table 9: United States APAC DOOH Market Revenue (Million) Forecast, by Application 2020 & 2033
- Table 10: Canada APAC DOOH Market Revenue (Million) Forecast, by Application 2020 & 2033
- Table 11: Mexico APAC DOOH Market Revenue (Million) Forecast, by Application 2020 & 2033
- Table 12: Global APAC DOOH Market Revenue Million Forecast, by Location 2020 & 2033
- Table 13: Global APAC DOOH Market Revenue Million Forecast, by Application 2020 & 2033
- Table 14: Global APAC DOOH Market Revenue Million Forecast, by End User 2020 & 2033
- Table 15: Global APAC DOOH Market Revenue Million Forecast, by Country 2020 & 2033
- Table 16: Brazil APAC DOOH Market Revenue (Million) Forecast, by Application 2020 & 2033
- Table 17: Argentina APAC DOOH Market Revenue (Million) Forecast, by Application 2020 & 2033
- Table 18: Rest of South America APAC DOOH Market Revenue (Million) Forecast, by Application 2020 & 2033
- Table 19: Global APAC DOOH Market Revenue Million Forecast, by Location 2020 & 2033
- Table 20: Global APAC DOOH Market Revenue Million Forecast, by Application 2020 & 2033
- Table 21: Global APAC DOOH Market Revenue Million Forecast, by End User 2020 & 2033
- Table 22: Global APAC DOOH Market Revenue Million Forecast, by Country 2020 & 2033
- Table 23: United Kingdom APAC DOOH Market Revenue (Million) Forecast, by Application 2020 & 2033
- Table 24: Germany APAC DOOH Market Revenue (Million) Forecast, by Application 2020 & 2033
- Table 25: France APAC DOOH Market Revenue (Million) Forecast, by Application 2020 & 2033
- Table 26: Italy APAC DOOH Market Revenue (Million) Forecast, by Application 2020 & 2033
- Table 27: Spain APAC DOOH Market Revenue (Million) Forecast, by Application 2020 & 2033
- Table 28: Russia APAC DOOH Market Revenue (Million) Forecast, by Application 2020 & 2033
- Table 29: Benelux APAC DOOH Market Revenue (Million) Forecast, by Application 2020 & 2033
- Table 30: Nordics APAC DOOH Market Revenue (Million) Forecast, by Application 2020 & 2033
- Table 31: Rest of Europe APAC DOOH Market Revenue (Million) Forecast, by Application 2020 & 2033
- Table 32: Global APAC DOOH Market Revenue Million Forecast, by Location 2020 & 2033
- Table 33: Global APAC DOOH Market Revenue Million Forecast, by Application 2020 & 2033
- Table 34: Global APAC DOOH Market Revenue Million Forecast, by End User 2020 & 2033
- Table 35: Global APAC DOOH Market Revenue Million Forecast, by Country 2020 & 2033
- Table 36: Turkey APAC DOOH Market Revenue (Million) Forecast, by Application 2020 & 2033
- Table 37: Israel APAC DOOH Market Revenue (Million) Forecast, by Application 2020 & 2033
- Table 38: GCC APAC DOOH Market Revenue (Million) Forecast, by Application 2020 & 2033
- Table 39: North Africa APAC DOOH Market Revenue (Million) Forecast, by Application 2020 & 2033
- Table 40: South Africa APAC DOOH Market Revenue (Million) Forecast, by Application 2020 & 2033
- Table 41: Rest of Middle East & Africa APAC DOOH Market Revenue (Million) Forecast, by Application 2020 & 2033
- Table 42: Global APAC DOOH Market Revenue Million Forecast, by Location 2020 & 2033
- Table 43: Global APAC DOOH Market Revenue Million Forecast, by Application 2020 & 2033
- Table 44: Global APAC DOOH Market Revenue Million Forecast, by End User 2020 & 2033
- Table 45: Global APAC DOOH Market Revenue Million Forecast, by Country 2020 & 2033
- Table 46: China APAC DOOH Market Revenue (Million) Forecast, by Application 2020 & 2033
- Table 47: India APAC DOOH Market Revenue (Million) Forecast, by Application 2020 & 2033
- Table 48: Japan APAC DOOH Market Revenue (Million) Forecast, by Application 2020 & 2033
- Table 49: South Korea APAC DOOH Market Revenue (Million) Forecast, by Application 2020 & 2033
- Table 50: ASEAN APAC DOOH Market Revenue (Million) Forecast, by Application 2020 & 2033
- Table 51: Oceania APAC DOOH Market Revenue (Million) Forecast, by Application 2020 & 2033
- Table 52: Rest of Asia Pacific APAC DOOH Market Revenue (Million) Forecast, by Application 2020 & 2033
Frequently Asked Questions
1. What is the projected Compound Annual Growth Rate (CAGR) of the APAC DOOH Market?
The projected CAGR is approximately 12.34%.
2. Which companies are prominent players in the APAC DOOH Market?
Key companies in the market include JCDecaux Group, Eye Media LLC*List Not Exhaustive, Daktronics Inc, The Times Group, Outfront Media Inc, BroadSign International LLC, oOh!media Limited, Talon Outdoor Ltd, Clear Channel Outdoor Holdings Inc.
3. What are the main segments of the APAC DOOH Market?
The market segments include Location, Application, End User.
4. Can you provide details about the market size?
The market size is estimated to be USD 19.26 Million as of 2022.
5. What are some drivers contributing to market growth?
Increasing Adoption of Digital Screens; High Advertising Flexibility with Connected Screens.
6. What are the notable trends driving market growth?
Transit is Expected to Hold Major Share.
7. Are there any restraints impacting market growth?
High Installation and Maintenance Costs.
8. Can you provide examples of recent developments in the market?
April 2022 - Group M, a media investment and outdoor advertising technology provider, has announced its partnership with Moving Walls to bring automation and accountability to digital-out-of-home (DOOH) advertising in Malaysia. The partnership will help clients of Group M to leverage Moving Audiences Plus, an audience data-driven planning, buying, measurement, and ad-play verification solution that can activate all connected DOOH screens across the country.
9. What pricing options are available for accessing the report?
Pricing options include single-user, multi-user, and enterprise licenses priced at USD 4750, USD 4950, and USD 6800 respectively.
10. Is the market size provided in terms of value or volume?
The market size is provided in terms of value, measured in Million.
11. Are there any specific market keywords associated with the report?
Yes, the market keyword associated with the report is "APAC DOOH Market," which aids in identifying and referencing the specific market segment covered.
12. How do I determine which pricing option suits my needs best?
The pricing options vary based on user requirements and access needs. Individual users may opt for single-user licenses, while businesses requiring broader access may choose multi-user or enterprise licenses for cost-effective access to the report.
13. Are there any additional resources or data provided in the APAC DOOH Market report?
While the report offers comprehensive insights, it's advisable to review the specific contents or supplementary materials provided to ascertain if additional resources or data are available.
14. How can I stay updated on further developments or reports in the APAC DOOH Market?
To stay informed about further developments, trends, and reports in the APAC DOOH Market, consider subscribing to industry newsletters, following relevant companies and organizations, or regularly checking reputable industry news sources and publications.
Methodology
Step 1 - Identification of Relevant Samples Size from Population Database


Step 2 - Approaches for Defining Global Market Size (Value, Volume* & Price*)

Note*: In applicable scenarios
Step 3 - Data Sources
Primary Research
- Web Analytics
- Survey Reports
- Research Institute
- Latest Research Reports
- Opinion Leaders
Secondary Research
- Annual Reports
- White Paper
- Latest Press Release
- Industry Association
- Paid Database
- Investor Presentations

Step 4 - Data Triangulation
Involves using different sources of information in order to increase the validity of a study
These sources are likely to be stakeholders in a program - participants, other researchers, program staff, other community members, and so on.
Then we put all data in single framework & apply various statistical tools to find out the dynamic on the market.
During the analysis stage, feedback from the stakeholder groups would be compared to determine areas of agreement as well as areas of divergence