


Key Insights
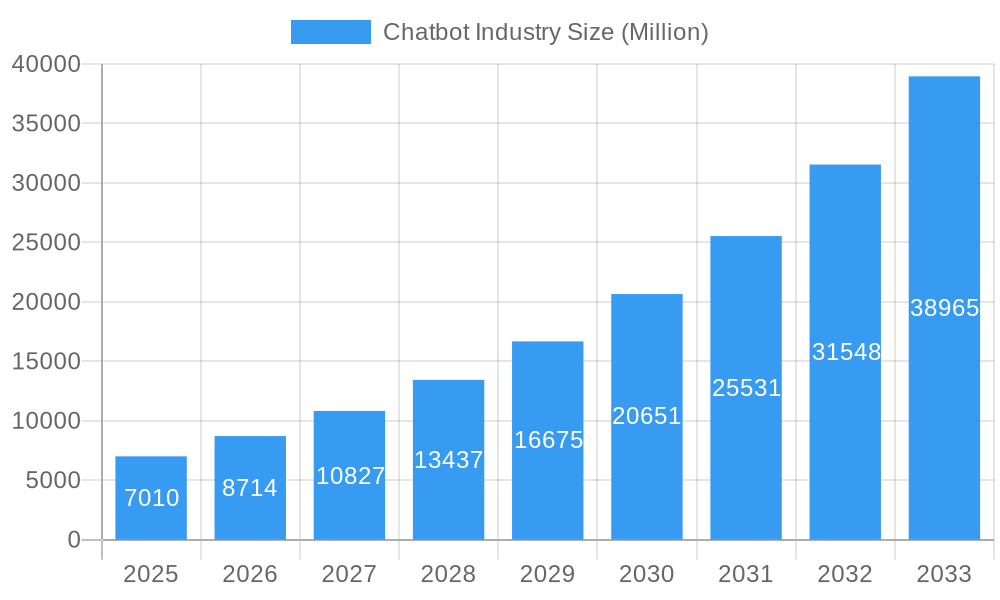
The global chatbot market is experiencing robust growth, projected to reach a substantial size with a Compound Annual Growth Rate (CAGR) of 24.32% from 2025 to 2033. This expansion is fueled by several key drivers. The increasing adoption of digital transformation strategies across various sectors, including BFSI (Banking, Financial Services, and Insurance), healthcare, IT and telecommunications, retail, and travel and hospitality, is a major catalyst. Businesses are leveraging chatbots to enhance customer service, automate processes, and improve operational efficiency. The rising demand for 24/7 customer support, coupled with the advancements in artificial intelligence (AI) and natural language processing (NLP) technologies, are further contributing to market growth. While data privacy concerns and the need for continuous chatbot improvement present some challenges, the overall market outlook remains extremely positive.
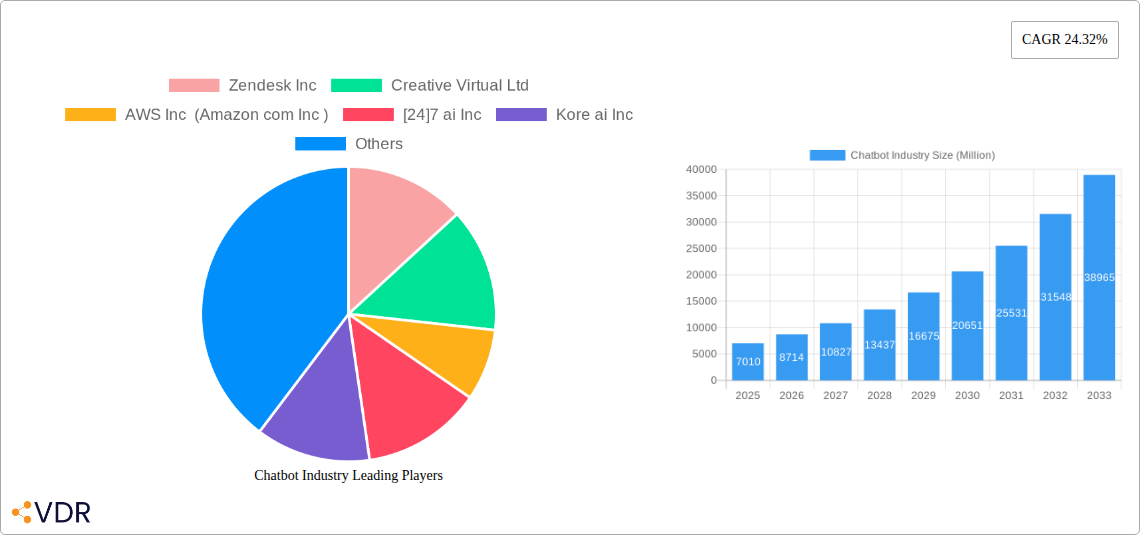
Chatbot Industry Market Size (In Billion)

The competitive landscape is characterized by a mix of established tech giants like Amazon Web Services (AWS), Microsoft (through Nuance), Google (Dialogflow), and IBM, alongside specialized chatbot providers such as Zendesk, Creative Virtual, and Kore.ai. These companies are continuously innovating, offering solutions ranging from simple rule-based chatbots to sophisticated AI-powered conversational interfaces. Geographic growth is expected to be widespread, with North America and Europe currently holding significant market share. However, the Asia-Pacific region is poised for rapid expansion due to increasing digital adoption and a burgeoning tech sector in countries like China and India. The market segmentation by end-user vertical highlights the diverse applications of chatbots across numerous industries, indicating a broad and resilient market with significant future potential.
Chatbot Industry Company Market Share
Chatbot Industry Market Report: 2019-2033
This comprehensive report provides an in-depth analysis of the chatbot industry, encompassing market dynamics, growth trends, regional segmentation, product landscape, key players, and future outlook. With a study period spanning 2019-2033, a base year of 2025, and a forecast period of 2025-2033, this report offers invaluable insights for industry professionals, investors, and strategic decision-makers. The report covers a parent market of Artificial Intelligence (AI) and the child market of Conversational AI. Market values are presented in millions of units.
Chatbot Industry Market Dynamics & Structure
The chatbot market exhibits a moderately concentrated structure, with a few major players holding significant market share. However, the market is also characterized by a high degree of innovation, driving continuous evolution and disruption. Technological advancements, particularly in Natural Language Processing (NLP) and Machine Learning (ML), are key drivers. Regulatory frameworks surrounding data privacy and security significantly impact market dynamics. Competitive substitutes include traditional customer service channels and increasingly sophisticated human-agent interactions. The end-user demographic is expanding rapidly, encompassing businesses across various verticals and individual consumers. M&A activity within the chatbot industry has been relatively high, reflecting the rapid growth and consolidation of market leadership.
- Market Concentration: Moderately concentrated, with top 5 players holding xx% of market share (2024).
- Technological Innovation: Rapid advancements in NLP, ML, and AI drive market growth.
- Regulatory Frameworks: GDPR, CCPA, and other data privacy regulations influence market strategies.
- Competitive Substitutes: Traditional call centers, email support, and human agents.
- M&A Activity: xx deals closed between 2019-2024, with an average deal value of $xx million.
- Innovation Barriers: High R&D costs, talent acquisition challenges, and integration complexities.
Chatbot Industry Growth Trends & Insights
The global chatbot market experienced substantial growth during the historical period (2019-2024), fueled by increasing digitalization across various sectors. The market size reached $xx million in 2024, and is projected to witness a Compound Annual Growth Rate (CAGR) of xx% during the forecast period (2025-2033), reaching $xx million by 2033. Adoption rates have increased significantly, driven by the rising need for efficient customer service and automation across businesses. Technological disruptions, such as the integration of advanced AI capabilities like GPT models, are further accelerating market growth. Consumer behavior shifts toward self-service and instant gratification also contribute to the market's expansion. Market penetration remains relatively low, indicating significant future growth potential.
Dominant Regions, Countries, or Segments in Chatbot Industry
North America currently holds the largest market share in the chatbot industry, followed by Europe and Asia-Pacific. Within the end-user verticals, the BFSI (Banking, Financial Services, and Insurance) sector is currently the dominant segment, driven by the high demand for automated customer service and fraud detection. The healthcare sector is also showing strong growth potential due to the increasing need for efficient patient care and remote diagnostics.
- North America: High adoption rate, advanced technological infrastructure, and significant investments in AI.
- BFSI: High demand for automated customer service, fraud prevention, and risk management solutions.
- Healthcare: Growing need for efficient patient care, appointment scheduling, and remote monitoring.
- IT and Telecommunication: Automation of customer support and network management processes.
- Retail: Improved customer experience through personalized recommendations and order management.
- Travel and Hospitality: Enhanced booking management, customer service, and personalized recommendations.
Chatbot Industry Product Landscape
The chatbot market offers a diverse range of products, from simple rule-based chatbots to sophisticated AI-powered virtual assistants. Key innovations include enhanced natural language understanding, integration with various communication channels (e.g., WhatsApp, Facebook Messenger), and personalized user experiences. Performance metrics often focus on response time, customer satisfaction, and task completion rates. Unique selling propositions include seamless integration with existing CRM systems and analytics dashboards providing valuable insights into customer interactions. Technological advancements, including the integration of Generative AI, are creating increasingly sophisticated and human-like conversational experiences.
Key Drivers, Barriers & Challenges in Chatbot Industry
Key Drivers:
- Increasing demand for automated customer service.
- Advancements in AI and NLP technologies.
- Rising adoption of cloud-based solutions.
- Growing need for cost optimization and operational efficiency.
Key Challenges:
- High implementation costs and integration complexities.
- Data security and privacy concerns.
- Maintaining the human touch and avoiding frustrating user experiences.
- Limited understanding of natural language nuances.
- Competition from established players and new entrants. The market is expected to experience a 15% decrease in profit margin due to increased competition.
Emerging Opportunities in Chatbot Industry
- Expansion into untapped markets like education and government.
- Integration with IoT devices for smart home and workplace applications.
- Development of chatbots specializing in specific tasks like appointment scheduling or technical support.
- Creation of hyper-personalized experiences through advanced AI and user data analysis.
Growth Accelerators in the Chatbot Industry
Technological breakthroughs in NLP and ML will continue to drive significant growth. Strategic partnerships between chatbot providers and enterprise software companies will further enhance market penetration. Expansion into new verticals and geographical markets, coupled with the development of innovative applications, will fuel market expansion in the coming years.
Key Players Shaping the Chatbot Industry Market
- Zendesk Inc
- Creative Virtual Ltd
- AWS Inc (Amazon com Inc)
- 24/7 ai Inc
- Kore ai Inc
- LiveChat Inc
- IBM Corporation
- Nuance Communications Inc (Microsoft Corp)
- Artificial Solutions International AB
- Inbenta Holdings Inc
- Avaamo Inc
- Amelia US LLC (Ipsoft Inc)
- Egain Corporation
- Serviceaide Inc
- Dialogflow (Google)
- EdgeVerve Systems Limited
Notable Milestones in Chatbot Industry Sector
- April 2023: Kore.ai integrated its conversational AgentAssist with Zendesk Inc., enhancing customer service capabilities.
- March 2023: Nuance launched Nuance Mix Answers with GPT-powered functionality, enhancing call center AI solutions.
In-Depth Chatbot Industry Market Outlook
The chatbot market is poised for continued strong growth, driven by technological advancements and increasing demand for automation across various sectors. Strategic partnerships, investments in R&D, and expansion into new markets will further fuel market expansion. The integration of Generative AI capabilities will create increasingly sophisticated and human-like conversational experiences, opening new possibilities for businesses and consumers alike. The market's long-term potential is significant, offering ample opportunities for innovation and growth.
Chatbot Industry Segmentation
-
1. End-user Vertical
- 1.1. BFSI
- 1.2. Healthcare
- 1.3. IT and Telecommunication
- 1.4. Retail
- 1.5. Travel and Hospitality
- 1.6. Other End-user Verticals
Chatbot Industry Segmentation By Geography
- 1. North America
- 2. Europe
- 3. Asia
- 4. Australia and New Zealand
- 5. Latin America
- 6. Middle East and Africa
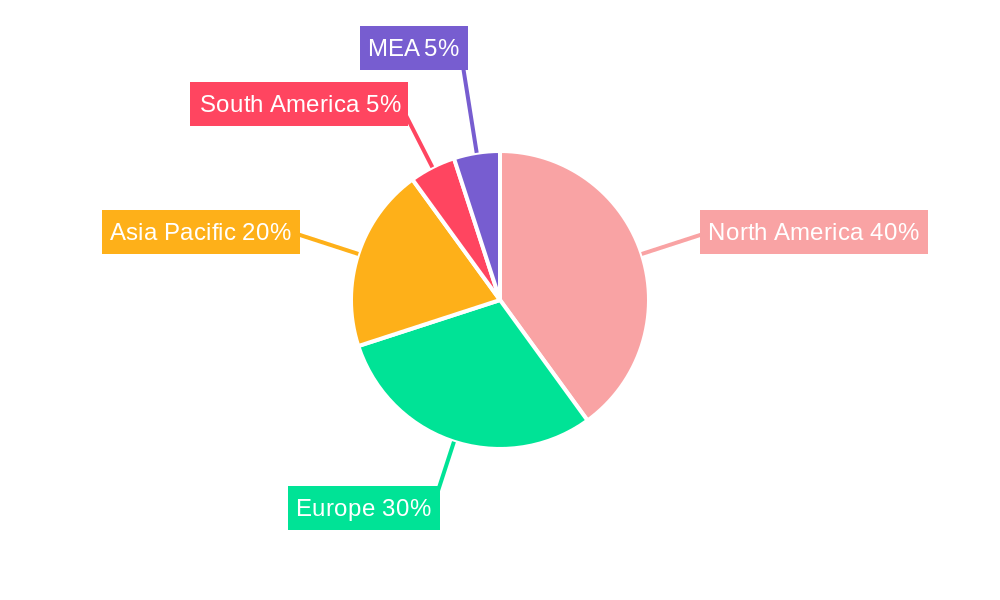
Chatbot Industry Regional Market Share
Geographic Coverage of Chatbot Industry
Chatbot Industry REPORT HIGHLIGHTS
| Aspects | Details |
|---|---|
| Study Period | 2020-2034 |
| Base Year | 2025 |
| Estimated Year | 2026 |
| Forecast Period | 2026-2034 |
| Historical Period | 2020-2025 |
| Growth Rate | CAGR of 24.32% from 2020-2034 |
| Segmentation |
|
Table of Contents
- 1. Introduction
- 1.1. Research Scope
- 1.2. Market Segmentation
- 1.3. Research Methodology
- 1.4. Definitions and Assumptions
- 2. Executive Summary
- 2.1. Introduction
- 3. Market Dynamics
- 3.1. Introduction
- 3.2. Market Drivers
- 3.2.1. Rising Domination of Messenger Applications; Increasing Demand for Consumer Analytics
- 3.3. Market Restrains
- 3.3.1. Integration Complexities and Data Concerns
- 3.4. Market Trends
- 3.4.1. Retail to Have Significant Growth
- 4. Market Factor Analysis
- 4.1. Porters Five Forces
- 4.2. Supply/Value Chain
- 4.3. PESTEL analysis
- 4.4. Market Entropy
- 4.5. Patent/Trademark Analysis
- 5. Global Chatbot Industry Analysis, Insights and Forecast, 2020-2032
- 5.1. Market Analysis, Insights and Forecast - by End-user Vertical
- 5.1.1. BFSI
- 5.1.2. Healthcare
- 5.1.3. IT and Telecommunication
- 5.1.4. Retail
- 5.1.5. Travel and Hospitality
- 5.1.6. Other End-user Verticals
- 5.2. Market Analysis, Insights and Forecast - by Region
- 5.2.1. North America
- 5.2.2. Europe
- 5.2.3. Asia
- 5.2.4. Australia and New Zealand
- 5.2.5. Latin America
- 5.2.6. Middle East and Africa
- 5.1. Market Analysis, Insights and Forecast - by End-user Vertical
- 6. North America Chatbot Industry Analysis, Insights and Forecast, 2020-2032
- 6.1. Market Analysis, Insights and Forecast - by End-user Vertical
- 6.1.1. BFSI
- 6.1.2. Healthcare
- 6.1.3. IT and Telecommunication
- 6.1.4. Retail
- 6.1.5. Travel and Hospitality
- 6.1.6. Other End-user Verticals
- 6.1. Market Analysis, Insights and Forecast - by End-user Vertical
- 7. Europe Chatbot Industry Analysis, Insights and Forecast, 2020-2032
- 7.1. Market Analysis, Insights and Forecast - by End-user Vertical
- 7.1.1. BFSI
- 7.1.2. Healthcare
- 7.1.3. IT and Telecommunication
- 7.1.4. Retail
- 7.1.5. Travel and Hospitality
- 7.1.6. Other End-user Verticals
- 7.1. Market Analysis, Insights and Forecast - by End-user Vertical
- 8. Asia Chatbot Industry Analysis, Insights and Forecast, 2020-2032
- 8.1. Market Analysis, Insights and Forecast - by End-user Vertical
- 8.1.1. BFSI
- 8.1.2. Healthcare
- 8.1.3. IT and Telecommunication
- 8.1.4. Retail
- 8.1.5. Travel and Hospitality
- 8.1.6. Other End-user Verticals
- 8.1. Market Analysis, Insights and Forecast - by End-user Vertical
- 9. Australia and New Zealand Chatbot Industry Analysis, Insights and Forecast, 2020-2032
- 9.1. Market Analysis, Insights and Forecast - by End-user Vertical
- 9.1.1. BFSI
- 9.1.2. Healthcare
- 9.1.3. IT and Telecommunication
- 9.1.4. Retail
- 9.1.5. Travel and Hospitality
- 9.1.6. Other End-user Verticals
- 9.1. Market Analysis, Insights and Forecast - by End-user Vertical
- 10. Latin America Chatbot Industry Analysis, Insights and Forecast, 2020-2032
- 10.1. Market Analysis, Insights and Forecast - by End-user Vertical
- 10.1.1. BFSI
- 10.1.2. Healthcare
- 10.1.3. IT and Telecommunication
- 10.1.4. Retail
- 10.1.5. Travel and Hospitality
- 10.1.6. Other End-user Verticals
- 10.1. Market Analysis, Insights and Forecast - by End-user Vertical
- 11. Middle East and Africa Chatbot Industry Analysis, Insights and Forecast, 2020-2032
- 11.1. Market Analysis, Insights and Forecast - by End-user Vertical
- 11.1.1. BFSI
- 11.1.2. Healthcare
- 11.1.3. IT and Telecommunication
- 11.1.4. Retail
- 11.1.5. Travel and Hospitality
- 11.1.6. Other End-user Verticals
- 11.1. Market Analysis, Insights and Forecast - by End-user Vertical
- 12. Competitive Analysis
- 12.1. Global Market Share Analysis 2025
- 12.2. Company Profiles
- 12.2.1 Zendesk Inc
- 12.2.1.1. Overview
- 12.2.1.2. Products
- 12.2.1.3. SWOT Analysis
- 12.2.1.4. Recent Developments
- 12.2.1.5. Financials (Based on Availability)
- 12.2.2 Creative Virtual Ltd
- 12.2.2.1. Overview
- 12.2.2.2. Products
- 12.2.2.3. SWOT Analysis
- 12.2.2.4. Recent Developments
- 12.2.2.5. Financials (Based on Availability)
- 12.2.3 AWS Inc (Amazon com Inc )
- 12.2.3.1. Overview
- 12.2.3.2. Products
- 12.2.3.3. SWOT Analysis
- 12.2.3.4. Recent Developments
- 12.2.3.5. Financials (Based on Availability)
- 12.2.4 [24]7 ai Inc
- 12.2.4.1. Overview
- 12.2.4.2. Products
- 12.2.4.3. SWOT Analysis
- 12.2.4.4. Recent Developments
- 12.2.4.5. Financials (Based on Availability)
- 12.2.5 Kore ai Inc
- 12.2.5.1. Overview
- 12.2.5.2. Products
- 12.2.5.3. SWOT Analysis
- 12.2.5.4. Recent Developments
- 12.2.5.5. Financials (Based on Availability)
- 12.2.6 LiveChat Inc *List Not Exhaustive
- 12.2.6.1. Overview
- 12.2.6.2. Products
- 12.2.6.3. SWOT Analysis
- 12.2.6.4. Recent Developments
- 12.2.6.5. Financials (Based on Availability)
- 12.2.7 IBM Corporation
- 12.2.7.1. Overview
- 12.2.7.2. Products
- 12.2.7.3. SWOT Analysis
- 12.2.7.4. Recent Developments
- 12.2.7.5. Financials (Based on Availability)
- 12.2.8 Nuance Communications Inc (Microsoft Corp )
- 12.2.8.1. Overview
- 12.2.8.2. Products
- 12.2.8.3. SWOT Analysis
- 12.2.8.4. Recent Developments
- 12.2.8.5. Financials (Based on Availability)
- 12.2.9 Artificial Solutions International AB
- 12.2.9.1. Overview
- 12.2.9.2. Products
- 12.2.9.3. SWOT Analysis
- 12.2.9.4. Recent Developments
- 12.2.9.5. Financials (Based on Availability)
- 12.2.10 Inbenta Holdings Inc
- 12.2.10.1. Overview
- 12.2.10.2. Products
- 12.2.10.3. SWOT Analysis
- 12.2.10.4. Recent Developments
- 12.2.10.5. Financials (Based on Availability)
- 12.2.11 Avaamo Inc
- 12.2.11.1. Overview
- 12.2.11.2. Products
- 12.2.11.3. SWOT Analysis
- 12.2.11.4. Recent Developments
- 12.2.11.5. Financials (Based on Availability)
- 12.2.12 Amelia US LLC (Ipsoft Inc )
- 12.2.12.1. Overview
- 12.2.12.2. Products
- 12.2.12.3. SWOT Analysis
- 12.2.12.4. Recent Developments
- 12.2.12.5. Financials (Based on Availability)
- 12.2.13 Egain Corporation
- 12.2.13.1. Overview
- 12.2.13.2. Products
- 12.2.13.3. SWOT Analysis
- 12.2.13.4. Recent Developments
- 12.2.13.5. Financials (Based on Availability)
- 12.2.14 Serviceaide Inc
- 12.2.14.1. Overview
- 12.2.14.2. Products
- 12.2.14.3. SWOT Analysis
- 12.2.14.4. Recent Developments
- 12.2.14.5. Financials (Based on Availability)
- 12.2.15 Dialogflow (Google)
- 12.2.15.1. Overview
- 12.2.15.2. Products
- 12.2.15.3. SWOT Analysis
- 12.2.15.4. Recent Developments
- 12.2.15.5. Financials (Based on Availability)
- 12.2.16 EdgeVerve Systems Limited
- 12.2.16.1. Overview
- 12.2.16.2. Products
- 12.2.16.3. SWOT Analysis
- 12.2.16.4. Recent Developments
- 12.2.16.5. Financials (Based on Availability)
- 12.2.1 Zendesk Inc
List of Figures
- Figure 1: Global Chatbot Industry Revenue Breakdown (Million, %) by Region 2025 & 2033
- Figure 2: North America Chatbot Industry Revenue (Million), by End-user Vertical 2025 & 2033
- Figure 3: North America Chatbot Industry Revenue Share (%), by End-user Vertical 2025 & 2033
- Figure 4: North America Chatbot Industry Revenue (Million), by Country 2025 & 2033
- Figure 5: North America Chatbot Industry Revenue Share (%), by Country 2025 & 2033
- Figure 6: Europe Chatbot Industry Revenue (Million), by End-user Vertical 2025 & 2033
- Figure 7: Europe Chatbot Industry Revenue Share (%), by End-user Vertical 2025 & 2033
- Figure 8: Europe Chatbot Industry Revenue (Million), by Country 2025 & 2033
- Figure 9: Europe Chatbot Industry Revenue Share (%), by Country 2025 & 2033
- Figure 10: Asia Chatbot Industry Revenue (Million), by End-user Vertical 2025 & 2033
- Figure 11: Asia Chatbot Industry Revenue Share (%), by End-user Vertical 2025 & 2033
- Figure 12: Asia Chatbot Industry Revenue (Million), by Country 2025 & 2033
- Figure 13: Asia Chatbot Industry Revenue Share (%), by Country 2025 & 2033
- Figure 14: Australia and New Zealand Chatbot Industry Revenue (Million), by End-user Vertical 2025 & 2033
- Figure 15: Australia and New Zealand Chatbot Industry Revenue Share (%), by End-user Vertical 2025 & 2033
- Figure 16: Australia and New Zealand Chatbot Industry Revenue (Million), by Country 2025 & 2033
- Figure 17: Australia and New Zealand Chatbot Industry Revenue Share (%), by Country 2025 & 2033
- Figure 18: Latin America Chatbot Industry Revenue (Million), by End-user Vertical 2025 & 2033
- Figure 19: Latin America Chatbot Industry Revenue Share (%), by End-user Vertical 2025 & 2033
- Figure 20: Latin America Chatbot Industry Revenue (Million), by Country 2025 & 2033
- Figure 21: Latin America Chatbot Industry Revenue Share (%), by Country 2025 & 2033
- Figure 22: Middle East and Africa Chatbot Industry Revenue (Million), by End-user Vertical 2025 & 2033
- Figure 23: Middle East and Africa Chatbot Industry Revenue Share (%), by End-user Vertical 2025 & 2033
- Figure 24: Middle East and Africa Chatbot Industry Revenue (Million), by Country 2025 & 2033
- Figure 25: Middle East and Africa Chatbot Industry Revenue Share (%), by Country 2025 & 2033
List of Tables
- Table 1: Global Chatbot Industry Revenue Million Forecast, by End-user Vertical 2020 & 2033
- Table 2: Global Chatbot Industry Revenue Million Forecast, by Region 2020 & 2033
- Table 3: Global Chatbot Industry Revenue Million Forecast, by End-user Vertical 2020 & 2033
- Table 4: Global Chatbot Industry Revenue Million Forecast, by Country 2020 & 2033
- Table 5: Global Chatbot Industry Revenue Million Forecast, by End-user Vertical 2020 & 2033
- Table 6: Global Chatbot Industry Revenue Million Forecast, by Country 2020 & 2033
- Table 7: Global Chatbot Industry Revenue Million Forecast, by End-user Vertical 2020 & 2033
- Table 8: Global Chatbot Industry Revenue Million Forecast, by Country 2020 & 2033
- Table 9: Global Chatbot Industry Revenue Million Forecast, by End-user Vertical 2020 & 2033
- Table 10: Global Chatbot Industry Revenue Million Forecast, by Country 2020 & 2033
- Table 11: Global Chatbot Industry Revenue Million Forecast, by End-user Vertical 2020 & 2033
- Table 12: Global Chatbot Industry Revenue Million Forecast, by Country 2020 & 2033
- Table 13: Global Chatbot Industry Revenue Million Forecast, by End-user Vertical 2020 & 2033
- Table 14: Global Chatbot Industry Revenue Million Forecast, by Country 2020 & 2033
Frequently Asked Questions
1. What is the projected Compound Annual Growth Rate (CAGR) of the Chatbot Industry?
The projected CAGR is approximately 24.32%.
2. Which companies are prominent players in the Chatbot Industry?
Key companies in the market include Zendesk Inc, Creative Virtual Ltd, AWS Inc (Amazon com Inc ), [24]7 ai Inc, Kore ai Inc, LiveChat Inc *List Not Exhaustive, IBM Corporation, Nuance Communications Inc (Microsoft Corp ), Artificial Solutions International AB, Inbenta Holdings Inc, Avaamo Inc, Amelia US LLC (Ipsoft Inc ), Egain Corporation, Serviceaide Inc, Dialogflow (Google), EdgeVerve Systems Limited.
3. What are the main segments of the Chatbot Industry?
The market segments include End-user Vertical.
4. Can you provide details about the market size?
The market size is estimated to be USD 7.01 Million as of 2022.
5. What are some drivers contributing to market growth?
Rising Domination of Messenger Applications; Increasing Demand for Consumer Analytics.
6. What are the notable trends driving market growth?
Retail to Have Significant Growth.
7. Are there any restraints impacting market growth?
Integration Complexities and Data Concerns.
8. Can you provide examples of recent developments in the market?
April 2023 - Kore.ai disclosed that the firm had integrated its conversational AgentAssist with automated intelligent virtual assistant (IVA) support for Zendesk Inc. Through an everyday user experience, this AI virtual assistant for contact center employees manages the generation and sales processes, extending the capabilities of Zendesk Support across digital channels.
9. What pricing options are available for accessing the report?
Pricing options include single-user, multi-user, and enterprise licenses priced at USD 4750, USD 5250, and USD 8750 respectively.
10. Is the market size provided in terms of value or volume?
The market size is provided in terms of value, measured in Million.
11. Are there any specific market keywords associated with the report?
Yes, the market keyword associated with the report is "Chatbot Industry," which aids in identifying and referencing the specific market segment covered.
12. How do I determine which pricing option suits my needs best?
The pricing options vary based on user requirements and access needs. Individual users may opt for single-user licenses, while businesses requiring broader access may choose multi-user or enterprise licenses for cost-effective access to the report.
13. Are there any additional resources or data provided in the Chatbot Industry report?
While the report offers comprehensive insights, it's advisable to review the specific contents or supplementary materials provided to ascertain if additional resources or data are available.
14. How can I stay updated on further developments or reports in the Chatbot Industry?
To stay informed about further developments, trends, and reports in the Chatbot Industry, consider subscribing to industry newsletters, following relevant companies and organizations, or regularly checking reputable industry news sources and publications.
Methodology
Step 1 - Identification of Relevant Samples Size from Population Database


Step 2 - Approaches for Defining Global Market Size (Value, Volume* & Price*)

Note*: In applicable scenarios
Step 3 - Data Sources
Primary Research
- Web Analytics
- Survey Reports
- Research Institute
- Latest Research Reports
- Opinion Leaders
Secondary Research
- Annual Reports
- White Paper
- Latest Press Release
- Industry Association
- Paid Database
- Investor Presentations

Step 4 - Data Triangulation
Involves using different sources of information in order to increase the validity of a study
These sources are likely to be stakeholders in a program - participants, other researchers, program staff, other community members, and so on.
Then we put all data in single framework & apply various statistical tools to find out the dynamic on the market.
During the analysis stage, feedback from the stakeholder groups would be compared to determine areas of agreement as well as areas of divergence